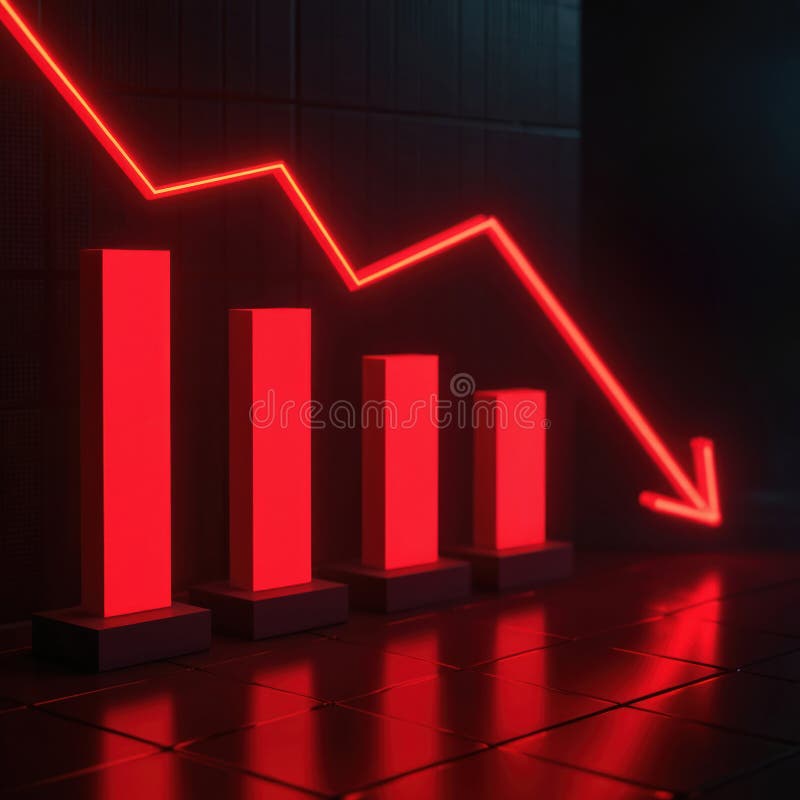
Free with trial A stark visual representation of a downward trend in business metrics and market conditions. Performance decrease illustrations Red arrow graph illustrates sharp decline in financial performance and economic downturn. A stark visual representation of a downward trend in business metrics and market conditions
Free with trial South Africa flag with a declining bar chart and down arrows, symbolizing decline in data, performance, or various national indicators in the country. Performance decrease illustrations Flag with a declining bar chart and down arrows
Free with trial Businessman pointing at a digital interface with interactive graphs showing quality and cost, where quality is increasing and cost is decreasing, representing trends in business performance, set in a professional and modern workspace. Performance decrease illustrations Businessman interacting with a digital interface showing quality and cost graphs with arrows pointing up and down. businessman pointing at a digital interface with interactive graphs showing quality and cost, where quality is increasing and cost is decreasing, representing trends in business performance, set in a professional and modern workspace
Free with trial A man presents a business strategy aimed at increasing quality and decreasing cost represented by arrows pointing up for quality and down for cost showcasing improved efficiency and profitability within a company The hand presentation signifies control optimization and forwardthinking initiatives. Performance decrease illustrations Business strategy concept presenting increase in quality and decrease in cost with a rising arrow and a falling arrow presented on. A man presents a business. A man presents a business strategy aimed at increasing quality and decreasing cost represented by arrows pointing up for quality and down for cost showcasing improved efficiency and profitability within a company The hand presentation signifies control optimization and forwardthinking initiatives
Free with trial A vibrant red arrow points downward against a clean, solid-colored backdrop, symbolizing a decline or shift in focus. This visual representation effectively conveys motion and change. Performance decrease illustrations Red downward arrow on a solid background indicating a decrease or direction change in trends. A vibrant red arrow points downward against a clean, solid-colored backdrop, symbolizing a decline or shift in focus. This visual representation effectively conveys motion and change.
Free with trial Three stacks of gold coins decrease in height from left to right, with a red arrow pointing downwards across them. Isolated on a transparent background. Performance decrease vectors Stacks of gold coins with red downward trend arrow isolated on a transparent background money. Three stacks of gold coins decrease in height from left to right, with a red arrow pointing downwards across them. Isolated on a transparent background
Free with trial Colorful growth chart featuring orange and teal bars with upward and downward arrows on a clean white background representing progress decline business data trends and financial performance metrics. Performance decrease illustrations Colorful growth chart with orange and teal bars and upward and downward arrows on white background. colorful growth chart featuring orange and teal bars with upward and downward arrows on a clean white background representing progress decline business data trends and financial performance metrics
Free with trial UK flag with a declining bar chart and down arrows, symbolizing decline in data, performance, or various national indicators in the country. Performance decrease illustrations Flag with a declining bar chart and down arrows
Free with trial Zambia flag with a declining bar chart and down arrows, symbolizing decline in data, performance, or various national indicators in the country. Performance decrease illustrations Flag with a declining bar chart and down arrows
Free with trial Yemen flag with a declining bar chart and down arrows, symbolizing decline in data, performance, or various national indicators in the country. Performance decrease illustrations Flag with a declining bar chart and down arrows
Free with trial Vietnam flag with a declining bar chart and down arrows, symbolizing decline in data, performance, or various national indicators in the country. Performance decrease illustrations Flag with a declining bar chart and down arrows
Free with trial Venezuela flag with a declining bar chart and down arrows, symbolizing decline in data, performance, or various national indicators in the country. Performance decrease illustrations Flag with a declining bar chart and down arrows
Free with trial Uruguay flag with a declining bar chart and down arrows, symbolizing decline in data, performance, or various national indicators in the country. Performance decrease illustrations Flag with a declining bar chart and down arrows
Free with trial Uzbekistan flag with a declining bar chart and down arrows, symbolizing decline in data, performance, or various national indicators in the country. Performance decrease illustrations Flag with a declining bar chart and down arrows
Free with trial USA flag with a declining bar chart and down arrows, symbolizing decline in data, performance, or various national indicators in the country. Performance decrease illustrations Flag with a declining bar chart and down arrows
Free with trial Ukraine flag with a declining bar chart and down arrows, symbolizing decline in data, performance, or various national indicators in the country. Performance decrease illustrations Flag with a declining bar chart and down arrows
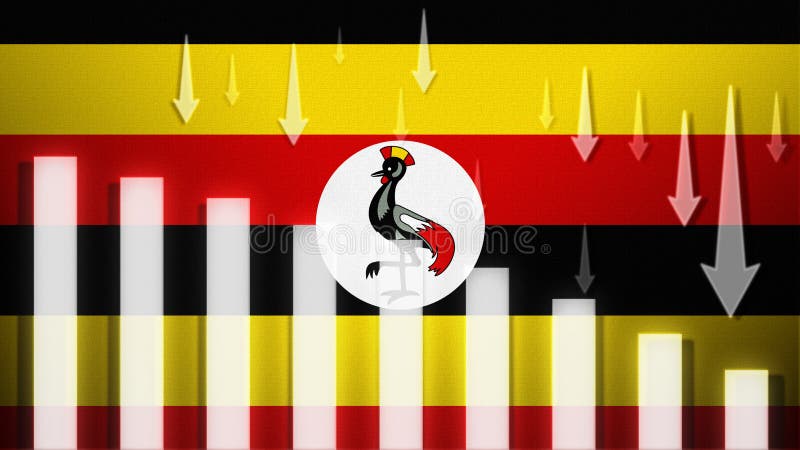
Free with trial Uganda flag with a declining bar chart and down arrows, symbolizing decline in data, performance, or various national indicators in the country. Performance decrease illustrations Flag with a declining bar chart and down arrows
Free with trial Taiwan flag with a declining bar chart and down arrows, symbolizing decline in data, performance, or various national indicators in the country. Performance decrease illustrations Flag with a declining bar chart and down arrows
Free with trial UAE flag with a declining bar chart and down arrows, symbolizing decline in data, performance, or various national indicators in the country. Performance decrease illustrations Flag with a declining bar chart and down arrows
Free with trial A character is gripping a large red arrow pointing downward, representing a decrease or decline in values, set against a clean white background. Performance decrease illustrations Character Holding a Large Red Downward Arrow Symbolizes Decline Against a Simple White Background. A character is gripping a large red arrow pointing downward, representing a decrease or decline in values, set against a clean white background
Free with trial A character stands alone, holding a large red arrow pointing downward, symbolizing a decline or decrease, set against a plain white backdrop. Performance decrease illustrations Character Holding a Large Red Downward Arrow Indicating Decline on a White Background. A character stands alone, holding a large red arrow pointing downward, symbolizing a decline or decrease, set against a plain white backdrop
Free with trial A character stands isolated and holds a large red downward arrow, representing a decrease in values or metrics. Performance decrease illustrations Character Holding a Large Red Downward Arrow Symbolizing Decline on a White Background. A character stands isolated and holds a large red downward arrow, representing a decrease in values or metrics
Free with trial A cartoon character is depicted holding a large red downward arrow, representing decrease or decline against a plain white background. Performance decrease illustrations Character Holding a Large Red Downward Arrow Symbolizing Decline on a White Background. A cartoon character is depicted holding a large red downward arrow, representing decrease or decline against a plain white background
Free with trial A bold red arrow sharply declines in a zigzag pattern, symbolizing a steep drop in performance or value. This visual powerfully conveys financial loss, economic downturn, or negative trends. Performance decrease illustrations Red arrow descending sharp decline downward trend graph represents financial loss economic downturn. A bold red arrow sharply declines in a zigzag pattern, symbolizing a steep drop in performance or value. This visual powerfully conveys financial loss, economic downturn, or negative trends
Free with trial Reduction chart icon Black line art vector in black and white outline set collection sign. Performance decrease vectors Decline Chart Icon Illustrating Decrease in Performance, Economic Downturn, and Analytical Data. Reduction chart icon Black line art vector in black and white outline set collection sign
Free with trial Clock With Arrows Line And Solid Icon Set. Time Management, Efficiency, And Productivity Symbol Collection. Directional Arrows Indicating Increase And Decrease. Isolated Vector Illustration. Performance decrease vectors Clock With Arrows Line And Solid Icon Set. Time Management, Efficiency, And Productivity Symbol Collection. Directional
Free with trial The graphic illustrates stable bank withdrawals alongside a growing financial trend with upward movement, Bank withdrawals are currently stable and not showing any significant increase or decrease. Performance decrease vectors The graphic illustrates stable bank withdrawals alongside a growing financial trend with upward movement, Bank withdrawals are
Free with trial Bar Chart With Downward Trend Line Icon. Financial Decline, Economic Recession, And Market Analysis Outline Symbol. Business Performance Tracking. Editable Stroke. Isolated Vector Illustration. Performance decrease vectors Bar Chart With Downward Trend Line Icon. Financial Decline, Economic Recession, And Market Analysis Outline Symbol
Free with trial Bar Chart With Downward Trend Line Solid Icon. Financial Decline, Economic Downturn, And Market Analysis Silhouette Symbol. Business Performance Tracking. Isolated Vector Illustration. Performance decrease vectors Bar Chart With Downward Trend Line Solid Icon. Financial Decline, Economic Downturn, And Market Analysis Silhouette
Free with trial Vibrant bar chart visualization with dark background displaying data trends ,Generative ai. Performance decrease illustrations Colorful bar chart on dark background, data visualization for business performance analysis and trend insights. Vibrant bar chart visualization with dark background displaying data trends ,Generative ai
Free with trial Four stacks of Canadian coins, varying in height, are shown with red downward-pointing arrows on their sides. The isolated object on a white background symbolizes a decrease in currency value or economic downturn. created Ai. Performance decrease illustrations Canadian currency stacks with downward red arrows indicating financial decline isolated on white background. Four stacks of Canadian coins, varying in height, are shown with red downward-pointing arrows on their sides. The isolated object on a white background symbolizes a decrease in currency value or economic downturn. created Ai
Free with trial This compelling data visualization showcases a remarkable success story in optimizing website performance. Through insightful charts and graphs, the image reveals a significant decrease in bounce rates, a key indicator of user engagement. The visual narrative effectively communicates the positive impact of strategic website improvements, such as user-friendly navigation, compelling content, and. Performance decrease illustrations Boosting Website Engagement A Data Visualization Success Story Unveiling Low Bounce Rates and Increased User. This compelling data visualization showcases a remarkable success story in optimizing website performance. Through insightful charts and graphs, the image reveals a significant decrease in bounce rates, a key indicator of user engagement. The visual narrative effectively communicates the positive impact of strategic website improvements, such as user-friendly navigation, compelling content, and
Free with trial Businessmen hold coins, run on stack of money in bar chart. Complete of business competiition, pursuit of economic success, financial management, capital market performance, and profit growth. Performance decrease vectors Businessmen hold coins, run on stack of money in bar chart. Complete of business competiition, pursuit of economic success
Free with trial This vector illustration depicts a descending bar graph, representing decline and negative trends. It is suitable for financial reports, business analysis, and presentations. Performance decrease vectors Illustration of a descending bar graph, , representing decline, decrease, and negative trends in business or finance. This vector illustration depicts a descending bar graph, representing decline and negative trends. It is suitable for financial reports, business analysis, and presentations
Free with trial This vibrant bar chart infographic is a powerful tool for communicating complex data in a clear and engaging way. Ideal for business presentations, reports, and marketing materials, this visually appealing design highlights key performance indicators and trends. The clean, modern aesthetic ensures your message stands out, while the colorful bars and clear labels make understanding the statistics. Performance decrease illustrations Colorful Bar Chart Infographic Diagram A Modern Effective Data Visualization Template for Business Presentations. This vibrant bar chart infographic is a powerful tool for communicating complex data in a clear and engaging way. Ideal for business presentations, reports, and marketing materials, this visually appealing design highlights key performance indicators and trends. The clean, modern aesthetic ensures your message stands out, while the colorful bars and clear labels make understanding the statistics
Free with trial A businessman holds a coin, runs on stack of money in bar chart. Concepts of business development, pursuit of economic success, financial management, capital market performance, and profit growth. Performance decrease vectors A businessman holds a coin, runs on stack of money in bar chart. Concepts of business development, pursuit of economic success
Free with trial Businessman analyzes office management. The performance concept improves quality, speed, and efficiency and reduces costs. Cost Reduction concept. trend modern vector flat illustration. Performance decrease vectors Businessman analyzes office management. The performance concept improves quality, speed, and efficiency and reduces costs.
Free with trial Thailand flag with a declining bar chart and down arrows, symbolizing decline in data, performance, or various national indicators in the country. Performance decrease illustrations Flag with a declining bar chart and down arrows
Free with trial Tunisia flag with a declining bar chart and down arrows, symbolizing decline in data, performance, or various national indicators in the country. Performance decrease illustrations Flag with a declining bar chart and down arrows
Free with trial Sudan flag with a declining bar chart and down arrows, symbolizing decline in data, performance, or various national indicators in the country. Performance decrease illustrations Flag with a declining bar chart and down arrows
Free with trial Slovenia flag with a declining bar chart and down arrows, symbolizing decline in data, performance, or various national indicators in the country. Performance decrease illustrations Flag with a declining bar chart and down arrows
Free with trial Turkmenistan flag with a declining bar chart and down arrows, symbolizing decline in data, performance, or various national indicators in the country. Performance decrease illustrations Flag with a declining bar chart and down arrows
Free with trial Sri Lanka flag with a declining bar chart and down arrows, symbolizing decline in data, performance, or various national indicators in the country. Performance decrease illustrations Flag with a declining bar chart and down arrows
Free with trial Singapore flag with a declining bar chart and down arrows, symbolizing decline in data, performance, or various national indicators in the country. Performance decrease illustrations Flag with a declining bar chart and down arrows
Free with trial Sweden flag with a declining bar chart and down arrows, symbolizing decline in data, performance, or various national indicators in the country. Performance decrease illustrations Flag with a declining bar chart and down arrows
Free with trial Tajikistan flag with a declining bar chart and down arrows, symbolizing decline in data, performance, or various national indicators in the country. Performance decrease illustrations Flag with a declining bar chart and down arrows
Free with trial Trinidad and Tobago flag with a declining bar chart and down arrows, symbolizing decline in data, performance, or various national indicators in the country. Performance decrease illustrations Flag with a declining bar chart and down arrows
Free with trial Slovakia flag with a declining bar chart and down arrows, symbolizing decline in data, performance, or various national indicators in the country. Performance decrease illustrations Flag with a declining bar chart and down arrows
Free with trial Suriname flag with a declining bar chart and down arrows, symbolizing decline in data, performance, or various national indicators in the country. Performance decrease illustrations Flag with a declining bar chart and down arrows
Free with trial Spain flag with a declining bar chart and down arrows, symbolizing decline in data, performance, or various national indicators in the country. Performance decrease illustrations Flag with a declining bar chart and down arrows
Free with trial Somalia flag with a declining bar chart and down arrows, symbolizing decline in data, performance, or various national indicators in the country. Performance decrease illustrations Flag with a declining bar chart and down arrows
Free with trial Tanzania flag with a declining bar chart and down arrows, symbolizing decline in data, performance, or various national indicators in the country. Performance decrease illustrations Flag with a declining bar chart and down arrows
Free with trial Serbia flag with a declining bar chart and down arrows, symbolizing decline in data, performance, or various national indicators in the country. Performance decrease illustrations Flag with a declining bar chart and down arrows
Free with trial Rwanda flag with a declining bar chart and down arrows, symbolizing decline in data, performance, or various national indicators in the country. Performance decrease illustrations Flag with a declining bar chart and down arrows
Free with trial Republic of the Congo flag with a declining bar chart and down arrows, symbolizing decline in data, performance, or various national indicators in the country. Performance decrease illustrations Flag with a declining bar chart and down arrows
Free with trial Senegal flag with a declining bar chart and down arrows, symbolizing decline in data, performance, or various national indicators in the country. Performance decrease illustrations Flag with a declining bar chart and down arrows
Free with trial Businessmen hold banknotes, run on stack of money in bar chart. Complete of business competiition, pursuit of economic success, financial management, capital market performance, and profit growth. Performance decrease vectors Businessmen hold banknotes, run on stack of money in bar chart. Complete of business competiition, pursuit of economic success
Free with trial Businessman pointing at a digital interface with interactive graphs representing quality and cost, with arrows indicating trends�quality is increasing while cost is decreasing, illustrating a business performance improvement. Performance decrease illustrations Businessman interacting with digital interface showing quality and cost graphs with arrows pointing up and down. businessman pointing at a digital interface with interactive graphs representing quality and cost, with arrows indicating trends�quality is increasing while cost is decreasing, illustrating a business performance improvement
Free with trial This compelling data visualization showcases a clear downward trend, perfect for illustrating declining performance, market share, or other metrics. The dark background provides a striking contrast to the graph's lines, emphasizing the trend's trajectory. The visual clarity makes it an excellent tool for conveying complex information effectively, whether for internal reports, presentations to. Performance decrease illustrations Visualizing Declining Trends A Dark Night Graph Depicts a Downward Trajectory in Data Ideal for Reports Presentations. This compelling data visualization showcases a clear downward trend, perfect for illustrating declining performance, market share, or other metrics. The dark background provides a striking contrast to the graph's lines, emphasizing the trend's trajectory. The visual clarity makes it an excellent tool for conveying complex information effectively, whether for internal reports, presentations to
Free with trial A businessman holds a coin, runs to stack of money bar chart with green graph up. Extend investment in Bull Economy, economic success, financial management, capital market performance, and profit. Performance decrease vectors A businessman holds a coin, runs to stack of money bar chart with green graph up. Extend investment in Bull Economy, economic
Free with trial A businessman holds banknotes, runs on stack of money in bar chart. Concepts of business development, pursuit of economic success, financial management, capital market performance, and profit growth. Performance decrease vectors A businessman holds banknotes, runs on stack of money in bar chart. Concepts of business development, pursuit of economic success
Free with trial This image shows a bar graph with a downward trending line and a dollar sign. It represents financial loss, economic downturn, or a decrease in market value. Performance decrease vectors Vector art of a bar graph with a downward trending line and a dollar sign, representing financial loss or economic downturn. This image shows a bar graph with a downward trending line and a dollar sign. It represents financial loss, economic downturn, or a decrease in market value
Free with trial Red glowing line graph shows market decline. Bar chart bars decrease, indicating falling sales, revenue loss. Financial report chart displays economic crisis, business downturn tech. Performance decrease illustrations Red glowing line graph shows market decline. Bar chart bars decrease, indicating falling sales, revenue loss. Financial report
Free with trial A businessman holds a coin, runs away from stack of money bar chart with red graph down. Withdraw capital in business recession, economic strategy, financial, market performance, and loss management. Performance decrease vectors A businessman holds a coin, runs away from stack of money bar chart with red graph down. Withdraw capital in business recession
Free with trial A person in a suit presents a bar chart indicating quality increase and cost decrease, illuminated by golden light. Performance decrease illustrations Person in Suit Presenting Bar Chart with Quality Up and Cost Down, Illuminated by Golden Light Modern technology business. A person in a suit presents a bar chart indicating quality increase and cost decrease, illuminated by golden light
Free with trial Graph with arrow down outline icon, symbolizing a downward trend or decrease in data. Perfect for financial reports, stock market analysis, and performance tracking. Performance decrease vectors Professional Graph with Downward Arrow Vector Illustration for Business Presentations. Graph with arrow down outline icon, symbolizing a downward trend or decrease in data. Perfect for financial reports, stock market analysis, and performance tracking.
Free with trial Graph with arrow down outline icon, symbolizing a downward trend or decrease in data. Perfect for financial reports, stock market analysis, and performance tracking. Performance decrease vectors Professional Graph with Downward Arrow Vector Illustration for Business Presentations. Graph with arrow down outline icon, symbolizing a downward trend or decrease in data. Perfect for financial reports, stock market analysis, and performance tracking.
Free with trial Graph with arrow down outline icon, symbolizing a downward trend or decrease in data. Perfect for financial reports, stock market analysis, and performance tracking. Performance decrease vectors Professional Graph with Downward Arrow Vector Illustration for Business Presentations. Graph with arrow down outline icon, symbolizing a downward trend or decrease in data. Perfect for financial reports, stock market analysis, and performance tracking.
Free with trial Graph with arrow down outline icon, symbolizing a downward trend or decrease in data. Perfect for financial reports, stock market analysis, and performance tracking. Performance decrease vectors Professional Graph with Downward Arrow Vector Illustration for Business Presentations. Graph with arrow down outline icon, symbolizing a downward trend or decrease in data. Perfect for financial reports, stock market analysis, and performance tracking.
Free with trial A businessman holds banknotes, runs to stack of money bar chart with green graph up. Extend investment in Bull Economy, economic success, financial management, capital market performance, and profit. Performance decrease vectors A businessman holds banknotes, runs to stack of money bar chart with green graph up. Extend investment in Bull Economy, economic
Free with trial A businessman in a suit holds a bar chart showing quality increasing and cost decreasing, with golden sparkles. Performance decrease illustrations Businessman Holding Upward Trending Bar Chart Showing Quality Increase and Cost Decrease with Golden Sparkles Modern technology. A businessman in a suit holds a bar chart showing quality increasing and cost decreasing, with golden sparkles
Free with trial A businessman holds a coin, runs on stack of money bar chart with green graph up. Extend investment in Bull Economy, economic success, financial management, capital market performance, and profit. Performance decrease vectors A businessman holds a coin, runs on stack of money bar chart with green graph up. Extend investment in Bull Economy, economic
Free with trial A glowing red zigzag arrow points downward, representing a decline on a digital financial chart. The surface is gridded and dark, highlighting the red of the arrow. The arrow has a neon-like appearance and reflects off the glossy surface, signaling a decrease in value. The surrounding chart includes descending graphical elements indicating fluctuating data, conveying a downturn in financial performance or market trends. Performance decrease illustrations A large red arrow points downwards over a gridded financial chart showing a sharp decline in value. A glowing red zigzag arrow points downward, representing a decline on a digital financial chart. The surface is gridded and dark, highlighting the red of the arrow. The arrow has a neon-like appearance and reflects off the glossy surface, signaling a decrease in value. The surrounding chart includes descending graphical elements indicating fluctuating data, conveying a downturn in financial performance or market trends.
Free with trial A glowing red zigzag arrow points downward, representing a decline on a digital financial chart. The surface is gridded and dark, highlighting the red of the arrow. The arrow has a neon-like appearance and reflects off the glossy surface, signaling a decrease in value. The surrounding chart includes descending graphical elements indicating fluctuating data, conveying a downturn in financial performance or market trends. Performance decrease illustrations A large red arrow points downwards over a gridded financial chart showing a sharp decline in value. A glowing red zigzag arrow points downward, representing a decline on a digital financial chart. The surface is gridded and dark, highlighting the red of the arrow. The arrow has a neon-like appearance and reflects off the glossy surface, signaling a decrease in value. The surrounding chart includes descending graphical elements indicating fluctuating data, conveying a downturn in financial performance or market trends.
Free with trial A glowing red zigzag arrow points downward, representing a decline on a digital financial chart. The surface is gridded and dark, highlighting the red of the arrow. The arrow has a neon-like appearance and reflects off the glossy surface, signaling a decrease in value. The surrounding chart includes descending graphical elements indicating fluctuating data, conveying a downturn in financial performance or market trends. Performance decrease illustrations A large red arrow points downwards over a gridded financial chart showing a sharp decline in value. A glowing red zigzag arrow points downward, representing a decline on a digital financial chart. The surface is gridded and dark, highlighting the red of the arrow. The arrow has a neon-like appearance and reflects off the glossy surface, signaling a decrease in value. The surrounding chart includes descending graphical elements indicating fluctuating data, conveying a downturn in financial performance or market trends.
Free with trial A glowing red zigzag arrow points downward, representing a decline on a digital financial chart. The surface is gridded and dark, highlighting the red of the arrow. The arrow has a neon-like appearance and reflects off the glossy surface, signaling a decrease in value. The surrounding chart includes descending graphical elements indicating fluctuating data, conveying a downturn in financial performance or market trends. Performance decrease illustrations A large red arrow points downwards over a gridded financial chart showing a sharp decline in value. A glowing red zigzag arrow points downward, representing a decline on a digital financial chart. The surface is gridded and dark, highlighting the red of the arrow. The arrow has a neon-like appearance and reflects off the glossy surface, signaling a decrease in value. The surrounding chart includes descending graphical elements indicating fluctuating data, conveying a downturn in financial performance or market trends.
Free with trial A glowing red zigzag arrow points downward, representing a decline on a digital financial chart. The surface is gridded and dark, highlighting the red of the arrow. The arrow has a neon-like appearance and reflects off the glossy surface, signaling a decrease in value. The surrounding chart includes descending graphical elements indicating fluctuating data, conveying a downturn in financial performance or market trends. Performance decrease illustrations A large red arrow points downwards over a gridded financial chart showing a sharp decline in value. A glowing red zigzag arrow points downward, representing a decline on a digital financial chart. The surface is gridded and dark, highlighting the red of the arrow. The arrow has a neon-like appearance and reflects off the glossy surface, signaling a decrease in value. The surrounding chart includes descending graphical elements indicating fluctuating data, conveying a downturn in financial performance or market trends.
Free with trial A businessman holds banknotes, runs on stack of money bar chart with green graph up. Extend investment in Bull Economy, economic success, financial management, capital market performance, and profit. Performance decrease vectors A businessman holds banknotes, runs on stack of money bar chart with green graph up. Extend investment in Bull Economy, economic
Free with trial Colorful line graph showing growth and decline of different data from 2018, 2019 and 2020, providing a visual representation of performance trends over time. Performance decrease vectors Colorful line graph showing growth and decline of different data from 2018, 2019 and 2020, providing a visual
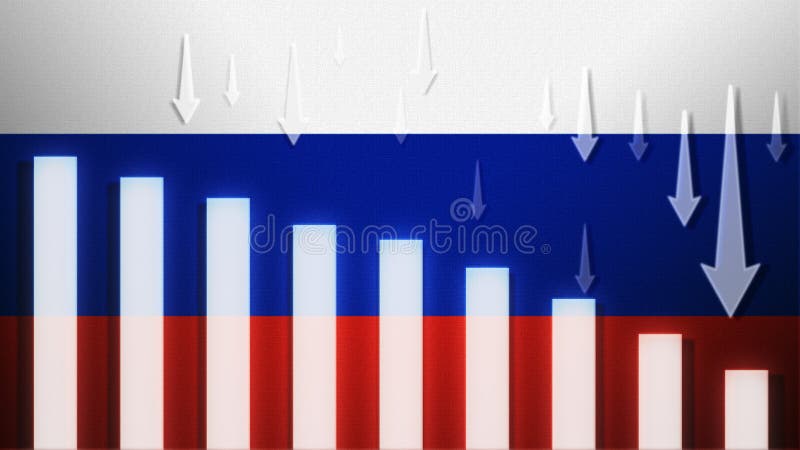
Free with trial Russia flag with a declining bar chart and down arrows, symbolizing decline in data, performance, or various national indicators in the country. Performance decrease illustrations Flag with a declining bar chart and down arrows