Free with trial Fail stamp, aviable in vector format. Photo decrease vectors Fail stamp. Aviable in vector format
Free with trial Abstract statistics blue background frame border. Illustration. Photo decrease illustrations Abstract statistics blue background frame border. Illustration
Free with trial Downward Trend Business Concept Background. Photo decrease illustrations Downward Trend Business Concept Background. Downward Trend Business Concept on White Background
Free with trial Set Global economic crisis, Briefcase, Calculation of expenses and icon. Vector. Photo decrease vectors Set Global economic crisis, Briefcase, Calculation of expenses and icon. Vector.
Free with trial Circle diagram. Business circle diagram. vector image. Photo decrease vectors Circle diagram. Business circle diagram. vector image
Free with trial Uptrend line with arrows with dollar sign in flat icon design on yellow color background. Uptrend line with arrows with dollar sign in flat icon design on yellow. Photo decrease illustrations Uptrend line with arrows with dollar sign in flat icon design on yellow color background. Uptrend line with arrows with dollar sign in flat icon design on yellow
Free with trial Silhouette of a head with stock market decline graph overlay, red and black tones, digital concept of financial crisis. 3D. Silhouette of a head with stock. Photo decrease illustrations Silhouette of a head with stock market decline graph overlay, red and black tones, digital concept of financial crisis. 3D. Silhouette of a head with stock
Free with trial Lao Kip sign icon, outline style. Lao Kip sign icon in outline style isolated on white background. Photo decrease illustrations Lao Kip sign icon, outline style. Lao Kip sign icon in outline style isolated on white background
Free with trial An illustrative, minimalist depicting a business analysis pie chart with segments detaching, accompanied by a downward-pointing arrow, suitable for presentation graphics and financial reports. Photo decrease vectors Pie chart analysis breakdown with downward arrow, isolated business diagram graphic. An illustrative, minimalist depicting a business analysis pie chart with. An illustrative, minimalist depicting a business analysis pie chart with segments detaching, accompanied by a downward-pointing arrow, suitable for presentation graphics and financial reports
Free with trial This image was created using Generative AI. A set of colorful cylindrical columns representing a bar chart with a downward trend. Features yellow, green, brown, blue, and red bars on a white background for data visualization. Photo decrease vectors Colorful Cylindrical Bar Chart Showing Declining Data Trend With Yellow Green Brown Blue And Red Bars. This image was created using Generative AI. A set of. This image was created using Generative AI. A set of colorful cylindrical columns representing a bar chart with a downward trend. Features yellow, green, brown, blue, and red bars on a white background for data visualization
Free with trial Delete, Less, Minus, Remove Grey Logo Design and Business Card Template. Photo decrease vectors Delete, Less, Minus, Remove Grey Logo Design and Business Card Template
Free with trial Expand view line icon. Full screen size Vector symbol illustration. Eps. Photo decrease vectors Expand view line icon. Full screen size Vector symbol illustration. Eps
Free with trial Blue hand-drawn heart on a transparent, white background. The design consists of three nested heart shapes, each outlined with a thick blue line. The hearts decrease in size towards the center, creating a layered effect. The informal style suggests a playful, artistic approach, commonly found in doodles or casual illustrations. The choice of blue color gives a calming appearance, contrasting with traditional red hearts. Photo decrease vectors Doodle hand drawn heart drawing on white background. Blue hand-drawn heart on a transparent, white background. The design consists of three nested heart shapes. Blue hand-drawn heart on a transparent, white background. The design consists of three nested heart shapes, each outlined with a thick blue line. The hearts decrease in size towards the center, creating a layered effect. The informal style suggests a playful, artistic approach, commonly found in doodles or casual illustrations. The choice of blue color gives a calming appearance, contrasting with traditional red hearts.
Free with trial Pencil draws diagram with line going down on checkered paper. Falling graph, business decline concept. Investment risk. Market crash, financial loss. Crisis analysis, business strategy. Photo decrease illustrations Pencil draws diagram with line going down on checkered paper. Falling graph, business decline concept. Investment risk. Market. Crash, financial loss. Crisis. Pencil draws diagram with line going down on checkered paper. Falling graph, business decline concept. Investment risk. Market crash, financial loss. Crisis analysis, business strategy.
Free with trial Money loss chart isolated coins stack with arrow down, thin line icon. Vector financial crisis, arrow pointing down on graph over stack of coins, downtrend line. Budget recession, investment expenses. Photo decrease vectors Coins stack with arrow down, money debt chart icon. Money loss chart isolated coins stack with arrow down, thin line icon. Vector financial crisis, arrow. Money loss chart isolated coins stack with arrow down, thin line icon. Vector financial crisis, arrow pointing down on graph over stack of coins, downtrend line. Budget recession, investment expenses
Free with trial 3d Blue Ruble And Indian Rupee Symbol Icons With 3d Blue Balance Weight Seesaw, 3d illustration. 3d Blue Ruble And Indian Rupee Symbol Icons With 3d Blue Balance. Photo decrease illustrations 3d Blue Ruble And Indian Rupee Symbol Icons With 3d Blue Balance Weight Seesaw, 3d illustration. 3d Blue Ruble And Indian Rupee Symbol Icons With 3d Blue Balance
Free with trial ENCANA ECA stock ticker with decreasing arrow. Editorial crisis related 3D rendering. Stock ticker on the screen. Editorial 3D. Photo decrease illustrations ENCANA ECA stock ticker with decreasing arrow. Editorial crisis related 3D rendering. Stock ticker on the screen. Editorial 3D
Free with trial Exchange graphs indicating growth and a drop in prices and profits. Crypto currency Bitcoin internet virtual money. Vector illustration of bitcoin digital cryptocurrency. Photo decrease vectors Crypto currency Bitcoin. Exchange graphs indicating growth and a drop in prices and profits. Crypto currency Bitcoin internet virtual money. Vector illustration. Exchange graphs indicating growth and a drop in prices and profits. Crypto currency Bitcoin internet virtual money. Vector illustration of bitcoin digital cryptocurrency.
Free with trial Simple chart. On a black background representin increase, success and decrease. Photo decrease illustrations Simple chart. On a black background representin increase, success and decrease
Free with trial CoronaVirus impact on Serbia economy, economy down. Photo decrease illustrations CoronaVirus impact on Serbia economy. Economy down
Free with trial Economy and covid19 statistics with arrows in earth maps. Vector illustration design. Photo decrease vectors Economy and covid19 statistics with arrows in earth maps. Vector illustration design
Free with trial Writing note showing Coupons. Business photo showcasing Certificate Ticket Label for discount gift price Promotion Sale Megaphone loudspeaker yellow stripes important message speech bubble. Photo decrease illustrations Writing note showing Coupons. Business photo showcasing Certificate Ticket Label for discount gift price Promotion Sale. Megaphone loudspeaker yellow stripes. Writing note showing Coupons. Business photo showcasing Certificate Ticket Label for discount gift price Promotion Sale Megaphone loudspeaker yellow stripes important message speech bubble
Free with trial Exploding dollar currency 3D rendering. Exploding dollar currency on grey background 3D rendering. Photo decrease illustrations Exploding dollar currency 3D rendering. Exploding dollar currency on grey background 3D rendering
Free with trial Liberia solar energy power lowering chart, arrow down - alternative energy industrial illustration. 3D Illustration. Photo decrease illustrations Liberia solar energy power lowering chart, arrow down - alternative natural energy industrial illustration. 3D Illustration. Liberia solar energy power lowering. Liberia solar energy power lowering chart, arrow down - alternative energy industrial illustration. 3D Illustration
Free with trial Set Isometric line Global economic crisis, , Mobile stock trading and Shutdown of factory icon. Vector. Photo decrease vectors Set Isometric line Global economic crisis, , Mobile stock trading and Shutdown of factory icon. Vector.
Free with trial Economy Crisis Set. Economy crisis flat icons set with financial charts money symbols and people suffering from economic downturn isolated vector illustration. Photo decrease vectors Economy Crisis Set. Economy crisis flat icons set with financial charts money symbols and people suffering from economic downturn isolated vector illustration
Free with trial To The Top. Vector illustration of people climbing ladder. Photo decrease vectors To The Top. Vector illustration of people climbing ladder
Free with trial Vector showing a hand holding a fuel pump nozzle with oil drop falling into funnel over coins and factory, rising orange arrow graph, world map with trade routes, icons of houses, industry, truck, shopping cart and percentage symbols representing inflation. Concept of global energy crisis, rising gasoline prices, supply chain and economic impact. Ideal for business, finance, news and environmental articles about fuel costs. Photo decrease vectors Global Fuel Price Increase Impacting Economy Illustration. Vector showing a hand holding a fuel pump nozzle with oil drop falling into funnel over coins and. Vector showing a hand holding a fuel pump nozzle with oil drop falling into funnel over coins and factory, rising orange arrow graph, world map with trade routes, icons of houses, industry, truck, shopping cart and percentage symbols representing inflation. Concept of global energy crisis, rising gasoline prices, supply chain and economic impact. Ideal for business, finance, news and environmental articles about fuel costs.
Free with trial Black House Icon with For Sale Sign and Down Arrow Symbol. Photo decrease vectors A stylized black icon representing a house with a sign indicating \'For Sale\' and a downward pointing arrow, symbolizing a price. Black House Icon with For Sale. Black House Icon with For Sale Sign and Down Arrow Symbol
Free with trial Graph going Up and Down sign with green and red arrows vector. Flat design vector illustration concept of sales bar chart symbol icon with arrow moving down and sales bar chart with arrow moving up. Photo decrease vectors Graph going Up and Down sign with green and red arrows vector. Flat design vector illustration concept of sales bar chart symbol. Graph going Up and Down sign. Graph going Up and Down sign with green and red arrows vector. Flat design vector illustration concept of sales bar chart symbol icon with arrow moving down and sales bar chart with arrow moving up.
Free with trial We are up with trade icon Vector. These trade icons pack is intended to make you ready to get your business site, application iconic. These are pertinent to business, official hardware, and trade. Photo decrease vectors We are up with trade icon Vector. These trade icons pack is intended to make you ready to get your business site, application ico. Nic. These are pertinent to. We are up with trade icon Vector. These trade icons pack is intended to make you ready to get your business site, application iconic. These are pertinent to business, official hardware, and trade.
Free with trial Declining bar chart with downward arrow on flip chart. Illustration of a downward trend bar chart on a portable flip chart with a red arrow indicating decline. Photo decrease illustrations Declining bar chart with downward arrow on flip chart. Illustration of a downward trend bar chart on a portable flip chart with a red arrow indicating decline
Free with trial Christmas offer and gift box on red banner with snowflakes. Christmas offer - text and gift box sign on red banner with snowflakes, business holiday concept. Photo decrease illustrations Christmas offer and gift box on red banner with snowflakes. Christmas offer - text and gift box sign on red banner with snowflakes, business holiday concept
Free with trial The flag of Paraguay with declining stock market graph and financial data overlay, symbolizing economic downturn, recession, or bearish market trends. Photo decrease illustrations The flag of Paraguay with declining stock market graph and financial data overlay. Symbolizing economic downturn, recession, or bearish market trends
Free with trial Targeted download, save target, download destination. Pixel perfect, editable stroke vector icon. Photo decrease vectors Targeted download, save target, download destination. Pixel perfect, editable vector icon. Targeted download, save target, download destination. Pixel perfect. Targeted download, save target, download destination. Pixel perfect, editable stroke vector icon
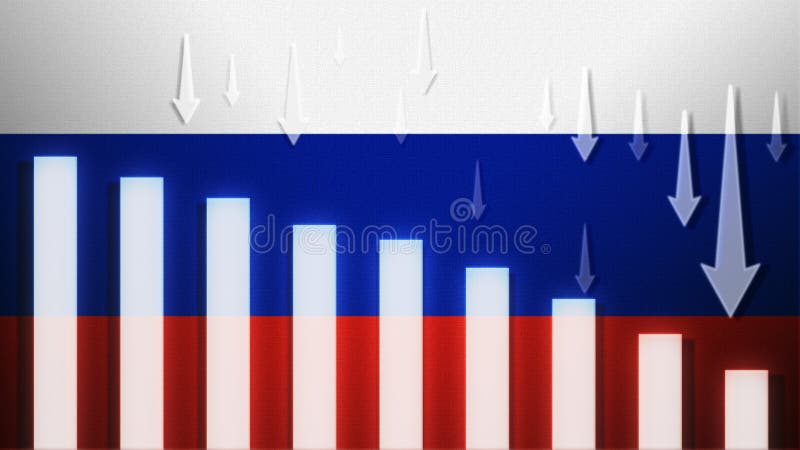
Free with trial Russia flag with a declining bar chart and down arrows, symbolizing decline in data, performance, or various national indicators in the country. Photo decrease illustrations Flag with a declining bar chart and down arrows. Russia flag with a declining bar chart and down arrows, symbolizing decline in data, performance, or various. Russia flag with a declining bar chart and down arrows, symbolizing decline in data, performance, or various national indicators in the country
Free with trial A downward pointing red arrow accompanies a yellow percentage symbol on a clean plain surface. Photo decrease illustrations Red Downward Arrow Symbolizing Decrease with a Golden Percentage Sign. A downward pointing red arrow accompanies a yellow percentage symbol on a clean plain. A downward pointing red arrow accompanies a yellow percentage symbol on a clean plain surface
Free with trial Hand placing a wooden block with a green environmental icon on a stack of similar blocks. Photo decrease illustrations Hand placing a wooden block with a green environmental icon on a stack of similar blocks.
Free with trial Minimalist 3D of pastel geometric shapes symbolizing financial growth, investment, profit, success, and progress. Great for illustrating your unique designs or attracting customer attention. Clear area for showcasing your products, copy space, banner, marketing. This AI image graphic representation. Generative AI. Photo decrease illustrations Pastel Geometric Financial Growth Minimalist Marketing Minimalist 3D of pastel geometric shapes symbolizing financial growth. Minimalist 3D of pastel geometric. Minimalist 3D of pastel geometric shapes symbolizing financial growth, investment, profit, success, and progress. Great for illustrating your unique designs or attracting customer attention. Clear area for showcasing your products, copy space, banner, marketing. This AI image graphic representation. Generative AI
Free with trial Web system, Document and Divider document icons simple set. Graph chart sign. Computer, File with diagram, Report file. Growth report. Science set. Linear web system icon. Colorful design set. Vector. Photo decrease vectors Web system, Document and Divider document icons set. Graph chart sign. Vector. Web system, Document and Divider document icons simple set. Graph chart sign. Web system, Document and Divider document icons simple set. Graph chart sign. Computer, File with diagram, Report file. Growth report. Science set. Linear web system icon. Colorful design set. Vector
Free with trial The pie chart illustrated the percentage of different crops that have been impacted by climate change with some showing a more drastic decrease in yields than others.. Vector illustration. Photo decrease vectors The pie chart illustrated the percentage of different crops that have been impacted by climate change with some showing. A more drastic decrease in yields than. The pie chart illustrated the percentage of different crops that have been impacted by climate change with some showing a more drastic decrease in yields than others.. Vector illustration
Free with trial Set Light bulb, Financial growth decrease, Many ways directional arrow and Layers. Black square button. Vector. Photo decrease vectors Set Light bulb, Financial growth decrease, Many ways directional arrow and Layers. Black square button. Vector.
Free with trial Remove button flat color ui icon. Decrease volume. Collapsible content. Toolbar control. Menu command. Simple filled element for mobile app. Colorful solid pictogram. Vector isolated RGB illustration. Photo decrease vectors Remove button flat color ui icon. Decrease volume. Collapsible content. Toolbar control. Menu command. Simple filled element for mobile app. Colorful solid
Free with trial Goods exports down 3d icon model cartoon style. render illustration. S. Photo decrease illustrations Goods exports down 3d icon model cartoon style. render illustration. S
Free with trial Set line Financial growth decrease Sales funnel with chart Pie infographic and Binary code with long shadow. Red square button. Vector. Photo decrease illustrations Set line Financial growth decrease, Sales funnel with chart, Pie infographic and Binary code with long shadow. Red. Set line Financial growth decrease Sales. Set line Financial growth decrease Sales funnel with chart Pie infographic and Binary code with long shadow. Red square button. Vector.
Free with trial Red real estate drop simple linear icon. concept of appreciation or competition in property and loss. flat minimal stroke trend investment demand or downturn logotype graphic design isolated on white. Photo decrease vectors Red real estate drop simple linear icon. Concept of appreciation or competition in property and loss. flat minimal stroke trend investment demand or downturn
Free with trial Set Global economic crisis, , Dollar rate decrease and Drop in crude oil price icon. Vector. Photo decrease vectors Set Global economic crisis, , Dollar rate decrease and Drop in crude oil price icon. Vector.
Free with trial This dramatic graph illustrates a sharp decline, set against a stormy and ominous background with lightning. It evokes feelings of crisis and economic downturn, perfect for conveying risk and uncertainty in business or finance contexts created AI. Photo decrease illustrations Dramatic graph showing sharp decline with ominous stormy background. This dramatic graph illustrates a sharp decline, set against a stormy and ominous background. This dramatic graph illustrates a sharp decline, set against a stormy and ominous background with lightning. It evokes feelings of crisis and economic downturn, perfect for conveying risk and uncertainty in business or finance contexts created AI
Free with trial Concept of economic collapse. Illustration of an economic collapse concept. Photo decrease illustrations Concept of economic collapse. Illustration of an economic collapse concept
Free with trial Black dollar sign with arrow pointing down icon. A simple black icon featuring a dollar sign with an arrow pointing downwards. Photo decrease illustrations Black dollar sign with arrow pointing down icon. A simple black icon featuring a dollar sign with an arrow pointing downwards
Free with trial Earth Globe with Falling Arrow vector World Financial Crisis concept colored icon. Or logo element. Photo decrease illustrations Earth Globe with Falling Arrow vector World Financial Crisis concept colored icon. Or logo element
Free with trial Coins stack vector illustration. Golden money cash. Wealth finance symbol. Red arrow - income earnings decrease. Photo decrease vectors Coins stack vector illustration. Golden money cash. Wealth finance symbol. Red arrow - income earnings decrease
Free with trial Handwriting text writing Profit Loss. Conceptual photo Financial year end account contains total revenues and expenses. Photo decrease illustrations Handwriting text writing Profit Loss. Concept meaning Financial year end account contains total revenues and expenses. Handwriting text writing Profit Loss. Handwriting text writing Profit Loss. Conceptual photo Financial year end account contains total revenues and expenses
Free with trial Power plant, gas fired power station. Include decreasing chart, graph. Industrial factory may called combined cycle gas turbine plant. Concept for low, loss, drop in electricity energy generation. Photo decrease illustrations Power plant or gas fired power station with concept for low, loss or drop in electricity energy generation. Power plant, gas fired power station. Include. Power plant, gas fired power station. Include decreasing chart, graph. Industrial factory may called combined cycle gas turbine plant. Concept for low, loss, drop in electricity energy generation
Free with trial Pack of 16 creative Flat Color Filled Lines of mix, enhance, tips, designing tool, laptop Editable Creative Vector Design Elements. Photo decrease vectors Modern Set of 16 Flat Color Filled Lines and symbols such as mix, enhance, tips, designing tool, laptop. Pack of 16 creative Flat Color Filled Lines of mix. Pack of 16 creative Flat Color Filled Lines of mix, enhance, tips, designing tool, laptop Editable Creative Vector Design Elements
Free with trial Israel and Morocco painted flags on a wall with a crack. Israel and Morocco relations. Morocco and Israel flags together. Morocco vs Israel. Photo decrease illustrations Israel and Morocco. Painted flags on a wall with a crack. relations. Morocco and Israel flags together. Morocco vs Israel. Israel and Morocco painted flags on a wall with a crack. Israel and Morocco relations. Morocco and Israel flags together. Morocco vs Israel
Free with trial Car Loan Icon for Auto Financing, Vehicle Purchase, and Financial Services Illustrations. Car Loan icon Flat set in black and white color outline vector. Photo decrease vectors Car Loan Icon for Auto Financing, Vehicle Purchase, and Financial Services Illustrations. Car Loan icon Flat set in black and white color outline vector
Free with trial Neutral carbon CO2 stamp. Stiker neutral carbon dioxyde footprint. Photo decrease illustrations Neutral carbon CO2 stamp. Stiker neutral carbon dioxyde footprint.
Free with trial A 3D-rendered illustration that represents the hierarchy of ideas. The composition should feature four yellow light bulbs placed on pedestals of varying heights, arranged in a row. The tallest pedestal should be on the right side, with a white light bulb illuminated at the top, symbolizing the most significant or innovative idea. The other three pedestals should decrease in height progressively,. Photo decrease illustrations A 3D-rendered illustration of light bulbs on pedestals representing hierarchy and progression of innovative ideas. A 3D-rendered illustration that represents the. a 3D-rendered illustration that represents the hierarchy of ideas. The composition should feature four yellow light bulbs placed on pedestals of varying heights, arranged in a row. The tallest pedestal should be on the right side, with a white light bulb illuminated at the top, symbolizing the most significant or innovative idea. The other three pedestals should decrease in height progressively,
Free with trial Neon Icon. Up and Down Euro Sign on white background. Photo decrease vectors Neon Icon. Up and Down Euro Sign on white background. Neon Icon. Up and Down Euro Sign on white background
Free with trial Cloud computing, Loan percent and Safe water line icons set. Document, Mobile survey and Contactless payment signs. Timer, 360 degrees symbols. Computer storage, Decrease rate, Hold drop. Vector. Photo decrease vectors Cloud computing, Loan percent and Safe water icons set. Document, Mobile survey and Contactless payment signs. Vector. Cloud computing, Loan percent and Safe. Cloud computing, Loan percent and Safe water line icons set. Document, Mobile survey and Contactless payment signs. Timer, 360 degrees symbols. Computer storage, Decrease rate, Hold drop. Vector
Free with trial Abstract infographics visualization. Business chart graph with lines of lowering. Corona virus economic impact for business analytics. Graphic concept for your design. Photo decrease vectors Abstract infographics visualization. Business chart graph with lines of lowering. Corona virus economic impact for business analytics. Graphic concept for your
Free with trial This image was created using Generative AI. A flat minimalist icon showing a human hand supporting a dollar coin and a downward arrow, symbolizing price drop, savings, financial reduction, or budget decrease. Photo decrease vectors Hand holding a dollar coin with a downward arrow representing cost reduction icon. This image was created using Generative AI. A flat minimalist icon showing a. This image was created using Generative AI. A flat minimalist icon showing a human hand supporting a dollar coin and a downward arrow, symbolizing price drop, savings, financial reduction, or budget decrease
Free with trial Graph of the real estate market where the arrowhead is falling. recession Home prices fall in real estate and property market crash. 3D render illustration. Photo decrease illustrations Graph of the real estate market where the arrowhead is falling. Recession Home prices fall in real estate and property market crash. 3D render illustration
Free with trial Dollar, bitcoin and economy. Growth and fall of dollar. Set of duotone line icons. Vector file. Photo decrease vectors Business. Balance, growth and fall, analysis. Line icons. Vector file. Dollar, bitcoin and economy. Growth and fall of dollar. Set of duotone line icons. Vector. Dollar, bitcoin and economy. Growth and fall of dollar. Set of duotone line icons. Vector file.
Free with trial Size lock rounded square steel buttons. Size lock engraved icons on rounded square glossy steel buttons. Photo decrease vectors Size lock rounded square steel buttons. Size lock engraved icons on rounded square glossy steel buttons
Free with trial Apixaban molecule. It is pyrazolopyridine, anticoagulant and direct inhibitor of factor Xa which is used to decrease the risk of venous thromboses. Molecular model. 3D rendering. 3D illustration. Photo decrease illustrations Apixaban molecule. It is pyrazolopyridine, anticoagulant and direct inhibitor of factor Xa which is used to decrease the risk of. Venous thromboses. Molecular. Apixaban molecule. It is pyrazolopyridine, anticoagulant and direct inhibitor of factor Xa which is used to decrease the risk of venous thromboses. Molecular model. 3D rendering. 3D illustration
Free with trial Bitcoin growth, increase and down, decrease stock image, digital currency, cryptocurrency money, bitcoin symbol. On white background. Photo decrease illustrations Bitcoin growth, increase and down, decrease stock image, digital currency, cryptocurrency money, bitcoin symbol. On white background
Free with trial Pixel Ethereum coin decreasing in value - high res wallpaper. Photo decrease illustrations Pixel Ethereum coin decreasing in value. High res wallpaper
Free with trial Estonia wind energy power lowering chart, arrow down - green energy industrial illustration. 3D Illustration. Photo decrease illustrations Estonia wind energy power lowering chart, arrow down - alternative natural energy industrial illustration. 3D Illustration. Estonia wind energy power lowering. Estonia wind energy power lowering chart, arrow down - green energy industrial illustration. 3D Illustration
Free with trial Honeymoon travel, Clean bubbles and Candlestick chart minimal line icons. 3d spheres or balls buttons. Correct answer icons. For web, application, printing. Vector. Photo decrease vectors Honeymoon travel, Clean bubbles and Candlestick chart minimal line icons. For web application, printing. Vector. Honeymoon travel, Clean bubbles and Candlestick. Honeymoon travel, Clean bubbles and Candlestick chart minimal line icons. 3d spheres or balls buttons. Correct answer icons. For web, application, printing. Vector
Free with trial Electric power cost home energy bill snow ice winter bulb - ai generated. Photo decrease illustrations Electric power cost home energy bill snow ice winter bulb - ai generated. Electric power cost home energy bill snow ice winter bulb light - ai generated
Free with trial Expand view icon vector for graphic design, logo, website, social media, mobile app, UI. Photo decrease vectors Expand view icon vector for graphic design, logo, website, social media, mobile app, UI.
Free with trial A minimalist illustration of a graph showing a downward trend, accompanied by a cloud and sun, symbolizing economic decline or negative weather patterns. Photo decrease vectors Vector art of a declining graph with a cloud and sun, representing economic downturn and negative trends. A minimalist illustration of a graph showing a downward. A minimalist illustration of a graph showing a downward trend, accompanied by a cloud and sun, symbolizing economic decline or negative weather patterns
Free with trial Linear of paper money banknote with dollar sign and downward arrow indicating depreciation or price reduction. Photo decrease vectors Paper banknote with dollar symbol and down arrow outline for decreasing money value icon. Linear of paper money banknote with dollar sign and downward arrow. Linear of paper money banknote with dollar sign and downward arrow indicating depreciation or price reduction
Free with trial Graph chart, Multichannel and Sharing economy icons simple set. Infographic timeline. Cogwheel sign. Growth report, Multitasking, Share. Idea bulb. Science set. Cycle infographic. Vector. Photo decrease vectors Graph chart, Multichannel and Sharing economy icons set. Cogwheel sign. Growth report, Multitasking, Share. Vector. Graph chart, Multichannel and Sharing economy. Graph chart, Multichannel and Sharing economy icons simple set. Infographic timeline. Cogwheel sign. Growth report, Multitasking, Share. Idea bulb. Science set. Cycle infographic. Vector
Free with trial This sleek, minimalist linear bar graph is perfect for showcasing downward trends in your business data. Ideal for presentations, reports, and dashboards, this editable graphic allows you to easily customize stroke width and colors to match your brand. The clean design and simple layout make complex data easily digestible, highlighting key performance indicators and areas needing attention. Photo decrease illustrations Editable Linear Bar Graph Visualize Downward Trends for Powerful Business Analytics Reports and Presentations. This sleek, minimalist linear bar graph is perfect. This sleek, minimalist linear bar graph is perfect for showcasing downward trends in your business data. Ideal for presentations, reports, and dashboards, this editable graphic allows you to easily customize stroke width and colors to match your brand. The clean design and simple layout make complex data easily digestible, highlighting key performance indicators and areas needing attention.
Free with trial A bold, red arrow with a zig-zag pattern points downwards, symbolizing a decline or negative trend. The arrow is rendered in a 3D style with subtle shading, giving it depth. It is isolated on a transparent background, making it versatile for various design applications. This graphic is ideal for representing financial losses, market downturns, declining performance, or any concept associated with a downward trajectory. Photo decrease illustrations Red Downward Trend Arrow. A bold, red arrow with a zig-zag pattern points downwards, symbolizing a decline or negative trend. The arrow is rendered in a 3D style. A bold, red arrow with a zig-zag pattern points downwards, symbolizing a decline or negative trend. The arrow is rendered in a 3D style with subtle shading, giving it depth. It is isolated on a transparent background, making it versatile for various design applications. This graphic is ideal for representing financial losses, market downturns, declining performance, or any concept associated with a downward trajectory.
Free with trial Discarding Business Growth Concept Icon. A conceptual icon representing the rejection or failure of a business strategy. Photo decrease vectors Discarding Business Growth Concept Icon. A conceptual icon representing the rejection or failure of a business strategy
Free with trial Chef hat, Customer survey, Fast delivery line icons. Bicolor outline web elements. Approved application, Scissors cutting ribbon, Artificial intelligence icons. Vector. Photo decrease illustrations Chef hat, Customer survey, Fast delivery line icons. Approved application, Scissors cutting ribbon. Vector. Chef hat, Customer survey, Fast delivery line icons. Chef hat, Customer survey, Fast delivery line icons. Bicolor outline web elements. Approved application, Scissors cutting ribbon, Artificial intelligence icons. Vector
 Sign in