Free with trial Data analysis graphs with up and down arrow line icons set. Increase and reduction of economy or trend charts, price boost, stock market research thin black and red outline symbols vector illustration. Rate decrease graphic vectors Data analysis graphs with up and down arrow, economy or trend charts line icons set. Data analysis graphs with up and down arrow line icons set. Increase and reduction of economy or trend charts, price boost, stock market research thin black and red outline symbols vector illustration
Free with trial Crowd of flat illustration people forming the percentage symbol on white background. Vector illustration eps. 10. Rate decrease graphic vectors Crowd of flat illustration people forming the percentage symbol on white background. Vector illustration
Free with trial Vector icon down and up arrow cartoon style on white isolated background. Layers grouped for easy editing illustration. For your design. Rate decrease graphic vectors Vector icon down and up arrow cartoon style on white isolated background
Free with trial Up and down percent outline icon vector. Lower and higher arrow sign symbol. Rate decrease graphic vectors Up and down percent outline icon. Lower and higher arrow sign symbol
Free with trial Revenue Decline line icon. Universal creative premium symbol. Vector sign icon logo template. Vector illustration. Rate decrease graphic vectors Revenue Decline line icon. Universal creative premium symbol. Vector sign icon logo template. Vector illustration
Free with trial 3D rendering of a percentage symbol in blue and yellow, featuring rounded edges. Great for sales, discounts, or promotions. Rate decrease graphic vectors Modern percentage symbol in blue and yellow colors on transparent background. 3D rendering of a percentage symbol in blue and yellow, featuring rounded edges. Great for sales, discounts, or promotions.
Free with trial Chart, data, graph, reports, valuation White Glyph Icon colorful Circle Background. Vector EPS10 Abstract Template background. Rate decrease graphic vectors Chart, data, graph, reports, valuation White Glyph Icon colorful Circle Background
Free with trial Dicrease profits line icon, concept illustration, outline symbol, vector sign, linear symbol. Rate decrease graphic vectors Dicrease profits line icon, concept sign, outline vector illustration, linear symbol. Dicrease profits line icon, concept illustration, outline symbol, vector sign, linear symbol.
Free with trial Percent icon or logo isolated sign symbol vector illustration - high quality black style vector icons. Rate decrease graphic vectors Percent icon or logo isolated sign symbol vector illustration
Free with trial Costing icon, thin line isolated illustration, linear vector web design sign, outline concept symbol with editable stroke on white background. Rate decrease graphic illustrations Costing icon, linear isolated illustration, thin line vector, web design sign, outline concept symbol with editable. Costing icon, thin line isolated illustration, linear vector web design sign, outline concept symbol with editable stroke on white background.
Free with trial Increase and reduction of economy or trend charts, price boost, stock market research thin black outline symbols vector illustration. Data analysis graphs with up and down arrow line icons set. Rate decrease graphic vectors Data analysis graphs with up and down arrow, economy or trend charts line icons set. Increase and reduction of economy or trend charts, price boost, stock market research thin black outline symbols vector illustration. Data analysis graphs with up and down arrow line icons set.
Free with trial Currency Crisis icon. Outline sign from economic crisis collection. Line Currency Crisis icon for infographics, wed design and more. Rate decrease graphic vectors Currency Crisis icon. Line element from economic crisis collection. Linear Currency Crisis icon sign for web design. Currency Crisis icon. Outline sign from economic crisis collection. Line Currency Crisis icon for infographics, wed design and more.
Free with trial Employee holding scissors to cut banknotes. Reduction of income due to tax deduction for tiny woman flat vector illustration. Taxation, debt concept for banner, website design or landing web page. Rate decrease graphic vectors Employee holding scissors to cut banknotes. Reduction of income due to tax deduction for tiny woman. Employee holding scissors to cut banknotes. Reduction of income due to tax deduction for tiny woman flat vector illustration. Taxation, debt concept for banner, website design or landing web page
Free with trial Percentage symbol icon in circle shape abstract concept for discount or finance. Rate decrease graphic vectors Percentage symbol icon in circle shape abstract concept for discount or finance
Free with trial Stock diagram trading financial economy crisis bussines. Rate decrease graphic vectors Stock market graph background with coin,graph and digital global map strategy bussines. Stock diagram trading financial economy crisis bussines
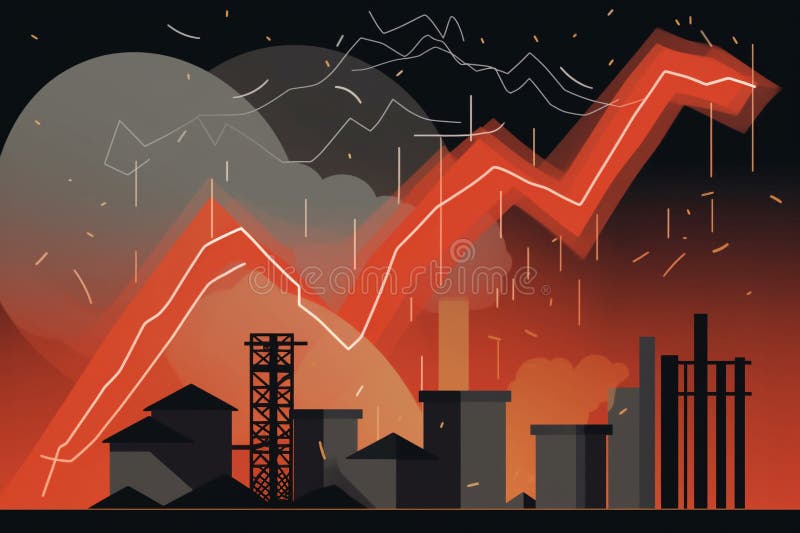
Free with trial Business failure illustration and falling business graph chart concept. generative ai. Rate decrease graphic illustrations Business failure illustration and falling business graph chart concept. generative ai.
Free with trial Business failure illustration and falling business graph chart concept. generative ai. Rate decrease graphic illustrations Business failure illustration and falling business graph chart concept. generative ai.
Free with trial Business failure illustration and falling business graph chart concept. generative ai. Rate decrease graphic illustrations Business failure illustration and falling business graph chart concept. Generative AI
Free with trial Business failure illustration and falling business graph chart concept. generative ai. Rate decrease graphic illustrations Business failure illustration and falling business graph chart concept. Generative AI
Free with trial Business failure illustration and falling business graph chart concept. generative ai. Rate decrease graphic illustrations Business failure illustration and falling business graph chart concept. Generative AI
Free with trial Business failure illustration and falling business graph chart concept. generative ai. Rate decrease graphic illustrations Business failure illustration and falling business graph chart concept. Generative AI
Free with trial Business failure illustration and falling business graph chart concept. generative ai. Rate decrease graphic illustrations Business failure illustration and falling business graph chart concept. Generative AI
Free with trial Business failure illustration and falling business graph chart concept. generative ai. Rate decrease graphic illustrations Business failure illustration and falling business graph chart concept. Generative AI
Free with trial Business failure illustration and falling business graph chart concept. generative ai. Rate decrease graphic illustrations Business failure illustration and falling business graph chart concept. Generative AI
Free with trial Business failure illustration and falling business graph chart concept. generative ai. Rate decrease graphic illustrations Business failure illustration and falling business graph chart concept. Generative AI
Free with trial Business failure illustration and falling business graph chart concept. generative ai. Rate decrease graphic illustrations Business failure illustration and falling business graph chart concept. Generative AI
Free with trial A bank icon on a red-white falling stock graph backgrod. generative ai. Rate decrease graphic illustrations A bank icon on a red-white falling stock graph backgrod. Generative AI
Free with trial A bank icon on a red-white falling stock graph backgrod. generative ai. Rate decrease graphic illustrations A bank icon on a red-white falling stock graph backgrod. Generative AI
Free with trial A bank icon on a red-white falling stock graph backgrod. generative ai. Rate decrease graphic illustrations A bank icon on a red-white falling stock graph backgrod. Generative AI
Free with trial A bank icon on a red-white falling stock graph backgrod. generative ai. Rate decrease graphic illustrations A bank icon on a red-white falling stock graph backgrod. Generative AI
Free with trial A bank icon on a red-white falling stock graph backgrod. generative ai. Rate decrease graphic illustrations A bank icon on a red-white falling stock graph backgrod. Generative AI
Free with trial A bank icon on a red-white falling stock graph backgrod. generative ai. Rate decrease graphic illustrations A bank icon on a red-white falling stock graph backgrod. Generative AI
Free with trial Abstract black downward chart arrow on light sky with clouds and mock up place background. Down, drop, finance and crisis concept. 3D Rendering. Rate decrease graphic illustrations Abstract black downward chart arrow on light sky with clouds and mock up place background. Down, drop, finance and crisis concept
Free with trial Up and Down Dollar Sign on white background. Vector stock illustration. Rate decrease graphic vectors Up and Down Dollar Sign on white background. Vector illustration.
Free with trial Vector illustration of investment management, company is engaged in joint problem solving, sales decline, downward decline with people characters. Rate decrease graphic vectors Vector illustration of investment management, company is engaged in joint problem solving, sales decline, downward decline with
Free with trial Set line Credit card Broken piggy bank Drop in crude oil price Hanging sign with Sale Global economic crisis Safe Prison cell door and Dollar rate decrease icon. Vector. Rate decrease graphic illustrations Set line Credit card, Broken piggy bank, Drop in crude oil price, Hanging sign with Sale, Global economic crisis, Safe. Set line Credit card Broken piggy bank Drop in crude oil price Hanging sign with Sale Global economic crisis Safe Prison cell door and Dollar rate decrease icon. Vector.
Free with trial Dollar price up and down icon. USD coin growth and decline sign symbol vector. Rate decrease graphic vectors Dollar price up and down icon. USD coin growth and decline sign symbol
Free with trial Business failure illustration and falling business graph chart concept. generative ai. Rate decrease graphic illustrations Business failure illustration and falling business graph chart concept. Generative AI
Free with trial Business failure illustration and falling business graph chart concept. generative ai. Rate decrease graphic illustrations Business failure illustration and falling business graph chart concept. Generative AI
Free with trial Business failure illustration and falling business graph chart concept. generative ai. Rate decrease graphic illustrations Business failure illustration and falling business graph chart concept. Generative AI
Free with trial Business failure illustration and falling business graph chart concept. generative ai. Rate decrease graphic illustrations Business failure illustration and falling business graph chart concept. Generative AI
Free with trial Business failure illustration and falling business graph chart concept. generative ai. Rate decrease graphic illustrations Business failure illustration and falling business graph chart concept. Generative AI
Free with trial Business failure illustration and falling business graph chart concept. generative ai. Rate decrease graphic illustrations Business failure illustration and falling business graph chart concept. Generative AI
Free with trial Downward arrows icon. Decreasing trend symbol. Vector arrow group. Economic downturn. EPS 10. Rate decrease graphic vectors Downward arrows icon. Decreasing trend symbol. Vector arrow group. Economic downturn.
Free with trial Vector hand-drawn illustration of dollar symbol with arrow moving down. Black outlines and colored. Rate decrease graphic vectors Vector hand-drawn illustration of dollar with arrow moving down. Vector hand-drawn illustration of dollar symbol with arrow moving down. Black outlines and colored
Free with trial Percent arrow up and down icon vector on black circle. Growth and decline percentage arrows sign symbol. Rate decrease graphic vectors Percent arrow up and down icon on black circle. Growth and decline percentage arrows sign symbol
Free with trial Chart, data, graph, reports, valuation Flat Color Icon Vector. Rate decrease graphic vectors Chart, data, graph, reports, valuation Flat Color Icon Vector
Free with trial Set line Storm Briefcase Global economic crisis Debt ball chained coin news Drop crude oil price Tearing money banknote and Dollar rate decrease icon. Vector. Rate decrease graphic illustrations Set line Storm, Briefcase, Global economic crisis, Debt ball chained coin, news, Drop crude oil price, Tearing money. Set line Storm Briefcase Global economic crisis Debt ball chained coin news Drop crude oil price Tearing money banknote and Dollar rate decrease icon. Vector.
Free with trial Percent presses down arrow, percent drop concept with people character. Outline design style minimal vector illustration for landing page, web banner, infographics, hero images. Rate decrease graphic vectors Percent presses down arrow, percent drop concept with people character. Outline design style minimal vector illustration for
Free with trial Percentage growth and decline icons set. Percent arrow up and down flat and line style symbols collection. Vector illustration. Rate decrease graphic vectors Percentage growth and decline icons set. Percent arrow up and down flat and line style symbols collection
Free with trial Recession graph isometric icon illustration color red, blue, purple. Conceptual business story. Financial crisis, economic recession, bankruptcy, depression. Rate decrease graphic vectors Recession graph isometric icon illustration color red, blue, purple. Conceptual business story. Financial crisis, economic
Free with trial World stock market index fall. Financial crisis. Candlestick chart, line graph and bar chart. Stock market growth illustration. Financial market decrease background. Neon color. Vector illustration. Rate decrease graphic vectors Candlestick chart, line graph and bar chart. World stock market index fall. World stock market index fall. Financial crisis. Candlestick chart, line graph and bar chart. Stock market growth illustration. Financial market decrease background. Neon color. Vector illustration
Free with trial World stock market index fall. Financial crisis. Candlestick chart, line graph and bar chart. Stock market growth illustration. Financial market decrease background. Neon color. Vector illustration. Rate decrease graphic vectors Candlestick chart, line graph and bar chart. World stock market index fall. World stock market index fall. Financial crisis. Candlestick chart, line graph and bar chart. Stock market growth illustration. Financial market decrease background. Neon color. Vector illustration
Free with trial World stock market index fall. Financial crisis. Candlestick chart, line graph and bar chart. Stock market growth illustration. Financial market decrease background. Neon color. Vector illustration. Rate decrease graphic vectors Candlestick chart, line graph and bar chart. World stock market index fall. World stock market index fall. Financial crisis. Candlestick chart, line graph and bar chart. Stock market growth illustration. Financial market decrease background. Neon color. Vector illustration
Free with trial World stock market index fall. Financial crisis. Candlestick chart, line graph and bar chart. Stock market growth illustration. Financial market decrease background. Neon color. Vector illustration. Rate decrease graphic vectors Candlestick chart, line graph and bar chart. World stock market index fall. World stock market index fall. Financial crisis. Candlestick chart, line graph and bar chart. Stock market growth illustration. Financial market decrease background. Neon color. Vector illustration
Free with trial Up and Down Dollar Sign in hands on white background. Vector stock illustration. Rate decrease graphic vectors Up and Down Dollar Sign in hands on white background. Vector stock illustration.
Free with trial Up and Down Dollar Sign in hands on white background. Vector stock illustration. Rate decrease graphic vectors Up and Down Dollar Sign in hands on white background. Vector stock illustration.
Free with trial Up and Down Dollar Sign in hands on white background. Vector stock illustration. Rate decrease graphic vectors Up and Down Dollar Sign in hands on white background. Vector stock illustration.
Free with trial Increase icon. Simple line element success symbol for templates, web design and infographics. Rate decrease graphic vectors Increase icon. Line simple Success icon for templates, web design and infographics. Increase icon. Simple line element success symbol for templates, web design and infographics..
Free with trial Currency Crisis icon. Black sign from economic crisis collection. Creative Currency Crisis icon for web design, templates and infographics. Rate decrease graphic vectors Currency Crisis icon. Monochrome sign from economic crisis collection. Creative Currency Crisis icon illustration for. Currency Crisis icon. Black sign from economic crisis collection. Creative Currency Crisis icon for web design, templates and infographics.
Free with trial Round Button for chart, data, graph, reports, valuation Line icon Turquoise Background. Vector EPS10 Abstract Template background. Rate decrease graphic vectors Round Button for chart, data, graph, reports, valuation Line icon Turquoise Background
Free with trial World stock market index fall. Financial crisis. Candlestick chart, line graph, and bar chart. Stock market growth illustration. Financial market decrease background. neon light. Vector illustration. Rate decrease graphic vectors Candlestick chart, line graph and bar chart. World stock market index fall. World stock market index fall. Financial crisis. Candlestick chart, line graph, and bar chart. Stock market growth illustration. Financial market decrease background. neon light. Vector illustration
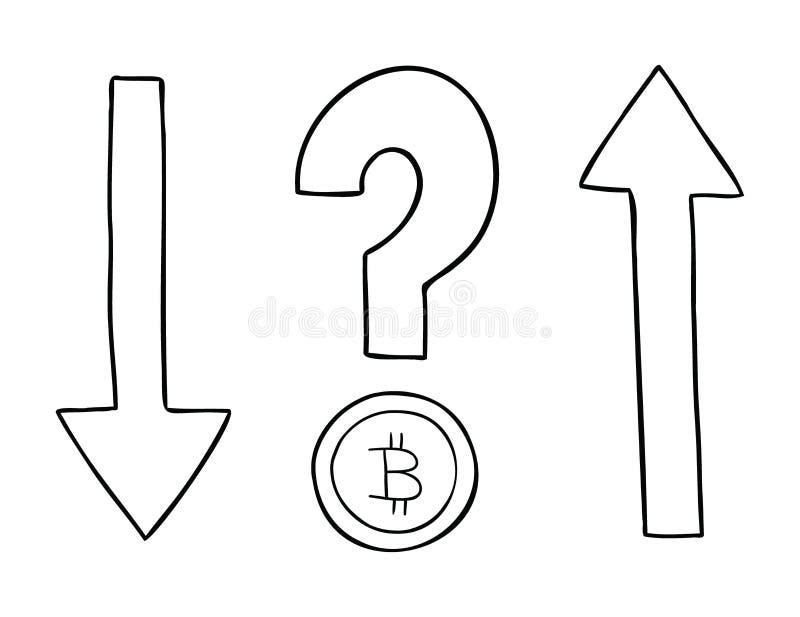
Free with trial Cartoon vector illustration of cryptocurrency bitcoin with question mark and up, down arrows. Black outlined and white colored. Rate decrease graphic vectors Cartoon vector illustration of cryptocurrency bitcoin with question mark and up, down arrows
Free with trial Percent down icon vector set on white background. EPS 10. Rate decrease graphic vectors Percent down icon isolated on white background. Percent down icon vector set on white background. EPS 10
Free with trial Percent down line icon. Discount. isolated on white background. Vector illustration. Rate decrease graphic vectors Percent down line icon. Discount. isolated on white background. Vector illustration
Free with trial Percent arrow up and down icon. Percentage growth and decline sign symbol vector. Rate decrease graphic vectors Percent arrow up and down icon. Percentage growth and decline sign symbol
Free with trial Percent down icon vector set on white background. EPS 10. Rate decrease graphic vectors Percent down icon isolated on white background. Percent down icon vector set on white background. EPS 10
Free with trial Percent down line icon. Discount. isolated on white background. Vector illustration. Rate decrease graphic vectors Percent down line icon. Discount. isolated on white background. Vector illustration
Free with trial A red triangle with the words 'INFLATION ALERT' in white, surrounded by scattered green banknotes and gold coins on a white background, symbolizing economic concerns. Rate decrease graphic illustrations Illustration of inflation alert with money and coins isolated on white background. A red triangle with the words 'INFLATION ALERT' in white, surrounded by scattered green banknotes and gold coins on a white background, symbolizing economic concerns.
Free with trial Three distinct 3D icons are presented on a white background. In the center is a yellow coin with a white dollar sign. To the top right is a green circular icon with a white upward-pointing arrow. To the bottom left is a red circular icon with a white downward-pointing arrow. These symbols represent financial concepts like profit, loss, and currency. Rate decrease graphic illustrations 3D icons of a dollar coin, an up arrow, and a down arrow on a white background money currency. Three distinct 3D icons are presented on a white background. In. Three distinct 3D icons are presented on a white background. In the center is a yellow coin with a white dollar sign. To the top right is a green circular icon with a white upward-pointing arrow. To the bottom left is a red circular icon with a white downward-pointing arrow. These symbols represent financial concepts like profit, loss, and currency
Free with trial A 3D rendered gray percentage symbol is presented against a clean white background. The symbol is composed of two circles and a diagonal line, with subtle shading that gives it a three-dimensional appearance. The lighting highlights the smooth surfaces of the symbol. Rate decrease graphic illustrations 3D Rendered Gray Percentage Symbol on White Background sign discount. A 3D rendered gray percentage symbol is presented against a clean white background. The symbol is composed of two circles and a diagonal line, with subtle shading that gives it a three-dimensional appearance. The lighting highlights the smooth surfaces of the symbol
Free with trial Up and down percent arrow outline icon vector. Lower and higher price sign symbol. Rate decrease graphic vectors Up and down percent arrow outline icon. Lower and higher price sign symbol
Free with trial Chart, data, graph, reports, valuation Line Icon. Vector EPS10 Abstract Template background. Rate decrease graphic vectors Chart, data, graph, reports, valuation Line Icon
Free with trial Percentage growth and decline icons set. Percent arrow up and down flat and line style symbols collection. Vector illustration. Rate decrease graphic illustrations Percentage growth and decline icons set. Percent arrow up and down flat and line style symbols collection
Free with trial Percent arrow up and down outline icon vector. Percentage growth and decline arrows sign symbol. Rate decrease graphic vectors Percent arrow up and down outline icon. Percentage growth and decline arrows sign symbol
Free with trial Arrow percent icon on black circle. Up and down percentage sign symbol vector. Rate decrease graphic vectors Arrow percent icon on black circle. Up and down percentage sign symbol
Free with trial Loss, fall arrow economic symbol, income flat modern icon, isolated on white background. Rate decrease graphic vectors Loss, fall arrow economic symbol, income flat modern icon, isolated on white background
Free with trial Loss, fall arrow economic symbol, income flat modern icon, isolated on white background. Rate decrease graphic vectors Loss, fall arrow economic symbol, income flat modern icon, isolated on white background
Free with trial A glossy, rounded, 3D rendered percentage symbol, featuring yellow elements on a lilac square background, isolated on a transparent backdrop. Rate decrease graphic vectors Bright Yellow Percentage Sign with Purple Rounded Square on transparent background. A glossy, rounded, 3D rendered percentage symbol, featuring yellow elements on a lilac square background, isolated on a transparent backdrop.
Free with trial Chart, data, graph, reports, valuation Glyph Icon.. Vector EPS10 Abstract Template background. Rate decrease graphic vectors Chart, data, graph, reports, valuation Glyph Icon