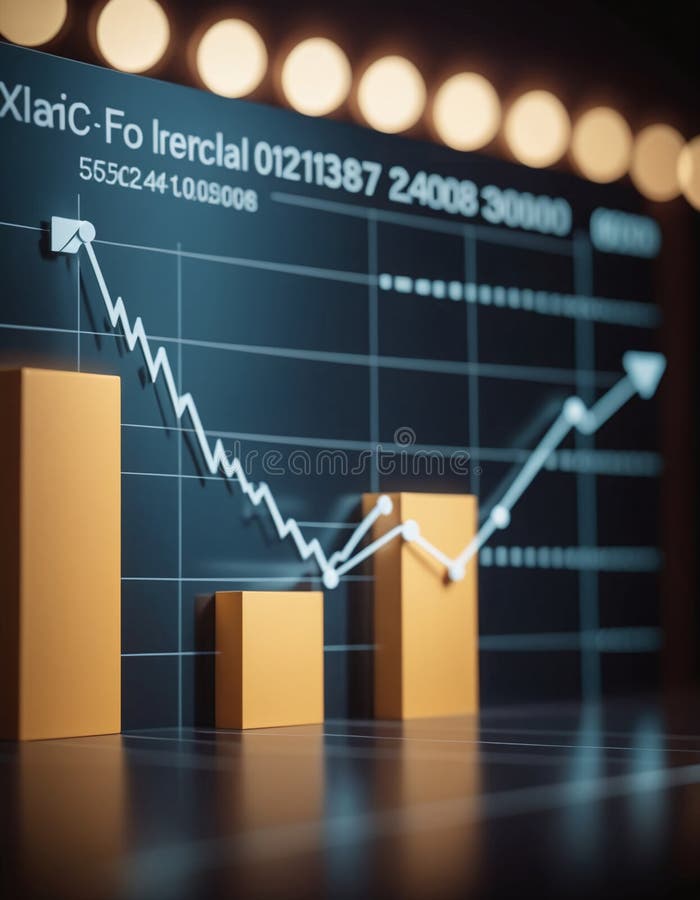
Free with trial Graph or block diagram shows the increase or decrease of shares, which means financial loss or gain -. Rating decrease illustrations Graph or block diagram shows the increase or decrease of shares, which means financial loss or gain
Free with trial A row of wooden blocks with different emotions, presenting sticky note word text phrase "CREDIT SCORE" level of bad fair, good and excellent. Rating decrease illustrations Wooden blocks with different emotions, presenting sticky note word text phrase \'CREDIT SCORE\'. A row of wooden blocks with different emotions, presenting sticky note word text phrase "CREDIT SCORE" level of bad fair, good and excellent
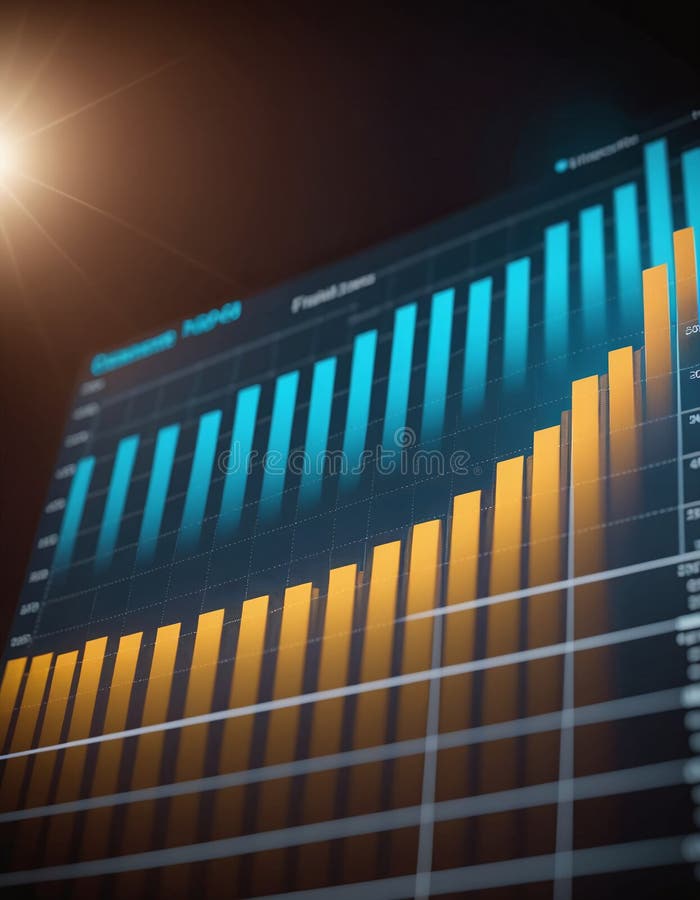
Free with trial Graph or block diagram shows the increase or decrease of shares, which means financial loss or gain -. Rating decrease illustrations Graph or block diagram shows the increase or decrease of shares, which means financial loss or gain
Free with trial Graph or block diagram shows the increase or decrease of shares, which means financial loss or gain -. Rating decrease illustrations Graph or block diagram shows the increase or decrease of shares, which means financial loss or gain
Free with trial Graph or block diagram shows the increase or decrease of shares, which means financial loss or gain -. Rating decrease illustrations Graph or block diagram shows the increase or decrease of shares, which means financial loss or gain
Free with trial Graph or block diagram shows the increase or decrease of shares, which means financial loss or gain -. Rating decrease illustrations Graph or block diagram shows the increase or decrease of shares, which means financial loss or gain
Free with trial Graph or block diagram shows the increase or decrease of shares, which means financial loss or gain -. Rating decrease illustrations Graph or block diagram shows the increase or decrease of shares, which means financial loss or gain
Free with trial Graph or block diagram shows the increase or decrease of shares, which means financial loss or gain -. Rating decrease illustrations Graph or block diagram shows the increase or decrease of shares, which means financial loss or gain
Free with trial Graph or block diagram shows the increase or decrease of shares, which means financial loss or gain -. Rating decrease illustrations Graph or block diagram shows the increase or decrease of shares, which means financial loss or gain
Free with trial Graph or block diagram shows the increase or decrease of shares, which means financial loss or gain -. Rating decrease illustrations Graph or block diagram shows the increase or decrease of shares, which means financial loss or gain
Free with trial Graph or block diagram shows the increase or decrease of shares, which means financial loss or gain -. Rating decrease illustrations Graph or block diagram shows the increase or decrease of shares, which means financial loss or gain
Free with trial Graph or block diagram shows the increase or decrease of shares, which means financial loss or gain -. Rating decrease illustrations Graph or block diagram shows the increase or decrease of shares, which means financial loss or gain
Free with trial Graph or block diagram shows the increase or decrease of shares, which means financial loss or gain -. Rating decrease illustrations Graph or block diagram shows the increase or decrease of shares, which means financial loss or gain
Free with trial Graph or block diagram shows the increase or decrease of shares, which means financial loss or gain -. Rating decrease illustrations Graph or block diagram shows the increase or decrease of shares, which means financial loss or gain
Free with trial Graph or block diagram shows the increase or decrease of shares, which means financial loss or gain -. Rating decrease illustrations Graph or block diagram shows the increase or decrease of shares, which means financial loss or gain
Free with trial Graph or block diagram shows the increase or decrease of shares, which means financial loss or gain -. Rating decrease illustrations Graph or block diagram shows the increase or decrease of shares, which means financial loss or gain
Free with trial Graph or block diagram shows the increase or decrease of shares, which means financial loss or gain -. Rating decrease illustrations Graph or block diagram shows the increase or decrease of shares, which means financial loss or gain
Free with trial Graph or block diagram shows the increase or decrease of shares, which means financial loss or gain -. Rating decrease illustrations Graph or block diagram shows the increase or decrease of shares, which means financial loss or gain
Free with trial Graph or block diagram shows the increase or decrease of shares, which means financial loss or gain -. Rating decrease illustrations Graph or block diagram shows the increase or decrease of shares, which means financial loss or gain
Free with trial Graph or block diagram shows the increase or decrease of shares, which means financial loss or gain -. Rating decrease illustrations Graph or block diagram shows the increase or decrease of shares, which means financial loss or gain
Free with trial Graph or block diagram shows the increase or decrease of shares, which means financial loss or gain -. Rating decrease illustrations Graph or block diagram shows the increase or decrease of shares, which means financial loss or gain
Free with trial Graph or block diagram shows the increase or decrease of shares, which means financial loss or gain -. Rating decrease illustrations Graph or block diagram shows the increase or decrease of shares, which means financial loss or gain
Free with trial Graph or block diagram shows the increase or decrease of shares, which means financial loss or gain -. Rating decrease illustrations Graph or block diagram shows the increase or decrease of shares, which means financial loss or gain
Free with trial Graph or block diagram shows the increase or decrease of shares, which means financial loss or gain -. Rating decrease illustrations Graph or block diagram shows the increase or decrease of shares, which means financial loss or gain
Free with trial Graph or block diagram shows the increase or decrease of shares, which means financial loss or gain -. Rating decrease illustrations Graph or block diagram shows the increase or decrease of shares, which means financial loss or gain
Free with trial Graph or block diagram shows the increase or decrease of shares, which means financial loss or gain -. Rating decrease illustrations Graph or block diagram shows the increase or decrease of shares, which means financial loss or gain
Free with trial Graph or block diagram shows the increase or decrease of shares, which means financial loss or gain -. Rating decrease illustrations Graph or block diagram shows the increase or decrease of shares, which means financial loss or gain
Free with trial Graph or block diagram shows the increase or decrease of shares, which means financial loss or gain -. Rating decrease illustrations Graph or block diagram shows the increase or decrease of shares, which means financial loss or gain
Free with trial Graph or block diagram shows the increase or decrease of shares, which means financial loss or gain -. Rating decrease illustrations Graph or block diagram shows the increase or decrease of shares, which means financial loss or gain
Free with trial Graph or block diagram shows the increase or decrease of shares, which means financial loss or gain -. Rating decrease illustrations Graph or block diagram shows the increase or decrease of shares, which means financial loss or gain
Free with trial Graph or block diagram shows the increase or decrease of shares, which means financial loss or gain -. Rating decrease illustrations Graph or block diagram shows the increase or decrease of shares, which means financial loss or gain
Free with trial Graph or block diagram shows the increase or decrease of shares, which means financial loss or gain -. Rating decrease illustrations Graph or block diagram shows the increase or decrease of shares, which means financial loss or gain
Free with trial Graph or block diagram shows the increase or decrease of shares, which means financial loss or gain -. Rating decrease illustrations Graph or block diagram shows the increase or decrease of shares, which means financial loss or gain
Free with trial Graph or block diagram shows the increase or decrease of shares, which means financial loss or gain -. Rating decrease illustrations Graph or block diagram shows the increase or decrease of shares, which means financial loss or gain
Free with trial Graph or block diagram shows the increase or decrease of shares, which means financial loss or gain -. Rating decrease illustrations Graph or block diagram shows the increase or decrease of shares, which means financial loss or gain
Free with trial Graph or block diagram shows the increase or decrease of shares, which means financial loss or gain -. Rating decrease illustrations Graph or block diagram shows the increase or decrease of shares, which means financial loss or gain
Free with trial Graph or block diagram shows the increase or decrease of shares, which means financial loss or gain -. Rating decrease illustrations Graph or block diagram shows the increase or decrease of shares, which means financial loss or gain
Free with trial Graph or block diagram shows the increase or decrease of shares, which means financial loss or gain -. Rating decrease illustrations Graph or block diagram shows the increase or decrease of shares, which means financial loss or gain
Free with trial Graph or block diagram shows the increase or decrease of shares, which means financial loss or gain -. Rating decrease illustrations Graph or block diagram shows the increase or decrease of shares, which means financial loss or gain
Free with trial Graph or block diagram shows the increase or decrease of shares, which means financial loss or gain -. Rating decrease illustrations Graph or block diagram shows the increase or decrease of shares, which means financial loss or gain
Free with trial 3d rendering of emojis with different mood placed on a blue and red graph showing decrease in customer satisfaction. Rating decrease illustrations Customer satisfaction decreasing showing by emojis on graph going downward. 3d rendering of emojis with different mood placed on a blue and red graph showing decrease in customer satisfaction
Free with trial Globe outline with five stars arranged in an arc and a black downward arrow with a cloud above. Ideal for global ranking, review system, feedback, decision-making, quality metrics, trend analysis. Rating decrease vectors Global rating concept with stars, globe, and downward arrow indicating feedback or ranking shift. Globe outline with five stars arranged in an arc and a black downward arrow with a cloud above. Ideal for global ranking, review system, feedback, decision-making, quality metrics, trend analysis
Free with trial A 3D rendered illustration featuring a bright blue arrow pointing upwards and a vibrant red arrow pointing downwards, positioned side-by-side on a plain white background. The arrows are smooth and rounded, symbolizing concepts of increase and decrease, or positive and negative movement. Rating decrease illustrations 3D Rendered Blue Up Arrow and Red Down Arrow on White Background direction movement. A 3D rendered illustration featuring a bright blue arrow pointing upwards and a vibrant red arrow pointing downwards, positioned side-by-side on a plain white background. The arrows are smooth and rounded, symbolizing concepts of increase and decrease, or positive and negative movement
Free with trial Graph or block diagram shows the increase or decrease of shares, which means financial loss or gain -. Rating decrease illustrations Graph or block diagram shows the increase or decrease of shares, which means financial loss or gain
Free with trial Rate traffic sign on blue sky background. Rating decrease illustrations Rate traffic sign on blue sky
Free with trial Man and woman marketing analysts stand near graph analyzing number of clicks from contextual advertising. Two analysts are working on launching promotion to attract visitors to website. Rating decrease vectors Man and woman marketing analysts stand near graph analyzing number of clicks from contextual ads. Man and woman marketing analysts stand near graph analyzing number of clicks from contextual advertising. Two analysts are working on launching promotion to attract visitors to website.
Free with trial Minimalist illustration of a red textured sad face, one yellow star, and pink minus signs on a light blue background, conceptualizing bad reviews, low ratings, or disappointment. Rating decrease illustrations Minimalist illustration of a red textured sad face, one yellow star, and pink minus signs on a light blue background
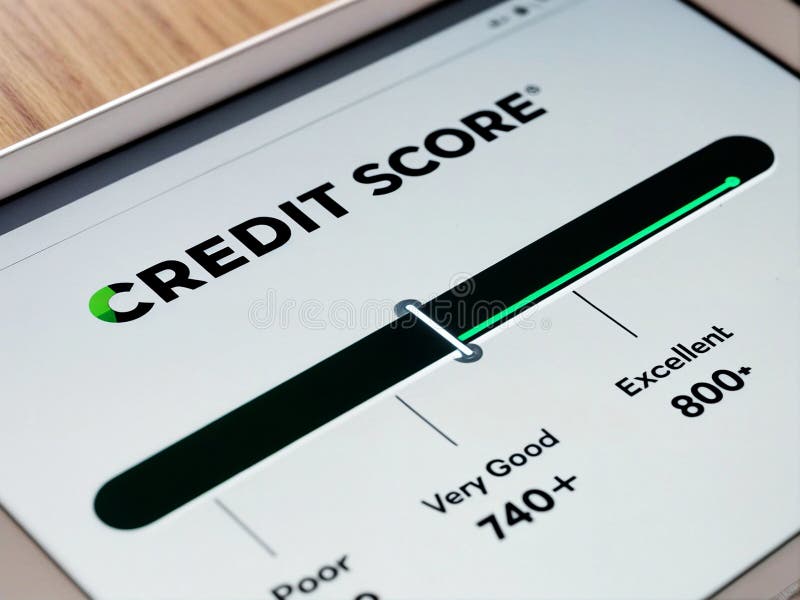
Free with trial A credit score indicator on a tablet screen with a digital representation of a credit score with a scale from 0 to 900. Rating decrease illustrations A credit score indicator on a tablet screen of a credit score. A credit score indicator on a tablet screen with a digital representation of a credit score with a scale from 0 to 900
Free with trial A row of wooden blocks with different emotions, presenting sticky note word text phrase "CREDIT SCORE" level of bad fair, good and excellent. Rating decrease illustrations Wooden blocks with sticky note word text phrase \'CREDIT SCORE\'. A row of wooden blocks with different emotions, presenting sticky note word text phrase "CREDIT SCORE" level of bad fair, good and excellent
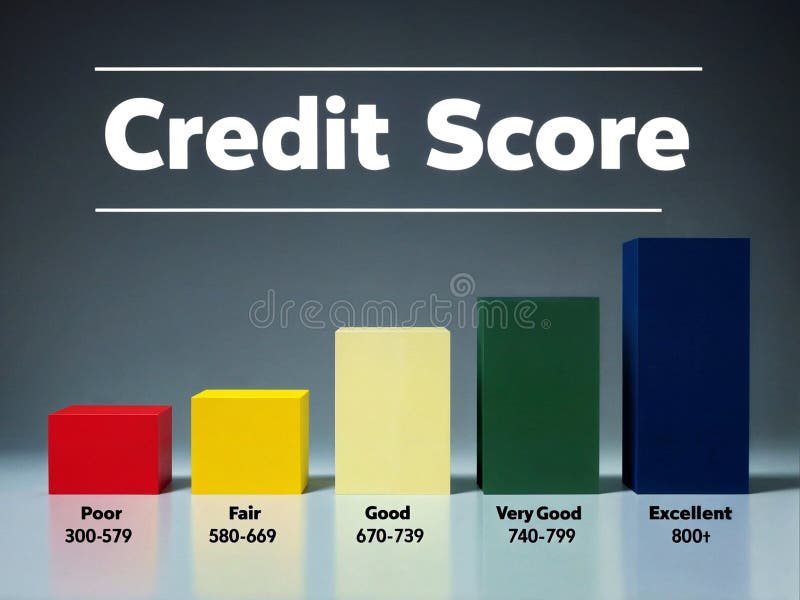
Free with trial 3d render illustration of increasing progress bar of indicating poor, fair, good, very good and excellent level of creditworthiness. Rating decrease illustrations 3d illustration render progress bars indicating credit score level. 3d render illustration of increasing progress bar of indicating poor, fair, good, very good and excellent level of creditworthiness
Free with trial A 3D render of the number "90" followed by a percent sign, all in a glossy white finish. The numbers are large and bold, casting subtle shadows. They are positioned on the right side of a vibrant yellow background, leaving ample copy space on the left. Rating decrease illustrations White 3D Ninety Percent Number and Percent Sign on Yellow Background percentage. A 3D render of the number "90" followed by a percent sign, all in a glossy white finish. The numbers are large and bold, casting subtle shadows. They are positioned on the right side of a vibrant yellow background, leaving ample copy space on the left
Free with trial A simple and bold icon illustration of a bar graph. This can be used to represent data, statistics, growth, or trends. The icon is designed in a clean and minimalist style, making it versatile for various applications. Rating decrease vectors Simple Bold Bar Graph Sign Shape Icon for Data Presentation. A simple and bold icon illustration of a bar graph. This can be used to represent data, statistics, growth, or trends. The icon is designed in a clean and minimalist style, making it versatile for various applications.
Free with trial A row of wooden blocks with different emotions, presenting sticky note word text phrase "CREDIT SCORE" level of bad fair, good and excellent. Rating decrease illustrations A row of wooden blocks with different emotions, presenting sticky note word text phrase \'CREDIT SCORE\'. A row of wooden blocks with different emotions, presenting sticky note word text phrase "CREDIT SCORE" level of bad fair, good and excellent
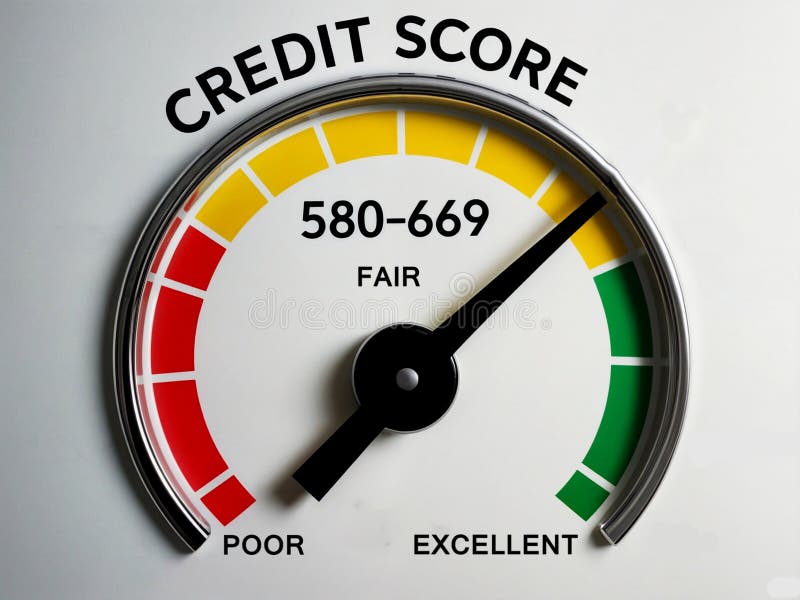
Free with trial 3d render illustration of a credit Score gauge meter within fair range 580 to 669. Rating decrease illustrations Credit Score gauge meter within fair range 580 to 669
Free with trial Line art depicting a magnifying glass focused on a declining sales graph and a thumbs-down gesture. Rating decrease illustrations Declining Sales Analysis Magnifying Glass, Downward Trend, Thumbs Down. Line art depicting a magnifying glass focused on a declining sales graph and a thumbs-down gesture.
Free with trial Black and white clipboard icon featuring a checklist. The design includes an "X" and three dots in a vertical line, symbolizing tasks or points, followed by a downward-curving arrow. The arrow suggests a downward trend or progression. The icon is simple, with thick lines, and is typically used to represent concepts in planning, business analysis, or project management. The background is plain, emphasizing the clipboard graphic. Rating decrease vectors Clipboard checklist with downward trend. Black and white clipboard icon featuring a checklist. The design includes an "X" and three dots in a vertical line, symbolizing tasks or points, followed by a downward-curving arrow. The arrow suggests a downward trend or progression. The icon is simple, with thick lines, and is typically used to represent concepts in planning, business analysis, or project management. The background is plain, emphasizing the clipboard graphic.
Free with trial Businesswoman pulls meter with rope to reduce risk or stress level. Describes reducing the risk level, reducing the anxiety meter and lowering the danger indicator. Business, work and career concept. Rating decrease vectors Businesswoman pulls meter with rope to reduce risk or stress level
Free with trial A conceptual image featuring wooden blocks spelling the word "TRUST" alongside a stacked block showing a downward trend graph and a sad face emoji. This composition symbolizes the loss of consumer confidence, economic recession, reputation damage, and the negative impact of poor service or financial decline in a professional business environment. Rating decrease illustrations Declining Trust and Business Failure Concept with Wooden Blocks and Sad Face Icon. A conceptual image featuring wooden blocks spelling the word "TRUST" alongside a stacked block showing a downward trend graph and a sad face emoji. This composition symbolizes the loss of consumer confidence, economic recession, reputation damage, and the negative impact of poor service or financial decline in a professional business environment.
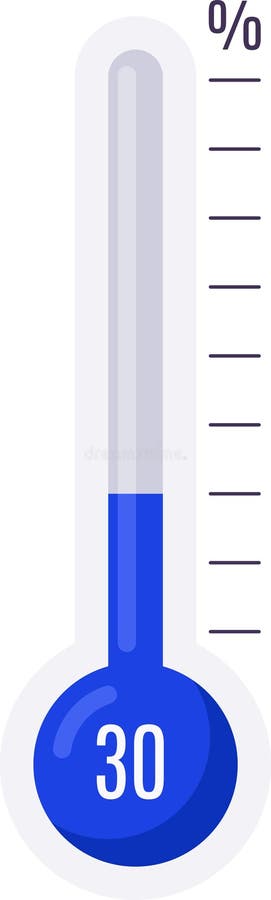
Free with trial Thermometer indicating 30 percent, symbolizing progress, achievement, temperature measurement, or goal completion within a specific range. Rating decrease vectors Thermometer indicating 30 percent, symbolizing progress, achievement, temperature measurement, or goal completion within
Free with trial A sharp, transparent glass arrow pointing downwards, surrounded by glistening water droplets, signifying a downward trend or decline in a conceptual manner. Rating decrease illustrations Transparent arrow pointing downwards, isolated on white background background copy space. A sharp, transparent glass arrow pointing downwards, surrounded by glistening water droplets, signifying a downward trend or decline in a conceptual manner.
Free with trial A glossy green plus icon and a glossy red minus icon appear in minimal 3D style on a white background, communicating addition and subtraction, gain and loss, or simple add remove actions in digital products,. Rating decrease illustrations Glossy 3D plus and minus symbols in green and red on white background for modern interface design, AI generated. A glossy green plus icon and a glossy red minus icon appear in minimal 3D style on a white background, communicating addition and subtraction, gain and loss, or simple add remove actions in digital products,
Free with trial A minimalist, black and white vector icon representing a bar chart or graph. The icon features a series of vertical bars of varying heights, set against a base of horizontal lines. This clean and modern design is ideal for representing data, statistics, progress, growth, or financial information in digital and print media. Its simple aesthetic makes it versatile for use in presentations, websites, apps, and infographics. Rating decrease vectors Abstract Bar Chart Icon. A minimalist, black and white vector icon representing a bar chart or graph. The icon features a series of vertical bars of varying heights, set against a base of horizontal lines. This clean and modern design is ideal for representing data, statistics, progress, growth, or financial information in digital and print media. Its simple aesthetic makes it versatile for use in presentations, websites, apps, and infographics.
Free with trial Minimalistic 3D icons show a glossy green plus and a glossy red minus isolated on a white background, suitable for UI design, finance changes, ratings, add remove actions, and clean modern visuals,. Rating decrease illustrations Minimalistic 3D glossy green plus and red minus icons isolated on white background clean aesthetic, AI generated. Minimalistic 3D icons show a glossy green plus and a glossy red minus isolated on a white background, suitable for UI design, finance changes, ratings, add remove actions, and clean modern visuals,
Free with trial Near a graph that symbolizes the rising and falling trends in logistics, a female courier is illustrated, and her. Rating decrease illustrations Near a graph that symbolizes the rising and falling trends in logistics, a female courier is illustrated, and her
Free with trial Chart declining business icon with down arrow, bar graph, broken gear and lightning bolt, thumbs down symbol for recession, failure, crisis, loss and risk. Rating decrease vectors Chart declining business icon with down arrow, bar graph, broken gear and lightning bolt, thumbs
Free with trial A female courier is depicted near a rising and falling graph, symbolizing the fluctuating trends in the logistics. Rating decrease illustrations A female courier is depicted near a rising and falling graph, symbolizing the fluctuating trends in the logistics
Free with trial Hand is pointing towards a descending bar chart with bars in shades of red, orange, and yellow on a white background. Rating decrease illustrations The hand points to the bar chart showing a downtrend. Hand is pointing towards a descending bar chart with bars in shades of red, orange, and yellow on a white. hand is pointing towards a descending bar chart with bars in shades of red, orange, and yellow on a white background.