Free with trial The "Vector Dollar Down Icon Symbol" is a graphical representation designed to indicate a decrease or downward trend related to financial aspects, specifically involving currency or value. Reduction arrow decrease vectors Vector Dollar Down Icon Symbol
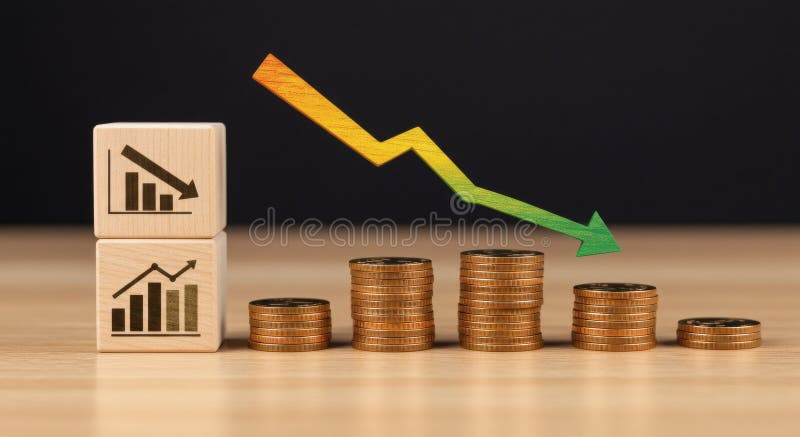
Free with trial Two coins, one red and one green, each with a dollar sign and a downward arrow, symbolizing financial loss, economic decline, and negative market trends. Reduction arrow decrease vectors Vector art of two coins with dollar signs and downward arrows indicating financial loss isolated on white background. Two coins, one red and one green, each with a dollar sign and a downward arrow, symbolizing financial loss, economic decline, and negative market trends
Free with trial Financial market crash and economic decline downward arrows on digital blue dashboard with global statistics investment loss stock price reduction in global trade. Reduction arrow decrease vectors Financial market crash and economic decline downward arrows on digital blue dashboard with global statistics investment loss stock
Free with trial Solar panel on a stand, footprint with CO2 text, thermometer with downward arrow, and heart. Ideal for sustainability, eco-energy, carbon reduction, clean power, green living climate change simple. Reduction arrow decrease illustrations Solar Panel for Green Energy with Reduced Carbon Footprint and Sustainability Icons. Solar panel on a stand, footprint with CO2 text, thermometer with downward arrow, and heart. Ideal for sustainability, eco-energy, carbon reduction, clean power, green living climate change simple
Free with trial Increase Decrease Temperature Icon. Thermometer with plus minus symbol high low increasing decreasing up down scale to measure set or adjust climate. Reduction arrow decrease vectors Increase Decrease Temperature Icon. Thermometer with plus minus symbol high low increasing decreasing up down scale to measure
Free with trial This striking image depicts a downward-pointing arrow composed of fragmented red and white blocks, generated by AI. The red blocks represent a decline, while the white blocks symbolize a potential recovery or past stability. The visual metaphor powerfully conveys market instability and potential col. Reduction arrow decrease illustrations Market Crash Visualization. This striking image depicts a downward-pointing arrow composed of fragmented red and white blocks, generated by AI. The red blocks represent a decline, while the white blocks symbolize a potential recovery or past stability. The visual metaphor powerfully conveys market instability and potential col
Free with trial CO2 cloud with downward arrows, small graph showing fluctuation and falling coins. Ideal for climate change, sustainability, economy, environment, cost, finance emissions. Simple flat metaphor. Reduction arrow decrease vectors Carbon Emissions Reduction and Economic Impact Illustrated with Graph and Coin Elements. CO2 cloud with downward arrows, small graph showing fluctuation and falling coins. Ideal for climate change, sustainability, economy, environment, cost, finance emissions. Simple flat metaphor
Free with trial Two red, downward trending arrow graphs illustrate a significant market decline, representing financial loss or economic downturn. The jagged lines show fluctuating decline. Reduction arrow decrease vectors Red Downward Trending Arrows Indicating Market Decline, Financial Loss. Two red, downward trending arrow graphs illustrate a significant market decline, representing financial loss or economic downturn. The jagged lines show fluctuating decline
Free with trial 3D low price icons with red up and down arrows showing rate drop and market decline. Abstract financial vector about price decrease, percent change, and economic fall in modern business design. Reduction arrow decrease vectors 3D low price icons with red up and down arrows showing rate drop and market decline. Abstract financial vector about
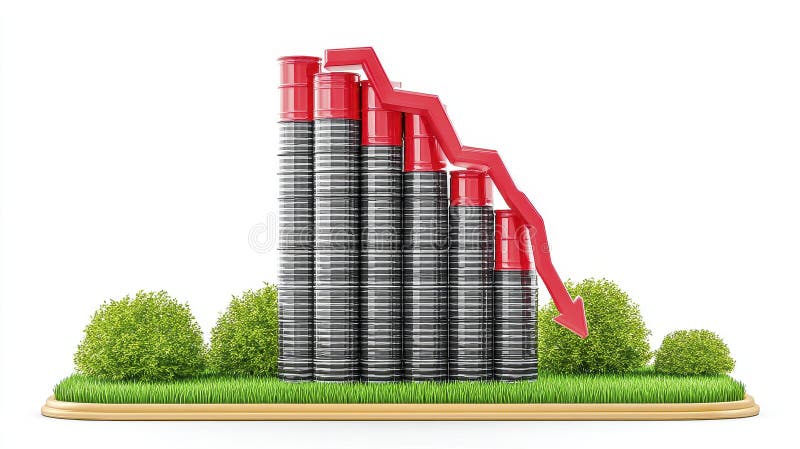
Free with trial 3D rendering of a bar graph showing a decline in production, represented by black and red cylinders on a grassy surface. The downward trend is emphasized by a red arrow AI generative. Reduction arrow decrease illustrations Declining Production 3D Render of Bar Graph Showing a Downward Trend. 3D rendering of a bar graph showing a decline in production, represented by black and red cylinders on a grassy surface. The downward trend is emphasized by a red arrow AI generative
Free with trial A crisp vector illustration of an orange downward trending line graph, signifying a fall, loss, or negative economic movement. This versatile icon is perfect for financial dashboards, business analysis, or reporting on declining statistics. Its clear visual representation quickly conveys a reduction in values, making it highly effective, vector design Generative AI. Reduction arrow decrease vectors Orange Downward Trending Financial Graph, vector design Generative AI. A crisp vector illustration of an orange downward trending line graph, signifying a fall, loss, or negative economic movement. This versatile icon is perfect for financial dashboards, business analysis, or reporting on declining statistics. Its clear visual representation quickly conveys a reduction in values, making it highly effective, vector design Generative AI
Free with trial A man in a dark suit and tie holds out his hands, with glowing white graphics showing an upward arrow and the word QUALITY above a percentage sign, and a downward arrow and the word COST above his other hand. A laptop is visible on the left. Created Ai. Reduction arrow decrease illustrations Businessman presenting quality increase and cost decrease suit hands. A man in a dark suit and tie holds out his hands, with glowing white graphics showing an upward arrow and the word QUALITY above a percentage sign, and a downward arrow and the word COST above his other hand. A laptop is visible on the left. Created Ai
Free with trial Circular arrows and down arrow with percent symbol indicating discount. Reduction arrow decrease vectors Circular arrows and down arrow with percent symbol indicating discount
Free with trial Illustrating market decline and data analysis with modern visual elements. Reduction arrow decrease vectors Red arrow downtrend graph and bar chart in digital and tech theme. Illustrating market decline and data analysis with modern visual elements.
Free with trial Illustrating market decline and data analysis with modern visual elements. Reduction arrow decrease vectors Red arrow downtrend graph and bar chart in digital and tech theme. Illustrating market decline and data analysis with modern visual elements.
Free with trial Discover a diverse collection of flat illustration concept vectors, perfect for enhancing your design projects. Explore creativity with our unique visuals. Reduction arrow decrease vectors Cost reduction concept costs cut costs optimization business Flat vector concept illustration. Discover a diverse collection of flat illustration concept vectors, perfect for enhancing your design projects. Explore creativity with our unique visuals
Free with trial CO2 inside cloud shape with blue downward arrows indicating reduction, next to bar chart and small cloud. Ideal for sustainability, environment, data, carbon reduction, climate change, eco-friendly. Reduction arrow decrease vectors Reducing Carbon Emissions with Data Analysis Highlighted by Cloud Imagery and Downward Arrows. CO2 inside cloud shape with blue downward arrows indicating reduction, next to bar chart and small cloud. Ideal for sustainability, environment, data, carbon reduction, climate change, eco-friendly
Free with trial A conceptual vector icon representing a downturn in the housing market. The downward arrow inside the house symbolizes falling prices, property value depreciation, or a real estate crisis. Reduction arrow decrease vectors Real Estate Market Decline Vector Icon. A conceptual vector icon representing a downturn in the housing market. The downward arrow inside the house symbolizes falling prices, property value depreciation, or a real estate crisis
Free with trial Three shiny golden dollar coins are depicted with three prominent red arrows pointing downwards, visually representing financial decline, economic loss, or a decrease in value. Reduction arrow decrease illustrations Three golden dollar coins with downward red arrows, isolated on white background. Three shiny golden dollar coins are depicted with three prominent red arrows pointing downwards, visually representing financial decline, economic loss, or a decrease in value
Free with trial Descending Bar Chart and Downward Arrow Signifying Business Loss and Economic Downturn. Reduction arrow decrease vectors Descending Bar Chart and Downward Arrow Signifying Business Loss and Economic Downturn
Free with trial Financial taxation system graphic showing tax increase and decrease options with percentage coin element for economic policy planning and analysis. Reduction arrow decrease illustrations Tax management concept icon with percentage symbol and directional green arrows on blue background. Financial taxation system graphic showing tax increase and decrease options with percentage coin element for economic policy planning and analysis
Free with trial A finger holds a white sign representing a decrease in CO2 emissions, symbolized by a downward-trending arrow, against a light blue background, indicating environmental awareness. Reduction arrow decrease illustrations Symbol of decreasing CO2 emissions shows commitment to a healthier, greener environment. A finger holds a white sign representing a decrease in CO2 emissions, symbolized by a downward-trending arrow, against a light blue background, indicating environmental awareness
Free with trial Two flat design icons, one red and one blue, showcasing a dollar sign within a circle with an arrow pointing downwards, signifying a decrease in value. Reduction arrow decrease vectors Dollar Down Symbol Round Icons Displaying in Red and Blue with Long Shadow. Decreasing Dollar Value. Two flat design icons, one red and one blue, showcasing a dollar sign within a circle with an arrow pointing downwards, signifying a decrease in value.
Free with trial Coins down or money dropping with Business decline downward arrow trend isolated object on white background with Clipping path, The concept of the trend of financial bankruptcy, 3D rendering. Reduction arrow decrease illustrations The concept of the trend of financial bankruptcy with Coins down or money dropping on isolated object on white background. Coins down or money dropping with Business decline downward arrow trend isolated object on white background with Clipping path, The concept of the trend of financial bankruptcy, 3D rendering
Free with trial Two flat design icons depicting the Indian Rupee (? ) symbol in a circular frame with a downward arrow, signifying a declining value. Reduction arrow decrease vectors Indian Rupee Symbol Round Icons Displaying in Red and Blue with Long Shadow. Decreasing Rupee Value. Two flat design icons depicting the Indian Rupee (?) symbol in a circular frame with a downward arrow, signifying a declining value.
Free with trial Image depicts falling market values using coins and a downward arrow. It symbolizes economic downturn and financial instability. Reduction arrow decrease illustrations Economic Downturn: Visual Representation of Decreasing Market Value and Financial Instability. Image depicts falling market values using coins and a downward arrow. It symbolizes economic downturn and financial instability
Free with trial Composite collage image of arrow point down trader entrepreneur company employee crisis inflation concept bizarre unusual fantasy billboard. Reduction arrow decrease illustrations Composite collage image of arrow point down trader entrepreneur company employee crisis inflation concept bizarre
Free with trial This illustrates the volatility of the precious metal, the decline in the Iranian and Omani gold markets, and the economic impact on investors during times of crisis or financial instability. Reduction arrow decrease illustrations Gold bars and a downward-pointing red arrow on the flags of Iran and Oman. This illustrates the volatility of the precious metal, the decline in the Iranian and Omani gold markets, and the economic impact on investors during times of crisis or financial instability.
Free with trial This illustrates the volatility of the precious metal, the decline in the Iranian and Egyptian gold markets, and the economic impact on investors during times of crisis or financial instability. Reduction arrow decrease illustrations Gold bars and a downward-pointing red arrow on the flags of Iran and Egypt. This illustrates the volatility of the precious metal, the decline in the Iranian and Egyptian gold markets, and the economic impact on investors during times of crisis or financial instability.
Free with trial This illustrates the volatility of the precious metal, the decline in the Iranian and Syrian gold markets, and the economic impact on investors during times of crisis or financial instability. Reduction arrow decrease illustrations Gold bars and a downward-pointing red arrow on the flags of Iran and Syria. This illustrates the volatility of the precious metal, the decline in the Iranian and Syrian gold markets, and the economic impact on investors during times of crisis or financial instability.
Free with trial This illustrates the volatility of the precious metal, the decline in the Iranian and Qatari gold markets, and the economic impact on investors during times of crisis or financial instability. Reduction arrow decrease illustrations Gold bars and a downward-pointing red arrow on the flags of Iran and Qatar. This illustrates the volatility of the precious metal, the decline in the Iranian and Qatari gold markets, and the economic impact on investors during times of crisis or financial instability.
Free with trial This illustrates the volatility of the precious metal, the decline in the Iranian and Yemeni gold markets, and the economic impact on investors during times of crisis or financial instability. Reduction arrow decrease illustrations Gold bars and a downward-pointing red arrow on the flags of Iran and Yemen. This illustrates the volatility of the precious metal, the decline in the Iranian and Yemeni gold markets, and the economic impact on investors during times of crisis or financial instability.
Free with trial This illustrates the volatility of the precious metal, the decline in the Iranian and Israeli gold markets, and the economic impact on investors during times of crisis or financial instability. Reduction arrow decrease illustrations Gold bars and a downward-pointing red arrow on the flags of Iran and Israel. This illustrates the volatility of the precious metal, the decline in the Iranian and Israeli gold markets, and the economic impact on investors during times of crisis or financial instability.
Free with trial This illustrates the volatility of the precious metal, the decline in the Iranian and Kuwaiti gold markets, and the economic impact on investors during times of crisis or financial instability. Reduction arrow decrease illustrations Gold bars and a downward-pointing red arrow on the flags of Iran and Kuwait. This illustrates the volatility of the precious metal, the decline in the Iranian and Kuwaiti gold markets, and the economic impact on investors during times of crisis or financial instability.
Free with trial This illustrates the volatility of the precious metal, the decline in the Iranian and Turkish gold markets, and the economic impact on investors during times of crisis or financial instability. Reduction arrow decrease illustrations Gold bars and a downward-pointing red arrow on the flags of Iran and Turkey. This illustrates the volatility of the precious metal, the decline in the Iranian and Turkish gold markets, and the economic impact on investors during times of crisis or financial instability.
Free with trial This illustrates the volatility of the precious metal, the decline in the Iranian and Jordanian gold markets, and the economic impact on investors during times of crisis or financial instability. Reduction arrow decrease illustrations Gold bars and a downward-pointing red arrow on the flags of Iran and Jordan. This illustrates the volatility of the precious metal, the decline in the Iranian and Jordanian gold markets, and the economic impact on investors during times of crisis or financial instability.
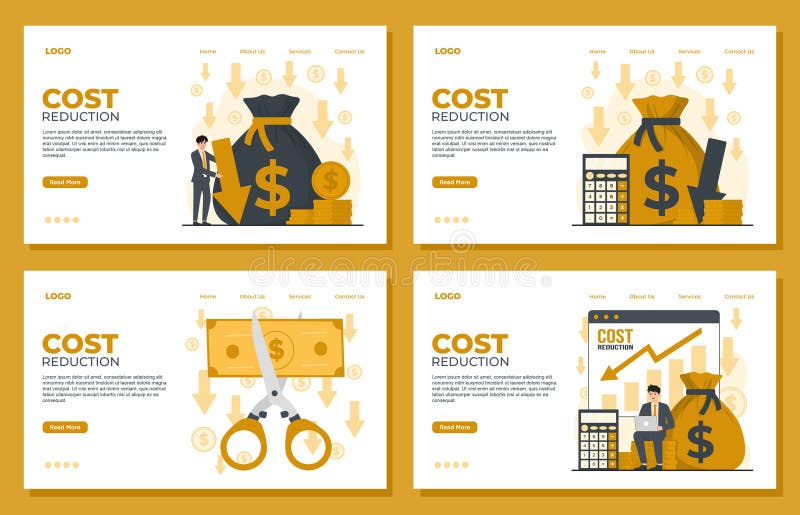
Free with trial Discover a diverse collection of flat illustration concept vectors, perfect for enhancing your design projects. Explore creativity with our unique visuals. Reduction arrow decrease vectors Cost reduction landing page template Flat vector illustration web page design costs cut, costs optimization concept. Discover a diverse collection of flat illustration concept vectors, perfect for enhancing your design projects. Explore creativity with our unique visuals
Free with trial This illustrates the volatility of the precious metal, the decline in the Iranian and Lebanese gold markets, and the economic impact on investors during times of crisis or financial instability. Reduction arrow decrease illustrations Gold bars and a downward-pointing red arrow on the flags of Iran and Lebanon. This illustrates the volatility of the precious metal, the decline in the Iranian and Lebanese gold markets, and the economic impact on investors during times of crisis or financial instability.
Free with trial This illustrates the volatility of the precious metal, the decline in the Iranian and Bahraini gold markets, and the economic impact on investors during times of crisis or financial instability. Reduction arrow decrease illustrations Gold bars and a downward-pointing red arrow on the flags of Iran and Bahrain. This illustrates the volatility of the precious metal, the decline in the Iranian and Bahraini gold markets, and the economic impact on investors during times of crisis or financial instability.
Free with trial This illustrates the volatility of the precious metal, the decline in the Iranian and Palestinian gold markets, and the economic impact on investors during times of crisis or financial instability. Reduction arrow decrease illustrations Gold bars and a downward-pointing red arrow on the flags of Iran and Palestine. This illustrates the volatility of the precious metal, the decline in the Iranian and Palestinian gold markets, and the economic impact on investors during times of crisis or financial instability.
Free with trial 3D Percentage commission icon. Decrease in interest rate, brokerage, low price, reduce cost, sale percent tax. Trendy and modern vector in 3d style. Reduction arrow decrease vectors 3D Percentage commission icon. Decrease in interest rate, brokerage, low price, reduce cost, sale percent tax
Free with trial This illustrates the volatility of the precious metal, the decline in the Iranian and Emirati gold markets, and the economic impact on investors during times of crisis or financial instability. Reduction arrow decrease illustrations Gold bars and a downward-pointing red arrow on the flags of Iran and the United Arab Emirates. This illustrates the volatility of the precious metal, the decline in the Iranian and Emirati gold markets, and the economic impact on investors during times of crisis or financial instability.
Free with trial Trend design 3D photo collage of two huge hand hold piece coin young man fall down inflation investor business budget reduction economy. Reduction arrow decrease illustrations Trend design 3D photo collage of two huge hand hold piece coin young man fall down inflation investor business budget
Free with trial Trend artwork composite sketch image 3D photo collage of young man trader keep balance on huge arrow grow earn bitcoin lose crisis. Reduction arrow decrease illustrations Trend artwork composite sketch image 3D photo collage of young man trader keep balance on huge arrow grow earn bitcoin
Free with trial This dynamic 3D visualization showcases a dramatic downward trend, depicted by numerous red arrows pointing downwards. The graphic effectively illustrates a decline in various economic indicators, such as stock market performance, negative growth, and business loss. The intense red color strongly emphasizes the negative impact, suggesting a potential stock market crash, a significant economic. Reduction arrow decrease illustrations 3D Rendered Red Arrow Graph Visualizing a Downward Trend in Financial Markets and Business Performance. This dynamic 3D visualization showcases a dramatic downward trend, depicted by numerous red arrows pointing downwards. The graphic effectively illustrates a decline in various economic indicators, such as stock market performance, negative growth, and business loss. The intense red color strongly emphasizes the negative impact, suggesting a potential stock market crash, a significant economic
Free with trial Creative collage young woman trader economy recession crisis bankruptcy golden coin dollar failure investing loss stocks downfall decrease. Reduction arrow decrease illustrations Creative collage young woman trader economy recession crisis bankruptcy golden coin dollar failure investing loss stocks
Free with trial Visualizing cost reduction strategies in business, a hand places an arrow indicating decreasing costs on a graph, highlighting financial management and efficiency. 200 chars. Reduction arrow decrease illustrations Reduce costs strategy business finance management budget planning investment savings efficiency 100 chars. visualizing cost reduction strategies in business, a hand places an arrow indicating decreasing costs on a graph, highlighting financial management and efficiency. 200 chars
Free with trial Financial downturn concept. Three stacks of gold coins illustrating decreasing wealth with red arrow pointing downwards symbolizing crisis and falling profits. Economic decline and budget reduction. Reduction arrow decrease illustrations Three stacks of gold coins with red arrow pointing downwards depicting financial decline and economic crisis. Financial downturn concept. Three stacks of gold coins illustrating decreasing wealth with red arrow pointing downwards symbolizing crisis and falling profits. Economic decline and budget reduction
Free with trial Businessman holding dollar coin. A businesswoman sits on coins while holding a laptop, calculating declining office finances. Cost Reduction concept. trend modern vector flat illustration. Reduction arrow decrease vectors Businessman holding dollar coin. A businesswoman sits on coins while holding a laptop, calculating declining office finances.
Free with trial Businessman analyzes office management. The performance concept improves quality, speed, and efficiency and reduces costs. Cost Reduction concept. trend modern vector flat illustration. Reduction arrow decrease vectors Businessman analyzes office management. The performance concept improves quality, speed, and efficiency and reduces costs.
Free with trial Digital tablet icon displaying a bar chart with a downward trend arrow and percentage sign, indicating decline or loss. Reduction arrow decrease vectors Digital tablet icon displaying a bar chart with a downward trend arrow and percentage sign, indicating decline or loss
Free with trial Cardboard shipping boxes with red downward arrow. Falling sales, declining demand or reduced delivery volumes. 3D rendering isolated on white background. Reduction arrow decrease illustrations Cardboard shipping boxes with red downward arrow. Falling sales, declining demand or reduced delivery volumes. 3D rendering
Free with trial Climate goal cube, CO2 emissions, sustainable future, strategy. created ai. Reduction arrow decrease illustrations Climate Goal Cube: CO2 Emission Reduction Strategy - Target for Sustainable Future with Decreasing Graph on Wooden Blocks for. Climate goal cube, CO2 emissions, sustainable future, strategy. created ai
Free with trial CO2 emissions icon vector logo set collection for web app ui. Reduction arrow decrease vectors CO2 emissions reduction to save environment from global warming icon. pollution of carbon dioxide emission or greenhouse gas in. CO2 emissions icon vector logo set collection for web app ui
Free with trial Three red arrows pointing down with white percentage symbols signifying a drop in prices or economic decline isolated on transparent background. Reduction arrow decrease vectors Three red downward pointing arrows with percentage symbols indicating a decrease in value or sales isolated on transparent. Three red arrows pointing down with white percentage symbols signifying a drop in prices or economic decline isolated on transparent background
Free with trial This image features red and green arrows pointing downwards, symbolizing a decline or negative trend in markets, finance, or business. It represents loss and reduction. Reduction arrow decrease vectors Vector art of a visual representation of downward trends with red and green arrows indicating decline isolated on white background. This image features red and green arrows pointing downwards, symbolizing a decline or negative trend in markets, finance, or business. It represents loss and reduction
Free with trial Gold bar on white background. Isolated 3D illustration. Reduction arrow decrease illustrations Gold bar on white background. Isolated 3D illustration
Free with trial Discount program. Consumer benefit, offers and sales, individual customer discounts, interest rate changes and money management, coins percent sign, vector cartoon flat style isolated finance concept. Reduction arrow decrease vectors Discount program. Consumer benefit, offers and sales, individual customer discounts, interest rate changes and money management
Free with trial Black steel oil drum on white background. Isolated 3D illustration. Reduction arrow decrease illustrations Black steel oil drum on white background. Isolated 3D illustration
Free with trial Black steel oil drum and gold coins on white background. Isolated 3D illustration. Reduction arrow decrease illustrations Black steel oil drum and gold coins on white background. Isolated 3D illustration
Free with trial Two drop and growth technology icon with gear. outline simple trend stats logotype graphic stroke art web design isolated on white. concept of key performance indicator or operation strategy symbol. Reduction arrow decrease vectors Two drop and growth technology icon with gear
Free with trial Outline down chart icon isolated. Flat style design vector illustration on white background. Reduction arrow decrease vectors Outline down chart icon isolated. Flat style design vector illustration on white background
Free with trial Decline graph line outline icon isolated on white. Vector illustration. Reduction arrow decrease vectors Decline graph line outline icon
Free with trial 3D Isometric Flat Vector Illustration of Increase Interest Rates, Percent Up. Reduction arrow decrease vectors 3D Isometric Flat Vector Illustration of Increase Interest Rates
Free with trial Price Drop Icon. A flat illustration featuring a gold dollar coin with three red arrows pointing down. Reduction arrow decrease vectors Price Drop Icon
Free with trial Downward Bar Graph Line Icon, Decline or Loss Vector. Reduction arrow decrease vectors Downward Bar Graph Line Icon
Free with trial Cartoon Color Economic Decline Chart Crisis Concept Flat Design Style and Line Elements. Vector illustration of Financial Failure. Reduction arrow decrease vectors Cartoon Color Economic Decline Chart Crisis Concept. Vector. Cartoon Color Economic Decline Chart Crisis Concept Flat Design Style and Line Elements. Vector illustration of Financial Failure
Free with trial Illustration of a business activities. Reduction arrow decrease vectors Illustration of a business activities
Free with trial Illustration of a business activities. Reduction arrow decrease vectors Illustration of a business activities
Free with trial Downward arrows representing decline, calculator symbolizing calculations, and percentage sign for financial analysis. Ideal for business, finance, data analysis, interest rate, savings, growth. Reduction arrow decrease vectors Decreasing Trends with Financial Calculation and Percentage Concept. Downward arrows representing decline, calculator symbolizing calculations, and percentage sign for financial analysis. Ideal for business, finance, data analysis, interest rate, savings, growth
Free with trial This minimalist illustration depicts a downward trending graph superimposed with two stylized power pylons. A vibrant green leaf is positioned near the end of the graph, symbolizing the shift towards renewable or sustainable energy sources. The composition suggests a decline in traditional energy infrastructure or consumption, with an implied transition to eco-friendly alternatives. Ideal for concepts related to energy policy, environmental impact, economic shifts in the power sector, and the future of electricity. Reduction arrow decrease vectors Green Energy Transition and Power Grid Decline Graph. This minimalist illustration depicts a downward trending graph superimposed with two stylized power pylons. A vibrant green leaf is positioned near the end of the graph, symbolizing the shift towards renewable or sustainable energy sources. The composition suggests a decline in traditional energy infrastructure or consumption, with an implied transition to eco-friendly alternatives. Ideal for concepts related to energy policy, environmental impact, economic shifts in the power sector, and the future of electricity.
Free with trial Web Browser sale graph down Tool flat icon design isolated on a white background. Reduction arrow decrease vectors Web Browser sale graph down Tool flat icon design
Free with trial Interest rate falling down, businessman on percentage sign with falling down. Reduction arrow decrease vectors Interest rate falling down, businessman on percentage sign with falling down
Free with trial Real Estate concept visualizing decreasing house mortgage rates and property prices. This 3D render features a glowing house outline, red percentage arrows, with ample dark copy space. Perfect for financial articles, real estate websites, business presentations, or property marketing. Reduction arrow decrease illustrations Real Estate Mortgage Rates Falling House Prices Decline Financial Concept. Real Estate concept visualizing decreasing house mortgage rates and property prices. This 3D render features a glowing house outline, red percentage arrows, with ample dark copy space. Perfect for financial articles, real estate websites, business presentations, or property marketing.
Free with trial Financial Loss Report Document Icon Set with Downward Trend vol 11427. Reduction arrow decrease vectors Financial Loss Report Document Icon Set with Downward Trend
Free with trial Bar chart with descending bars, coin falling, minimal cloud above. Ideal for finance, economy, loss, risk, business investments or savings themes. Simple flat metaphor. Reduction arrow decrease vectors Decreasing Bar Chart with Dropping Coin Symbolizing Financial Decline and Economic Challenges. Bar chart with descending bars, coin falling, minimal cloud above. Ideal for finance, economy, loss, risk, business investments or savings themes. Simple flat metaphor
Free with trial Reduce cost Icon isolated on background vector illustration. Reduction arrow decrease vectors Reduce cost Icon isolated on background
Free with trial A symbolic illustration representing a downturn in the housing market. Reduction arrow decrease vectors Real Estate Market Decline Vector Concept. A symbolic illustration representing a downturn in the housing market
Free with trial Conceptual artwork displaying a blue rupee coin plunging down a green spiral funnel, illustrating the concepts of shrinking wealth, economic recession, and currency drop, alpha transparent, blue pen doodle. Reduction arrow decrease vectors Financial crisis draining indian rupee coins in spiral, alpha transparent. Conceptual artwork displaying a blue rupee coin plunging down a green spiral funnel, illustrating the concepts of shrinking wealth, economic recession, and currency drop, alpha transparent, blue pen doodle.