Free with trial Illustration of a growing budget efficiency with a simple money bag closing tightly, a stylized downward-pointing cost arrow, and a stream of saved coins. Vector flat icon design on a white background for a cost control illustration --chaos 30 --ar 16:9 --v 7 Job ID: 35adf769-e45b-43cf-a8e7-0b2af69479b3. Reduction cost decrease illustrations Money Bag Downward Arrow, Financial Crisis, Economic Downturn, Falling Value. Illustration of a growing budget efficiency with a simple money bag closing tightly, a stylized downward-pointing cost arrow, and a stream of saved coins. Vector flat icon design on a white background for a cost control illustration --chaos 30 --ar 16:9 --v 7 Job ID: 35adf769-e45b-43cf-a8e7-0b2af69479b3
Free with trial Rate cut businesswoman. Woman cutting with scissors dollar banknote, angry with money loss, decrease in financial value, lost of investments, stock market panic. Vector flat style cartoon illustration. Reduction cost decrease vectors Rate cut businesswoman
Free with trial Rate cut businesswoman. Woman cutting with scissors dollar banknote, angry with money loss, decrease in financial value, lost of investment, stock market panic. Vector illustration, faceless character. Reduction cost decrease vectors Rate cut businesswoman
Free with trial A clean, minimalist set of line art icons representing business and service plan management. The icons depict 'Plan Switch' with a toggle symbol, 'Upgrade' with an upward arrow, and 'Downgrade' with a downward arrow. Another 'Downgrade' icon shows a document transitioning to a dollar sign, indicating a change in service level or cost. These graphics are ideal for websites, apps, presentations, and marketing materials related to subscription services, software features, or financial planning. Reduction cost decrease illustrations Business Plan Icons: Upgrade, Downgrade, and Switch. A clean, minimalist set of line art icons representing business and service plan management. The icons depict 'Plan Switch' with a toggle symbol, 'Upgrade' with an upward arrow, and 'Downgrade' with a downward arrow. Another 'Downgrade' icon shows a document transitioning to a dollar sign, indicating a change in service level or cost. These graphics are ideal for websites, apps, presentations, and marketing materials related to subscription services, software features, or financial planning.
Free with trial A striking 3D rendered red arrow pointing downwards, with a percentage symbol integrated into its design. The arrow is sharp and glossy, casting a subtle shadow on the clean white background. This graphic visually represents concepts such as price reduction, sales, economic decline, or negative financial trends. Reduction cost decrease illustrations Red 3D Percentage Symbol Arrow Pointing Downward on a White Background down arrow. A striking 3D rendered red arrow pointing downwards, with a percentage symbol integrated into its design. The arrow is sharp and glossy, casting a subtle shadow on the clean white background. This graphic visually represents concepts such as price reduction, sales, economic decline, or negative financial trends
Free with trial Concept of decline and decrease. Red arrow showing downward trend, falling graph, negative movement. Reduction cost decrease vectors Red arrow pointing downwards staircase falling graph. Concept of decline and decrease. Red arrow showing downward trend, falling graph, negative movement
Free with trial This minimalist graphic illustration features a bold red line chart trending downwards against a clean background. Several small downward-pointing arrows are positioned along the slope to emphasize the decline. The composition uses a flat design aesthetic with high contrast, conveying a clear message of loss, reduction, or negative performance in a professional context. Reduction cost decrease vectors A red line graph showing a sharp downward trend with multiple directional arrows. This minimalist graphic illustration features a bold red line chart trending. This minimalist graphic illustration features a bold red line chart trending downwards against a clean background. Several small downward-pointing arrows are positioned along the slope to emphasize the decline. The composition uses a flat design aesthetic with high contrast, conveying a clear message of loss, reduction, or negative performance in a professional context
Free with trial A collection of Indian Rupee symbols presented in circular and square icons, some featuring downward-pointing arrows indicating a decrease in value. A stack of golden coins is also depicted. The icons are arranged in a grid on a white background. Reduction cost decrease illustrations Indian Rupee Currency Symbols with Downward Arrows and Stacked Coins money finance. A collection of Indian Rupee symbols presented in circular and square icons, some featuring downward-pointing arrows indicating a decrease in value. A stack of golden coins is also depicted. The icons are arranged in a grid on a white background
Free with trial Red downward arrow pointing towards green house icon with euro symbol isolated on transparent background. Reduction cost decrease vectors Graphic showing decrease in interest rates for home loans. Red downward arrow pointing towards green house icon with euro symbol isolated on transparent background
Free with trial A person holding a smartphone displaying a glowing house with a percentage sign and red downward arrows, indicating a decrease in rates. Reduction cost decrease illustrations Person using a smartphone with a glowing house and percentage sign with red down generated using ai. A person holding a smartphone displaying a glowing house with a percentage sign and red downward arrows, indicating a decrease in rates
Free with trial 3D photo collage template trend artwork sketch of young lady doll pose hang forex investor inflation loss economy reduction dollars. Reduction cost decrease illustrations 3D photo collage template trend artwork sketch of young lady doll pose hang forex investor inflation loss economy
Free with trial Three glossy green arrows with percentage symbols pointing downwards, signifying a decrease, isolated on a clean white background. Reduction cost decrease illustrations Three green percentage down arrows isolated on white background. Three glossy green arrows with percentage symbols pointing downwards, signifying a decrease, isolated on a clean white background
Free with trial Two pairs of black and white illustrating financial decline. Each pair a stylized dollar bill or receipt alongside a downward-pointing arrow. The left pair is solid black, while the right pair is. Reduction cost decrease vectors Black and white representing financial decrease with dollar bill and arrows. two pairs of black and white illustrating financial decline. Each pair a stylized dollar bill or receipt alongside a downward-pointing arrow. The left pair is solid black, while the right pair is
Free with trial Large three dimensional green arrow facing downwards, symbol for decrease decline lower prices or falling trends in economy and business sectors. Reduction cost decrease illustrations Green arrow pointing down isolated on white for negative indicators. Large three dimensional green arrow facing downwards, symbol for decrease decline lower prices or falling trends in economy and business sectors
Free with trial Three prominent red arrows point downwards, each displaying a white percentage symbol. This imagery powerfully represents declining prices, sales, and financial reduction, ideal for marketing and economic contexts. Reduction cost decrease illustrations Three red downward arrows with percentage symbols symbolizing falling prices and discounts isolated on white background. Three prominent red arrows point downwards, each displaying a white percentage symbol. This imagery powerfully represents declining prices, sales, and financial reduction, ideal for marketing and economic contexts
Free with trial A red arrow pointing down with a white percentage symbol, signifying a decrease or sale, isolated on a transparent background. Reduction cost decrease vectors Red downward pointing arrow with a white percentage symbol indicating a sale or discount isolated on transparent background. A red arrow pointing down with a white percentage symbol, signifying a decrease or sale, isolated on a transparent background
Free with trial A black downward arrow merges with a percentage symbol on a white background. Clear details and vibrant colors. Reduction cost decrease illustrations Black downward arrow with percentage symbol on white background decrease. A black downward arrow merges with a percentage symbol on a white background. Clear details and vibrant colors
Free with trial Red down arrow and green up arrow with percentage signs represent financial rate changes market fluctuations price adjustments and economic trends. Reduction cost decrease vectors Percentage up and down arrows indicating financial rate increase and decrease. Red down arrow and green up arrow with percentage signs represent financial rate changes market fluctuations price adjustments and economic trends
Free with trial The image depicts a pair of scissors cutting through a red sign with the word 'TAX' written in bold white letters. The scissors are positioned diagonally across the sign, symbolizing a reduction or elimination of taxes. The visual metaphor strongly conveys the idea of tax cuts or relief, with the sign partially severed to emphasize the action. Reduction cost decrease illustrations Scissors cutting through a bold red tax sign isolated on white background. The image depicts a pair of scissors cutting through a red sign with the word 'TAX' written in bold white letters. The scissors are positioned diagonally across the sign, symbolizing a reduction or elimination of taxes. The visual metaphor strongly conveys the idea of tax cuts or relief, with the sign partially severed to emphasize the action
Free with trial Financial crisis graph vector icon. filled flat sign for mobile concept and web design. Dollar rate decrease glyph icon. Symbol, logo illustration. Vector graphics. Reduction cost decrease vectors Financial crisis graph vector icon
Free with trial The image shows a three-dimensional green arrow pointing downward with a percentage symbol inside it. The arrow represents a decline or reduction, often associated with discounts, lowered prices, or decreases in rates and percentages. Reduction cost decrease illustrations Green downward arrow symbolizing a decrease in percentage or discount rates. The image shows a three-dimensional green arrow pointing downward with a percentage symbol inside it. The arrow represents a decline or reduction, often associated with discounts, lowered prices, or decreases in rates and percentages
Free with trial The inscription rates arrow in the down direction. Reduction cost decrease illustrations Price reduction. The inscription rates arrow in the down direction
Free with trial This image depicts the concept of declining consumer price index. Stack of coins with a falling red arrow showcase financial loss. Wooden blocks spell CPI. The visual is ideal for illustrating economic downturn, market correction, inflation reduction, budget concerns, finance, recession and investme. Reduction cost decrease illustrations Consumer Price Index Decline: Economic Downturn and Financial Loss Indicated by Coins and Arrow. This image depicts the concept of declining consumer price index. Stack of coins with a falling red arrow showcase financial loss. Wooden blocks spell CPI. The visual is ideal for illustrating economic downturn, market correction, inflation reduction, budget concerns, finance, recession and investme
Free with trial This image features a bold black percentage symbol positioned above a downward-pointing arrow. The design conveys the concept of reduction, decline, or a discount, suitable for illustrating rate decreases. Reduction cost decrease vectors Decreasing Percentage: A Symbolic Representation of Lower Rates and Declining Values. This image features a bold black percentage symbol positioned above a downward-pointing arrow. The design conveys the concept of reduction, decline, or a discount, suitable for illustrating rate decreases.
Free with trial A glossy red percentage symbol is superimposed on a downward pointing arrow, suggesting a decrease in value or price. Reduction cost decrease vectors Red percentage symbol with downward arrow isolated on a transparent background sign. A glossy red percentage symbol is superimposed on a downward pointing arrow, suggesting a decrease in value or price
Free with trial Captivating red downward arrow featuring a prominent white percentage sign, a powerful visual metaphor for significant price drops, sales events, and special offers. Ideal for marketing and promotional materials. Reduction cost decrease vectors Red downward arrow with percentage symbol symbolizing sale discounts and price reduction. Captivating red downward arrow featuring a prominent white percentage sign, a powerful visual metaphor for significant price drops, sales events, and special offers. Ideal for marketing and promotional materials
Free with trial Three green arrows pointing downwards, each featuring a white percentage sign. This imagery signifies financial decline, price reduction, or decreasing interest rates, often associated with sales or economic trends. Reduction cost decrease illustrations Green downward arrows with percentage signs symbolizing falling prices or interest rates. Three green arrows pointing downwards, each featuring a white percentage sign. This imagery signifies financial decline, price reduction, or decreasing interest rates, often associated with sales or economic trends
Free with trial Set of outline and solid dollar coin icons with arrow pointing down for economy. Reduction cost decrease vectors Dollar coins with downward arrow icon representing financial loss and price reduction set. Set of outline and solid dollar coin icons with arrow pointing down for economy
Free with trial Crisis. Graphs and charts templates. Business infographics. Statistic and data, bankruptcy, financial crisis, money loss, down arrow, economy reduction. Financial chart. Vector illustration. Reduction cost decrease illustrations Crisis. Graphs and charts templates. Business infographics.
Free with trial A glossy glowing yellow light bulb paired with a bold blue downward-pointing arrow creates a striking 3D rendered icon set against a soft mint green background, blending the concept of ideas with a sense of reduction, downloading, or declining energy. This versatile image works effectively for business presentations, infographics, technology UI design, and content illustrating cost reduction,. Reduction cost decrease illustrations Glowing yellow light bulb with blue downward arrow 3D icon on mint background idea decline concept. A glossy glowing yellow light bulb paired with a bold blue downward-pointing arrow creates a striking 3D rendered icon set against a soft mint green background, blending the concept of ideas with a sense of reduction, downloading, or declining energy. This versatile image works effectively for business presentations, infographics, technology UI design, and content illustrating cost reduction,
Free with trial Depreciation linear icon. Accounting method of allocating cost of assets over its useful life. Thin line customizable illustration. Contour symbol. Vector isolated outline drawing. Editable stroke. Reduction cost decrease illustrations Depreciation linear icon
Free with trial Increasing the quality and optimizing the costs of products or services to improve efficiency. Effective business, effective risk. Reduction cost decrease illustrations Cost and quality control, business strategy and project management concept. Increasing the quality and optimizing the costs of products or services to improve efficiency. Effective business, effective risk
Free with trial Increasing the quality and optimizing the costs of products or services to improve efficiency. Effective business, effective risk. Reduction cost decrease illustrations Cost and quality control, business strategy and project management concept. Increasing the quality and optimizing the costs of products or services to improve efficiency. Effective business, effective risk
Free with trial This image shows a simple black icon made up of a globe with clear latitude and longitude lines, a downward pointing arrow angled toward the globe, and a dollar symbol placed inside a circle beside it. The combination of these elements suggests a shift in financial conditions that affect activity across different regions. The downward arrow introduces the idea of reduced movement, lower value, or slowing economic flow, while the globe hints at broad geographic reach. The dollar symbol adds a monetary focus, making the overall theme relate to changes in financial patterns or adjustments in international transactions. The clean design keeps attention on the shapes and their meaning without adding extra detail. This type of icon can be used in discussions about shifting markets, global cost changes, or the influence of external factors on financial outcomes. It also works well in presentations or reports that need a clear visual to represent financial movement across borders. The straightforward layout helps viewers quickly understand the concept being communicated. Reduction cost decrease illustrations Global icon with downward arrow and dollar symbol indicating reduced international financial activity. This image shows a simple black icon made up of a globe with clear latitude and longitude lines, a downward pointing arrow angled toward the globe, and a dollar symbol placed inside a circle beside it. The combination of these elements suggests a shift in financial conditions that affect activity across different regions. The downward arrow introduces the idea of reduced movement, lower value, or slowing economic flow, while the globe hints at broad geographic reach. The dollar symbol adds a monetary focus, making the overall theme relate to changes in financial patterns or adjustments in international transactions. The clean design keeps attention on the shapes and their meaning without adding extra detail. This type of icon can be used in discussions about shifting markets, global cost changes, or the influence of external factors on financial outcomes. It also works well in presentations or reports that need a clear visual to represent financial movement across borders. The straightforward layout helps viewers quickly understand the concept being communicated.
Free with trial Depreciation RGB color icon. Accounting method of allocating cost of different assets over its useful life or life expectancy. Isolated vector illustration. Reduction cost decrease illustrations Depreciation RGB color icon
Free with trial Abstract vector showing price decreasing and investment increasing, using blue lines and pink accents. Simple composition, balanced for illustrative purposes. Reduction cost decrease vectors Abstract visual illustrating price reduction, investment, and financial dynamics on a black background. Abstract vector showing price decreasing and investment increasing, using blue lines and pink accents. Simple composition, balanced for illustrative purposes.
Free with trial Percent sign, people stand near a percent. Specials, sales, price cuts, rate reduction. Vector illustration. Reduction cost decrease vectors Percent sign, people stand near a percent
Free with trial Depreciation black glyph icon. Accounting method of allocating cost of different assets over its useful life or life expectancy. Silhouette symbol on white space. Vector isolated illustration. Reduction cost decrease illustrations Depreciation black glyph icon
Free with trial Image depicting a downward trend in business costs, visualized with wooden blocks spelling 'COST' and a falling graph. Reduction cost decrease illustrations Decreasing Business Costs: Financial Strategy and Economic Downturn Impact on Expenses. Image depicting a downward trend in business costs, visualized with wooden blocks spelling 'COST' and a falling graph
Free with trial Up and down line icon Percentage arrow, Design concept for banking credit interest rate finance. Reduction cost decrease vectors Up, percentage, decline, pictogram, interest, decrease, increase, interest rate, gdp, growth, business growth, profit, arrow up. up and down line icon Percentage arrow, Design concept for banking credit interest rate finance
Free with trial Coins meticulously stacked on a solar panel symbolize energy savings and financial returns from renewable energy. The bright background emphasizes the positive impact of investing in sustainable power solutions, highlighting the cost-effectiveness of solar technology. Reduction cost decrease illustrations Solar Panel Savings Coins Stacked High on Renewable Energy System Showing Financial Benefits and Investment in. Coins meticulously stacked on a solar panel symbolize energy savings and financial returns from renewable energy. The bright background emphasizes the positive impact of investing in sustainable power solutions, highlighting the cost-effectiveness of solar technology
Free with trial Lower GDP blue gradient concept icon. Negative unemployment outcome. Financial loss. Decrease in economy. Social issue idea thin line illustration. Vector isolated outline RGB color drawing. Reduction cost decrease vectors Lower GDP blue gradient concept icon
Free with trial A businessman hand using scissors to cut heavy cost burden and let profit fly. Reduction cost decrease vectors Cut expense to increase profit, improve business profitability. A businessman hand using scissors to cut heavy cost burden and let profit fly
Free with trial Reduce labor costs icon Vector symbol or sign set collection in black and white outline. Reduction cost decrease vectors Worker Wage Reduction Icon Symbolizing Decrease in Labor Income. Reduce labor costs icon Vector symbol or sign set collection in black and white outline
Free with trial Coin with dollar sign, downward arrow. Symbol of financial loss, cost reduction, decrease in value. Business concept. Reduction cost decrease vectors Orange coin with dollar sign and blue downward arrow representing financial loss or decreasing value concept business finance. Coin with dollar sign, downward arrow. Symbol of financial loss, cost reduction, decrease in value. Business concept
Free with trial Coin with dollar sign, downward arrow. Symbol of financial loss, cost reduction, decrease in value. Business concept. Reduction cost decrease vectors Blue coin with dollar sign and orange downward arrow representing financial loss or decreasing value concept business finance. Coin with dollar sign, downward arrow. Symbol of financial loss, cost reduction, decrease in value. Business concept
Free with trial Loss of income blue gradient concept icon. Reduction in budget. Financial decline. Economic crisis. Unemployment idea thin line illustration. Vector isolated outline RGB color drawing. Reduction cost decrease vectors Loss of income blue gradient concept icon
Free with trial Miniature house and curved arrows down up. Concept of low cost real estate. Lower mortgage interest rates. Falling prices for rental housing and apartments. Reducing demand for home buying, 3d render. Reduction cost decrease illustrations Miniature house and curved arrows down up
Free with trial Graph reducing the cost of a barrel of oil. Stock illustration. Reduction cost decrease vectors Barrel of oil
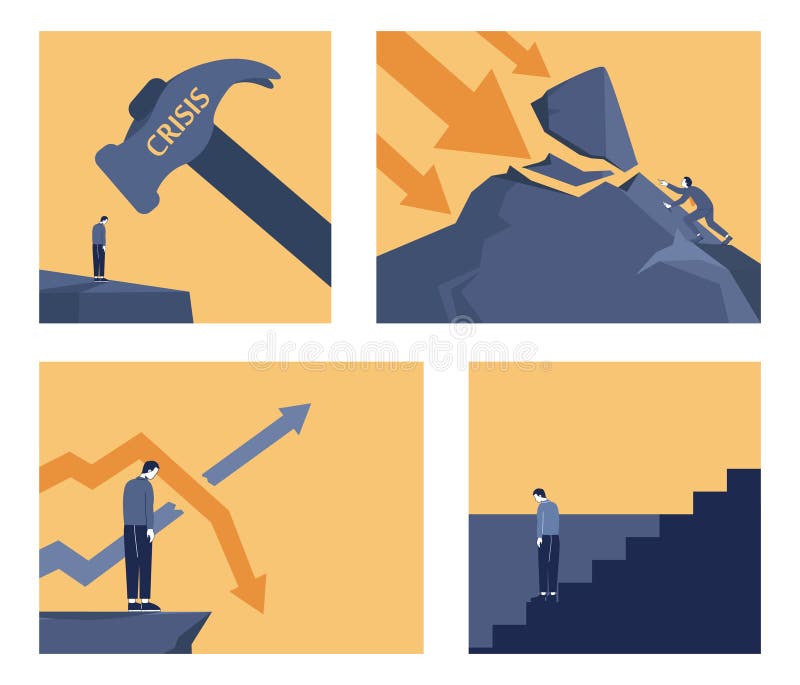
Free with trial World financial crisis, Oil price drop, Collapse of the economy, Bad economy reduction, Financial crisis, Market fall, Bankruptcy, Budget recession, Investment expenses. Reduction cost decrease vectors World financial crisis
Free with trial Crisis. Graphs and charts templates. Business infographics. Investment expenses and bad economy reduction. Reduction cost decrease vectors World financial crisis. Crisis. Graphs and charts templates. Business infographics. Investment expenses and bad economy reduction
Free with trial Wooden blocks spelling COST with a downward trending arrow and stack of coins, signifying reduced expenses and cost savings. Reduction cost decrease illustrations Decreasing Costs Business Finance Concept: A Visual Representation of Reduced Expenses and Financial Savings. Wooden blocks spelling COST with a downward trending arrow and stack of coins, signifying reduced expenses and cost savings
Free with trial Financial crisis icons. Concept of decrease economy, bankruptcy, poverty. Vector doodle signs with broken piggy bank, cut money, down graph, destroyed bank and safe with lock. Reduction cost decrease vectors Financial crisis, bankruptcy, poverty icons. Financial crisis icons. Concept of decrease economy, bankruptcy, poverty. Vector doodle signs with broken piggy bank, cut money, down graph, destroyed bank and safe with lock
Free with trial Depreciation icon. Accounting method of allocating cost of different assets over its useful life or life expectancy. Linear black and RGB color styles. Isolated vector illustrations. Reduction cost decrease illustrations Depreciation icon
Free with trial Decrease icon or logo isolated sign symbol vector illustration - Collection of high quality black style vector icons, seles chart icon isolated sign symbol vector illustration - Collection of high quality. Reduction cost decrease vectors Decrease icon or logo isolated sign symbol vector illustration
Free with trial Modern graph line icon. Premium pictogram isolated on a white background. Vector illustration. Stroke high quality symbol. Decrease icon in modern line style. Reduction cost decrease vectors Modern graph line icon.
Free with trial 3D Isometric Flat Vector Conceptual Illustration of Pay Cut, Salary Reduction. Reduction cost decrease vectors 3D Isometric Flat Vector Conceptual Illustration of Pay Cut. 3D Isometric Flat Vector Conceptual Illustration of Pay Cut, Salary Reduction.
Free with trial Decline prices. Businessman with magnifying glass looks at the falling chart. Graph drop. Reduction money. Lower finance. Vector illustration flat design. Isolated on white background. Reduction cost decrease vectors Decline prices. Businessman with magnifying glass looks at the falling chart
Free with trial Bankruptcy online service or platform. Financiall crisis with falling down profit graph and money decrease. Online financing. Flat vector illustration. Reduction cost decrease illustrations Bankruptcy online service or platform. Financiall crisis with falling
Free with trial Percentage arrow down, percentage decrease-interest rate drop, Business failed and financial crisis concept. Reduction cost decrease vectors Business failed and financial crisis concept
Free with trial Stock graph crisis cartoon flat vector illustration. Stock financial trade market diagram landing page template. Financial arrow decrease graph. Reduction cost decrease vectors Stock graph crisis cartoon vector landing page template. Stock financial trade market diagram. Stock graph crisis cartoon flat vector illustration. Stock financial trade market diagram landing page template. Financial arrow decrease graph.
Free with trial Bankruptcy web banner or landing page set. Financiall crisis with falling down profit graph and money decrease. Idea of financial and business decline and loses. Flat vector illustration. Reduction cost decrease vectors Bankruptcy web banner or landing page set. Financiall crisis
Free with trial Loss of income red gradient concept icon. Reduction in budget. Financial decline. Economic crisis. Unemployment idea thin line illustration. Vector isolated outline RGB color drawing. Reduction cost decrease vectors Loss of income red gradient concept icon
Free with trial Financial crisis graph line icon. linear style sign for mobile concept and web design. Dollar rate decrease outline vector icon. Symbol, logo illustration. Vector graphics. Reduction cost decrease vectors Financial crisis graph line icon
Free with trial Loss of income concept icon. Reduction in budget. Financial decline. Economic crisis. Unemployment idea thin line illustration. Vector isolated outline RGB color drawing. Editable stroke. Reduction cost decrease vectors Loss of income concept icon
Free with trial Money reduction icon symbol. Illustration vector. Reduction cost decrease vectors Money reduction icon. Illustration vector
Free with trial Lower GDP red gradient concept icon. Negative unemployment outcome. Financial loss. Decrease in economy. Social issue idea thin line illustration. Vector isolated outline RGB color drawing. Reduction cost decrease vectors Lower GDP red gradient concept icon
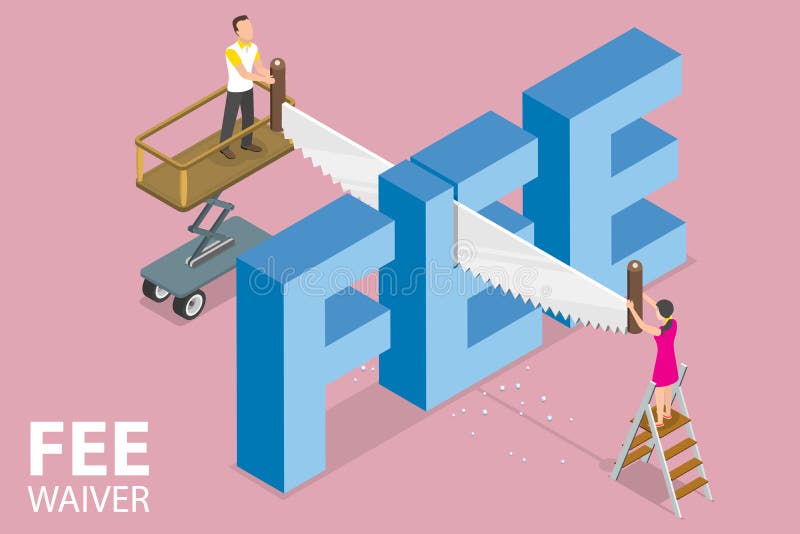
Free with trial 3D Isometric Flat Vector Conceptual Illustration of Fee Waiver, Financial Expense Reduction. Reduction cost decrease vectors 3D Isometric Flat Vector Conceptual Illustration of Fee Waiver
Free with trial Bankruptcy web banner or landing page set. Financiall crisis with falling down profit graph and money decrease. Idea of financial and business risk and loses. Flat vector illustration. Reduction cost decrease vectors Bankruptcy web banner or landing page set. Financiall crisis with falling down
Free with trial Word price and up, down arrows on buttons. Price analysis. Budget calculation. Change in value. Market economy. Cost regulation. Impact of inflation. 3d render. Reduction cost decrease illustrations Word price and up, down arrows on buttons
Free with trial World financial crisis global financial cost drop down arrow symbol. Reduction cost decrease vectors World financial crisis symbol. World financial crisis global financial cost drop down arrow symbol
Free with trial The inscription rates arrow in the down direction. Reduction cost decrease illustrations Price reduction. The inscription rates arrow in the down direction
Free with trial Cash loss graph. Finance inflation schedule, money loss and decrease in income. Trader loss data, budget losses graph or investment bankruptcies isolated vector illustration. Reduction cost decrease vectors Money loss and decrease in income. Trader loss data, budget losses graph or
Free with trial Currency rate. Won symbol and red arrow on buttons. Money appreciation concept. Default and bankruptcy. Decrease in foreign exchange reserves. Falling prices. 3d render. Reduction cost decrease illustrations Currency rate. Won symbol and red arrow on buttons
Free with trial Currency rate. Peso symbol and red arrow on buttons. Money appreciation concept. Default and bankruptcy. Decrease in foreign exchange reserves. Falling prices. 3d render. Reduction cost decrease illustrations Currency rate. Peso symbol and red arrow on buttons
Free with trial Stock graph crisis cartoon modern flat vector mobile app page screen template. Stock financial trade market diagram landing page template. Financial arrow decrease graph. Reduction cost decrease vectors Stock graph crisis cartoon modern flat vector mobile app page screen template. Stock financial trade market diagram. Stock graph crisis cartoon modern flat vector mobile app page screen template. Stock financial trade market diagram landing page template. Financial arrow decrease graph.
Free with trial Crisis concept set. Bankruptcy with falling down profit graph and money decrease. Idea of financial and business decline and losses. Flat vector illustration. Reduction cost decrease vectors Crisis concept set. Bankruptcy with falling down profit graph and money
Free with trial Currency rate. Zloty symbol and red arrow on buttons. Money appreciation concept. Default and bankruptcy. Decrease in foreign exchange reserves. Falling prices. 3d render. Reduction cost decrease illustrations Currency rate. Zloty symbol and red arrow on buttons
Free with trial Currency rate. Rupee symbol and red arrow on buttons. Money appreciation concept. Default and bankruptcy. Decrease in foreign exchange reserves. Falling prices. 3d render. Reduction cost decrease illustrations Currency rate. Rupee symbol and red arrow on buttons