Free with trial Cost Reduction Vector Illustration depicting Decrease, Price Minimization, or Falling Profit Rates in Business, in a Flat Style Cartoon Background. Reduction cost decrease vectors Cost Reduction Vector Illustration depicting Decrease, Price Minimization, or Falling Profit Rates in Business, in a Flat Style
Free with trial Cost reduction concept with red downward arrow, bar chart, and coins on financial market background. Business finance idea for expense control, budgeting, and profit management. Reduction cost decrease illustrations Cost Reduction Strategy with Financial Chart and Arrow 3d render. Cost reduction concept with red downward arrow, bar chart, and coins on financial market background. Business finance idea for expense control, budgeting, and profit management
Free with trial Cost reduction concept with red downward arrow, bar chart, and coins on financial market background. Business finance idea for expense control, budgeting, and profit management. Reduction cost decrease illustrations Cost Reduction Strategy with Financial Chart and Arrow 3d render. Cost reduction concept with red downward arrow, bar chart, and coins on financial market background. Business finance idea for expense control, budgeting, and profit management
Free with trial Cost Reduction Vector Illustration depicting Decrease, Price Minimization, or Falling Profit Rates in Business, in a Flat Style Cartoon Background. Reduction cost decrease vectors Cost Reduction Vector Illustration depicting Decrease, Price Minimization, or Falling Profit Rates in Business, in a Flat Style
Free with trial Cost Reduction Vector Illustration depicting Decrease, Price Minimization, or Falling Profit Rates in Business, in a Flat Style Cartoon Background. Reduction cost decrease vectors Cost Reduction Vector Illustration depicting Decrease, Price Minimization, or Falling Profit Rates in Business, in a Flat Style
Free with trial Cost Reduction Vector Illustration depicting Decrease, Price Minimization, or Falling Profit Rates in Business, in a Flat Style Cartoon Background. Reduction cost decrease vectors Cost Reduction Vector Illustration depicting Decrease, Price Minimization, or Falling Profit Rates in Business, in a Flat Style
Free with trial Cost Reduction Vector Illustration depicting Decrease, Price Minimization, or Falling Profit Rates in Business, in a Flat Style Cartoon Background. Reduction cost decrease vectors Cost Reduction Vector Illustration depicting Decrease, Price Minimization, or Falling Profit Rates in Business, in a Flat Style
Free with trial Blue Dollar rate decrease icon isolated on blue background. Cost reduction. Money symbol with down arrow. Business lost crisis decrease. Minimalism concept. 3D render illustration. Reduction cost decrease illustrations Blue Dollar rate decrease icon isolated on blue background. Cost reduction. Money symbol with down arrow. Business lost
Free with trial Blue Dollar rate decrease icon isolated on blue background. Cost reduction. Money symbol with down arrow. Business lost crisis decrease. Minimalism concept. 3D render illustration. Reduction cost decrease illustrations Blue Dollar rate decrease icon isolated on blue background. Cost reduction. Money symbol with down arrow. Business lost
Free with trial White line Dollar rate decrease icon isolated with long shadow background. Cost reduction. Money symbol with down arrow. Business lost crisis decrease. Green circle button. Vector. Reduction cost decrease vectors White line Dollar rate decrease icon isolated with long shadow background. Cost reduction. Money symbol with down arrow
Free with trial Set Dollar rate decrease icon isolated on black and white background. Cost reduction. Money symbol with down arrow. Business lost crisis decrease. Vector. Reduction cost decrease illustrations Set Dollar rate decrease icon isolated on black and white background. Cost reduction. Money symbol with down arrow
Free with trial Black Dollar rate decrease icon isolated on white background. Cost reduction. Money symbol with down arrow. Business lost crisis decrease. Yellow square button. Vector. Reduction cost decrease illustrations Black Dollar rate decrease icon isolated on white background. Cost reduction. Money symbol with down arrow. Business
Free with trial Line Dollar rate decrease icon isolated seamless pattern on black background. Cost reduction. Money symbol with down arrow. Business lost crisis decrease. Vector. Reduction cost decrease vectors Line Dollar rate decrease icon isolated seamless pattern on black background. Cost reduction. Money symbol with down
Free with trial Line Dollar rate decrease icon isolated seamless pattern on black background. Cost reduction. Money symbol with down arrow. Business lost crisis decrease. Vector. Reduction cost decrease illustrations Line Dollar rate decrease icon isolated seamless pattern on black background. Cost reduction. Money symbol with down
Free with trial Grunge Dollar rate decrease icon isolated on white background. Cost reduction. Money symbol with down arrow. Business lost crisis decrease. Monochrome vintage drawing. Vector. Reduction cost decrease vectors Grunge Dollar rate decrease icon isolated on white background. Cost reduction. Money symbol with down arrow. Business
Free with trial Pop art Dollar rate decrease icon isolated on color background. Cost reduction. Money symbol with down arrow. Business lost crisis decrease. Vector. Reduction cost decrease illustrations Pop art Dollar rate decrease icon isolated on color background. Cost reduction. Money symbol with down arrow. Business
Free with trial Colorful Dollar rate decrease icon isolated on white background. Cost reduction. Money symbol with down arrow. Business lost crisis decrease. Square button. 3D render illustration. Reduction cost decrease illustrations Colorful Dollar rate decrease icon isolated on white background. Cost reduction. Money symbol with down arrow. Business
Free with trial Colorful Dollar rate decrease icon isolated on white background. Cost reduction. Money symbol with down arrow. Business lost crisis decrease. Square button. 3D render illustration. Reduction cost decrease illustrations Colorful Dollar rate decrease icon isolated on white background. Cost reduction. Money symbol with down arrow. Business
Free with trial Colorful Dollar rate decrease icon isolated on white background. Cost reduction. Money symbol with down arrow. Business lost crisis decrease. Square button. 3D render illustration. Reduction cost decrease illustrations Colorful Dollar rate decrease icon isolated on white background. Cost reduction. Money symbol with down arrow. Business
Free with trial Colorful Dollar rate decrease icon isolated on white background. Cost reduction. Money symbol with down arrow. Business lost crisis decrease. Square button. 3D render illustration. Reduction cost decrease illustrations Colorful Dollar rate decrease icon isolated on white background. Cost reduction. Money symbol with down arrow. Business
Free with trial Colorful Dollar rate decrease icon isolated on white background. Cost reduction. Money symbol with down arrow. Business lost crisis decrease. Minimalism concept. 3D render illustration. Reduction cost decrease illustrations Colorful Dollar rate decrease icon isolated on white background. Cost reduction. Money symbol with down arrow. Business
Free with trial Glowing neon line Dollar rate decrease icon isolated on black background. Cost reduction. Money symbol with down arrow. Business lost crisis decrease. Vector. Reduction cost decrease illustrations Glowing neon line Dollar rate decrease icon isolated on black background. Cost reduction. Money symbol with down arrow
Free with trial Isometric line Dollar rate decrease icon isolated on green and blue background. Cost reduction. Money symbol with down arrow. Business lost crisis decrease. Silver square button. Vector. Reduction cost decrease illustrations Isometric line Dollar rate decrease icon isolated on green and blue background. Cost reduction. Money symbol with down
Free with trial Colorful Dollar rate decrease icon isolated on white background. Cost reduction. Money symbol with down arrow. Business lost crisis decrease. Minimalism concept. 3D render illustration. Reduction cost decrease illustrations Colorful Dollar rate decrease icon isolated on white background. Cost reduction. Money symbol with down arrow. Business
Free with trial Colorful Dollar rate decrease icon isolated on white background. Cost reduction. Money symbol with down arrow. Business lost crisis decrease. Square button. 3D render illustration. Reduction cost decrease illustrations Colorful Dollar rate decrease icon isolated on white background. Cost reduction. Money symbol with down arrow. Business
Free with trial Isometric line Dollar rate decrease icon isolated on green and blue background. Cost reduction. Money symbol with down arrow. Business lost crisis decrease. Silver square button. Vector. Reduction cost decrease illustrations Isometric line Dollar rate decrease icon isolated on green and blue background. Cost reduction. Money symbol with down
Free with trial Grey Dollar rate decrease icon isolated on beige background. Cost reduction. Money symbol with down arrow. Business lost crisis decrease. Abstract circle random dots. Vector. Reduction cost decrease illustrations Grey Dollar rate decrease icon isolated on beige background. Cost reduction. Money symbol with down arrow. Business lost
Free with trial Set Dollar rate decrease icon isolated on blue and white, black background. Cost reduction. Money symbol with down arrow. Business lost crisis decrease. Vector. Reduction cost decrease vectors Set Dollar rate decrease icon isolated on blue and white, black background. Cost reduction. Money symbol with down arrow
Free with trial Gold Dollar rate decrease icon isolated on white background. Cost reduction. Money symbol with down arrow. Business lost crisis decrease. Vector. Reduction cost decrease illustrations Gold Dollar rate decrease icon isolated on white background. Cost reduction. Money symbol with down arrow. Business lost
Free with trial Gold Dollar rate decrease icon isolated on white background. Cost reduction. Money symbol with down arrow. Business lost crisis decrease. Vector. Reduction cost decrease illustrations Gold Dollar rate decrease icon isolated on white background. Cost reduction. Money symbol with down arrow. Business lost
Free with trial Blue Dollar rate decrease icon isolated on white background. Cost reduction. Money symbol with down arrow. Business lost crisis decrease. Logo design template element. Vector. Reduction cost decrease illustrations Blue Dollar rate decrease icon isolated on white background. Cost reduction. Money symbol with down arrow. Business lost
Free with trial Gold Dollar rate decrease icon isolated on white background. Cost reduction. Money symbol with down arrow. Business lost crisis decrease. Vector. Reduction cost decrease illustrations Gold Dollar rate decrease icon isolated on white background. Cost reduction. Money symbol with down arrow. Business lost
Free with trial Gold Dollar rate decrease icon isolated on white background. Cost reduction. Money symbol with down arrow. Business lost crisis decrease. Vector. Reduction cost decrease illustrations Gold Dollar rate decrease icon isolated on white background. Cost reduction. Money symbol with down arrow. Business lost
Free with trial Isometric Dollar rate decrease icon isolated on orange and blue background. Cost reduction. Money symbol with down arrow. Business lost crisis decrease. Vector. Reduction cost decrease illustrations Isometric Dollar rate decrease icon isolated on orange and blue background. Cost reduction. Money symbol with down arrow
Free with trial Isometric Dollar rate decrease icon isolated on orange and blue background. Cost reduction. Money symbol with down arrow. Business lost crisis decrease. Vector. Reduction cost decrease illustrations Isometric Dollar rate decrease icon isolated on orange and blue background. Cost reduction. Money symbol with down arrow
Free with trial Cost reduction graph displaying financial decrease with an interactive digital pen. High-resolution image featuring a laptop, smartphone, and ample copy space on a modern wooden desk. Perfect for business presentations, financial reports, and marketing campaigns. Reduction cost decrease illustrations Financial Cost Reduction Digital Graph, Business Laptop, Modern Office Workspace. Cost reduction graph displaying financial decrease with an interactive digital pen. High-resolution image featuring a laptop, smartphone, and ample copy space on a modern wooden desk. Perfect for business presentations, financial reports, and marketing campaigns.
Free with trial Price and discount, cost reduction, profit growth financial strategy line icon set. Increase and decrease, optimization of price, competition thin black and red outline symbols vector illustration. Reduction cost decrease vectors Price and discount, cost reduction, profit growth financial strategy line icon set
Free with trial Young woman cuts off percentage sign with knife. Financial recession. Finance crisis. Expense decrease percent. Income reduction. Banking tax cost. Rate split. Vector concept of monetary inflation. Reduction cost decrease vectors Young woman cuts off percentage sign with knife. Financial recession. Finance crisis. Expense decrease percent. Income reduction
Free with trial Glowing neon line Dollar rate decrease icon isolated on black background. Cost reduction. Money symbol with down arrow. Business lost crisis decrease. Colorful outline concept. Vector. Reduction cost decrease vectors Glowing neon line Dollar rate decrease icon isolated on black background. Cost reduction. Money symbol with down arrow
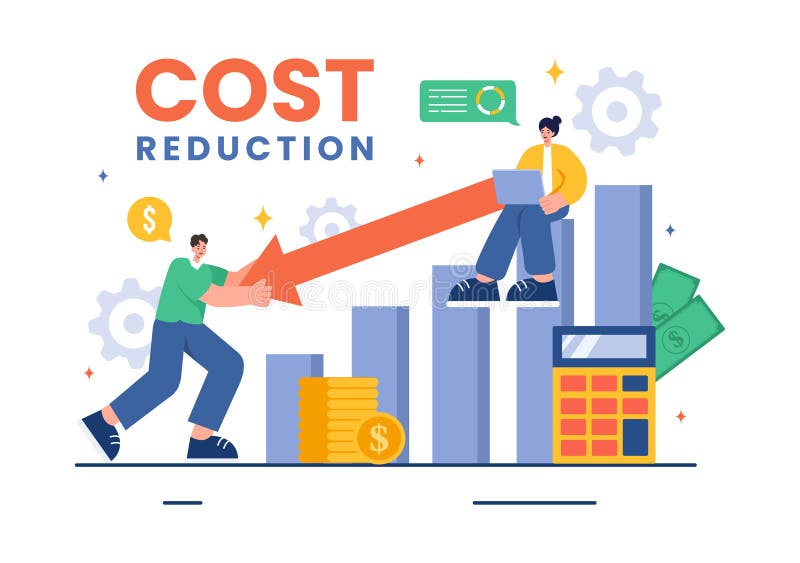
Free with trial Cost Reduction. rightward. red. downward. Profit Growth. upward. green. right. up. up-right. Balanced strategy towards both profit growth and cost reduction. The intersection of the red and green arrows indicates a balanced approach where both cost reduction and profit growth are optimized simultaneously. Strategies to decrease expenses without. Reduction cost decrease illustrations Balancing profit growth and cost reduction strategies for business optimization. Cost Reduction. rightward. red. downward. Profit Growth. upward. green. upward. right. Cost Reduction. red. up. Profit Growth. green. up-right. Balanced strategy towards both profit growth and cost reduction. The intersection of the red and green arrows indicates a balanced approach where both cost reduction and profit growth are optimized simultaneously.. Strategies to decrease expenses without
Free with trial A businessman is shown from a high angle, typing on a silver laptop. The screen displays a green downward-pointing arrow above the word COST, symbolizing cost reduction or decrease. The setting appears to be a professional office environment. Reduction cost decrease illustrations Businessman using laptop with cost reduction arrow on screen. A businessman is shown from a high angle, typing on a silver laptop. The screen displays a green downward-pointing arrow above the word COST, symbolizing cost reduction or decrease. The setting appears to be a professional office environment
Free with trial A line graph illustrating the gradual decrease in energy consumption over several months, with lightning bolt icons transitioning to leaf icons, symbolizing a shift from high energy usage to sustainable, cost-effective practices. The x-axis represents time in months, and the y-axis shows energy consumption in kWh, clearly indicating a downward trend in energy use and associated costs. Reduction cost decrease illustrations Energy Consumption Decrease Over Time Leading to Cost Reduction. A line graph illustrating the gradual decrease in energy consumption over several months, with lightning bolt icons transitioning to leaf icons, symbolizing a shift from high energy usage to sustainable, cost-effective practices. The x-axis represents time in months, and the y-axis shows energy consumption in kWh, clearly indicating a downward trend in energy use and associated costs
Free with trial A businessman's hands interact with a futuristic virtual interface displaying a declining bar chart, symbolizing cost reduction or performance decrease. This central icon is encircled by various business process icons, representing data analysis, management, and strategy. The concept illustrates managing a business downturn, financial crisis, or economic recession through technology and data-driven decisions. It's an ideal visual for topics like risk management, cost optimization, efficiency improvement, and corporate strategy in a challenging economic environment, set against a modern, dark background. Reduction cost decrease illustrations Business Cost Reduction and Performance Decline Analysis Concept. A businessman's hands interact with a futuristic virtual interface displaying a declining bar chart, symbolizing cost reduction or performance decrease. This central icon is encircled by various business process icons, representing data analysis, management, and strategy. The concept illustrates managing a business downturn, financial crisis, or economic recession through technology and data-driven decisions. It's an ideal visual for topics like risk management, cost optimization, efficiency improvement, and corporate strategy in a challenging economic environment, set against a modern, dark background.
Free with trial Cost reduction icon with dollar sign and downward arrow in circle. Financial symbol for, saving money. Economy and budget concept. Decrease expense logo. Reduction cost decrease illustrations Cost reduction icon with dollar sign and downward arrow in circle. Financial symbol for saving money. Economy and budget concept. Cost reduction icon with dollar sign and downward arrow in circle. Financial symbol for, saving money. Economy and budget concept. Decrease expense logo.
Free with trial Glowing neon Dollar rate decrease icon isolated on brick wall background. Cost reduction. Money symbol with down arrow. Business lost crisis decrease. Neon light alphabet. Vector. Reduction cost decrease illustrations Glowing neon Dollar rate decrease icon isolated on brick wall background. Cost reduction. Money symbol with down arrow
Free with trial Blue line Dollar rate decrease icon isolated on white background. Cost reduction. Money symbol with down arrow. Business lost crisis decrease. Logo design template element. Vector. Reduction cost decrease vectors Blue line Dollar rate decrease icon isolated on white background. Cost reduction. Money symbol with down arrow. Business
Free with trial Increase and decrease, optimization of price, competition thin black and red outline symbols vector illustration Price and discount, cost reduction, profit growth financial strategy line icon set. Reduction cost decrease vectors Price and discount, cost reduction, profit growth financial strategy line icon set
Free with trial Isometric line Dollar rate decrease icon isolated on blue, green and purple background. Cost reduction. Money symbol with down arrow. Business lost crisis decrease. White circle button. Vector. Reduction cost decrease illustrations Isometric line Dollar rate decrease icon isolated on blue, green and purple background. Cost reduction. Money symbol
Free with trial Glowing neon line Dollar rate decrease icon isolated on black background. Cost reduction. Money symbol with down arrow. Business lost crisis decrease. Colorful outline concept. Vector. Reduction cost decrease vectors Glowing neon line Dollar rate decrease icon isolated on black background. Cost reduction. Money symbol with down arrow
Free with trial Cost reduction, cost efficiency, business concept. Reduction cost decrease illustrations Cost reduction, cost efficiency, business concept
Free with trial Euro Currency Reduction and Cost Cutting Icons vol 30148. Reduction cost decrease vectors Euro Currency Reduction and Cost Cutting Icons
Free with trial Price drop icon, lower cost reduction. Loss market sale concept, discount sign. Reduction cost decrease vectors Price drop icon, lower cost reduction. Loss market sale concept
Free with trial Cost reduction concept with red downward arrow, bar chart, and coins on financial market background. Business finance idea for expense control, budgeting, and profit management. Reduction cost decrease illustrations Cost Reduction Strategy with Financial Chart and Arrow 3d render. Cost reduction concept with red downward arrow, bar chart, and coins on financial market background. Business finance idea for expense control, budgeting, and profit management
Free with trial Cost reduction concept with red downward arrow, bar chart, and coins on financial market background. Business finance idea for expense control, budgeting, and profit management. Reduction cost decrease illustrations Cost Reduction Strategy with Financial Chart and Arrow 3d render. Cost reduction concept with red downward arrow, bar chart, and coins on financial market background. Business finance idea for expense control, budgeting, and profit management
Free with trial Cost reduction concept with red downward arrow, bar chart, and coins on financial market background. Business finance idea for expense control, budgeting, and profit management. Reduction cost decrease illustrations Cost Reduction Strategy with Financial Chart and Arrow 3d render. Cost reduction concept with red downward arrow, bar chart, and coins on financial market background. Business finance idea for expense control, budgeting, and profit management
Free with trial Cost reduction concept with red downward arrow, bar chart, and coins on financial market background. Business finance idea for expense control, budgeting, and profit management. Reduction cost decrease illustrations Cost Reduction Strategy with Financial Chart and Arrow 3d render. Cost reduction concept with red downward arrow, bar chart, and coins on financial market background. Business finance idea for expense control, budgeting, and profit management
Free with trial Cost reduction concept with red downward arrow, bar chart, and coins on financial market background. Business finance idea for expense control, budgeting, and profit management. Reduction cost decrease illustrations Cost Reduction Strategy with Financial Chart and Arrow 3d render. Cost reduction concept with red downward arrow, bar chart, and coins on financial market background. Business finance idea for expense control, budgeting, and profit management
Free with trial Cost reduction concept with red downward arrow, bar chart, and coins on financial market background. Business finance idea for expense control, budgeting, and profit management. Reduction cost decrease illustrations Cost Reduction Strategy with Financial Chart and Arrow 3d render. Cost reduction concept with red downward arrow, bar chart, and coins on financial market background. Business finance idea for expense control, budgeting, and profit management
Free with trial Cost reduction concept with red downward arrow, bar chart, and coins on financial market background. Business finance idea for expense control, budgeting, and profit management. Reduction cost decrease illustrations Cost Reduction Strategy with Financial Chart and Arrow 3d render. Cost reduction concept with red downward arrow, bar chart, and coins on financial market background. Business finance idea for expense control, budgeting, and profit management
Free with trial Cost reduction text with downward arrow and bar chart on neutral background. Business finance concept for expense control, budget management, savings strategy, and profit optimization. Reduction cost decrease illustrations Cost Reduction Concept with Downward Arrow and Bar Chart 3d render. Cost reduction text with downward arrow and bar chart on neutral background. Business finance concept for expense control, budget management, savings strategy, and profit optimization
Free with trial Cost reduction text with downward arrow and bar chart on neutral background. Business finance concept for expense control, budget management, savings strategy, and profit optimization. Reduction cost decrease illustrations Cost Reduction Concept with Downward Arrow and Bar Chart 3d render. Cost reduction text with downward arrow and bar chart on neutral background. Business finance concept for expense control, budget management, savings strategy, and profit optimization
Free with trial Cost reduction text with downward arrow and bar chart on neutral background. Business finance concept for expense control, budget management, savings strategy, and profit optimization. Reduction cost decrease illustrations Cost Reduction Concept with Downward Arrow and Bar Chart 3d render. Cost reduction text with downward arrow and bar chart on neutral background. Business finance concept for expense control, budget management, savings strategy, and profit optimization
Free with trial Cost reduction text with downward arrow and bar chart on neutral background. Business finance concept for expense control, budget management, savings strategy, and profit optimization. Reduction cost decrease illustrations Cost Reduction Concept with Downward Arrow and Bar Chart 3d render. Cost reduction text with downward arrow and bar chart on neutral background. Business finance concept for expense control, budget management, savings strategy, and profit optimization
Free with trial Cost reduction text with downward arrow and bar chart on neutral background. Business finance concept for expense control, budget management, savings strategy, and profit optimization. Reduction cost decrease illustrations Cost Reduction Concept with Downward Arrow and Bar Chart 3d render. Cost reduction text with downward arrow and bar chart on neutral background. Business finance concept for expense control, budget management, savings strategy, and profit optimization
Free with trial Cost reduction text with downward arrow and bar chart on neutral background. Business finance concept for expense control, budget management, savings strategy, and profit optimization. Reduction cost decrease illustrations Cost Reduction Concept with Downward Arrow and Bar Chart 3d render. Cost reduction text with downward arrow and bar chart on neutral background. Business finance concept for expense control, budget management, savings strategy, and profit optimization
Free with trial Cost reduction text with downward arrow and bar chart on neutral background. Business finance concept for expense control, budget management, savings strategy, and profit optimization. Reduction cost decrease illustrations Cost Reduction Concept with Downward Arrow and Bar Chart 3d render. Cost reduction text with downward arrow and bar chart on neutral background. Business finance concept for expense control, budget management, savings strategy, and profit optimization
Free with trial Cost reduction text with downward arrow and bar chart on neutral background. Business finance concept for expense control, budget management, savings strategy, and profit optimization. Reduction cost decrease illustrations Cost Reduction Concept with Downward Arrow and Bar Chart 3d render. Cost reduction text with downward arrow and bar chart on neutral background. Business finance concept for expense control, budget management, savings strategy, and profit optimization
Free with trial Cost reduction text with downward arrow and bar chart on neutral background. Business finance concept for expense control, budget management, savings strategy, and profit optimization. Reduction cost decrease illustrations Cost Reduction Concept with Downward Arrow and Bar Chart 3d render. Cost reduction text with downward arrow and bar chart on neutral background. Business finance concept for expense control, budget management, savings strategy, and profit optimization
Free with trial A hand placing a wooden block with a downward arrow and percentage sign on a table with blocks spelling 'COST', symbolizing a decrease in costs or expenses. Reduction cost decrease illustrations Cost percentage decrease concept. A hand placing a wooden block with a downward arrow and percentage sign on a table with blocks spelling 'COST', symbolizing a decrease in costs or expenses.
Free with trial Cost reduction business concept using wooden blocks spelling "COST" with red downward arrows. Clean, bright image on a white desk with blurred background offers copy space. Perfect for finance, business presentations, web banners, and marketing materials. Reduction cost decrease illustrations Cost Reduction Business Concept Wooden Blocks Stacked with Red Down Arrows on White Desk. Cost reduction business concept using wooden blocks spelling "COST" with red downward arrows. Clean, bright image on a white desk with blurred background offers copy space. Perfect for finance, business presentations, web banners, and marketing materials.
Free with trial This conceptual image visually represents cost management and financial reduction strategies. A human hand adjusts a slider featuring dollar and euro currency symbols, pointing towards a dial indicating decreasing values. On the right, a bar graph illustrates a clear downward trend in 'Cost' with a prominent arrow labeled 'Reduction,' emphasizing the goal of minimizing expenses. The monochrome blue-grey palette conveys professionalism and seriousness. Ideal for illustrating topics related to budgeting, financial planning, business efficiency, and economic optimization in corporate presentations, articles, and financial reports. Reduction cost decrease vectors Cost Management and Financial Reduction Strategy. This conceptual image visually represents cost management and financial reduction strategies. A human hand adjusts a slider featuring dollar and euro currency symbols, pointing towards a dial indicating decreasing values. On the right, a bar graph illustrates a clear downward trend in 'Cost' with a prominent arrow labeled 'Reduction,' emphasizing the goal of minimizing expenses. The monochrome blue-grey palette conveys professionalism and seriousness. Ideal for illustrating topics related to budgeting, financial planning, business efficiency, and economic optimization in corporate presentations, articles, and financial reports.
Free with trial Cost Reduction Icons Set with Editable Line Style. Vector Outline Illustration Collection. Reduction cost decrease vectors Cost Reduction Icons Set with Editable Line Style. Vector Outline Illustration Collection
Free with trial A simple and effective line graph illustrating the concept of debt reduction. The chart, on a clean white background, shows a green line trending downwards, representing a successful decrease in liabilities over time. A final red arrow emphasizes a significant or accelerated drop, symbolizing a successful financial strategy, cost-cutting, or achieving financial freedom. This vector illustration is perfect for presentations, articles, and infographics on personal or business finance, money management, and economic stability. Reduction cost decrease vectors Debt Reduction Concept Graph Showing Downward Trend. A simple and effective line graph illustrating the concept of debt reduction. The chart, on a clean white background, shows a green line trending downwards, representing a successful decrease in liabilities over time. A final red arrow emphasizes a significant or accelerated drop, symbolizing a successful financial strategy, cost-cutting, or achieving financial freedom. This vector illustration is perfect for presentations, articles, and infographics on personal or business finance, money management, and economic stability.
Free with trial Blue Cost reduction icon isolated on blue background. Minimalism concept. 3D render illustration. Reduction cost decrease illustrations Blue Cost reduction icon isolated on blue background. Minimalism concept. 3D render illustration
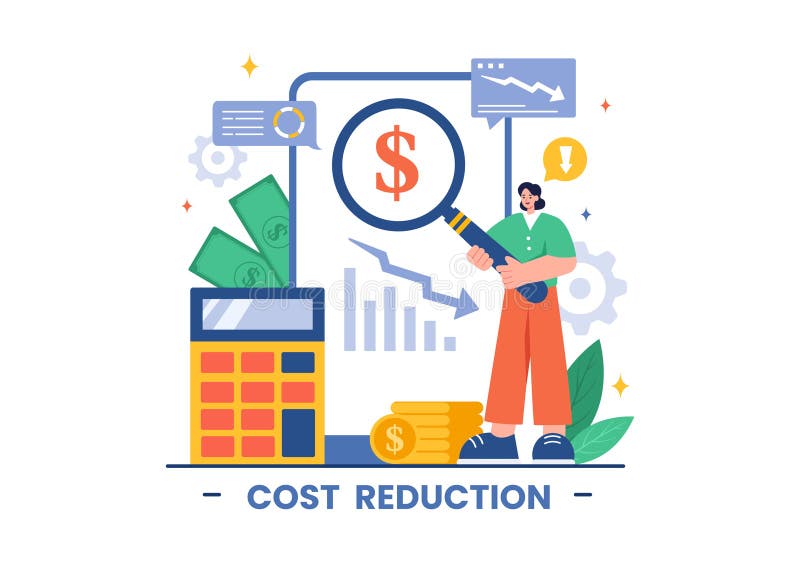
Free with trial A magnifying glass focuses on a dollar sign with a downward arrow, symbolizing cost reduction, economic downturn, or. Reduction cost decrease illustrations Cost Reduction Analysis Magnifying Glass on Downward Dollar. A magnifying glass focuses on a dollar sign with a downward arrow, symbolizing cost reduction, economic downturn, or.
Free with trial A businessman wearing a suit analyzes cost reduction versus quality improvement He uses both a laptop and a tablet computer to look at the data and see how these two factors interact to produce the best result for his company and business dealings shown with a graph of numbers going up and down. Reduction cost decrease illustrations Cost reduction and quality improvement shown with businessman analyzing data on devices. A businessman wearing a suit analyzes cost reduction versus quality improvement He uses both a laptop and a tablet computer to look at the data and see how these two factors interact to produce the best result for his company and business dealings shown with a graph of numbers going up and down
Free with trial A businessman interacts with a digital graph showcasing cost reduction through a declining trend. It symbolizes modern financial strategies and data-driven decision-making. XDMCP. Reduction cost decrease illustrations Businessman Presenting Digital Graph with Cost Reduction Concept, Showing Declining Trend in Expenses with Iconic. A businessman interacts with a digital graph. A businessman interacts with a digital graph showcasing cost reduction through a declining trend. It symbolizes modern financial strategies and data-driven decision-making. XDMCP
Free with trial Price drop icon. Cost reduction symbol. Oil value Vector. Cheap fuel. EPS 10. Reduction cost decrease vectors Price drop icon. Cost reduction symbol. Oil value Vector. Cheap fuel.
Free with trial Money increase and decrease icons. Low or high total cost icon. Price, sale, rate or profit going up or down symbol with arrow and dollar sign. Reduction cost decrease illustrations Money increase and decrease icons. Low or high total cost icon. Price, sale, rate or profit going up or down symbol