Free with trial Standard note values and rests in western music notation. The relative duration of a note and the interval of silence in a piece of music, marked by specific symbols. Illustration over white. Vector. Relative values vectors Standard note values and rests in music notation. Standard note values and rests in western music notation. The relative duration of a note and the interval of silence in a piece of music, marked by specific symbols. Illustration over white. Vector.
Free with trial Traditional values, bonding, family idyll concept. Parents spend time together with children, smiling mother, father, daughter and son sitting on sofa and hugging. Simple flat vector. Relative values vectors Traditional values, bonding, family idyll concept
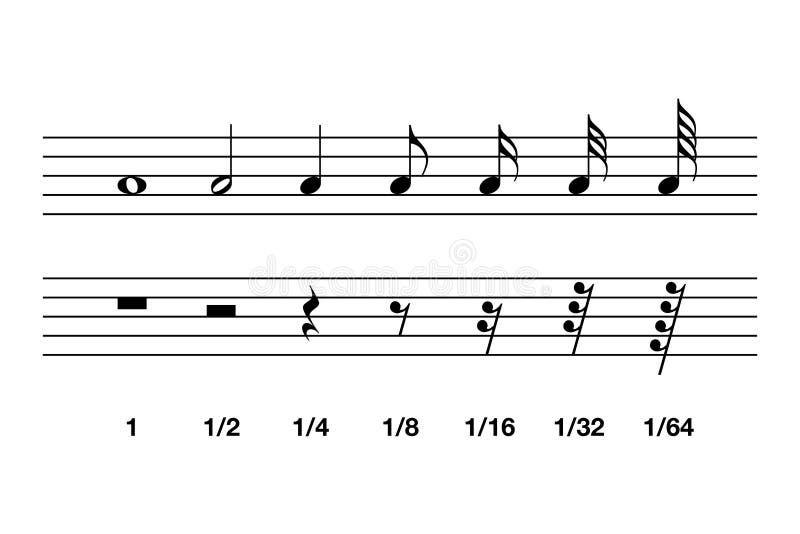
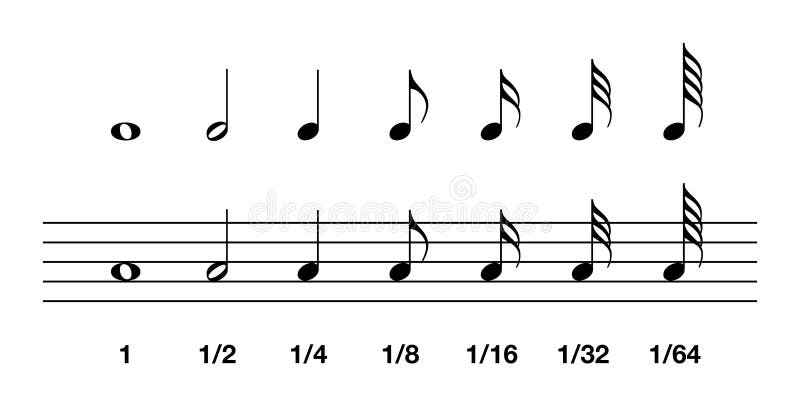
Free with trial Standard note values. Whole, half, quarter and eighth to sixty-fourth. In music notation, the note value indicates the relative duration of a note, using notehead, stem or flag. Illustration. Vector. Relative values vectors Standard note values in music notation. Standard note values. Whole, half, quarter and eighth to sixty-fourth. In music notation, the note value indicates the relative duration of a note, using notehead, stem or flag. Illustration. Vector.
Free with trial Hand holding mobile phone calling mom using smartphone. The concept of mother`s day and family values. love for parents. Vector flat design on a white background. Relative values vectors Hand holding mobile phone calling mom using smartphone. The concept of mother`s day and family values
Free with trial Fluctuations in the relative values of major currencies – golden Dollar and Euro symbols on polished wooden seesaw. Relative values illustrations Dollar and Euro on seesaw. Fluctuations in the relative values of major currencies – golden Dollar and Euro symbols on polished wooden seesaw.
Free with trial A minimalist logo symbolizing home and family, Create a minimalist logo for a charity dedicated to providing food assistance to families in need. Relative values vectors A minimalist logo symbolizing home and family, Create a minimalist logo for a charity dedicated to providing food assistance to
Free with trial A simple vector icon featuring multiple horizontal lines of varying lengths, symbolizing data, progress indicators, or status updates. This graphic is perfect for dashboards, analytics, or any design requiring a concise visual representation of quantitative information and relative values, vector design Generative AI. Relative values vectors Horizontal Lines Data Icon, Progress and Status, vector design Generative AI. A simple vector icon featuring multiple horizontal lines of varying lengths, symbolizing data, progress indicators, or status updates. This graphic is perfect for dashboards, analytics, or any design requiring a concise visual representation of quantitative information and relative values, vector design Generative AI
Free with trial The image displays a bar chart with three vertical bars of varying heights, representing different values in descending order. Next to it, a pie chart divides data into three segments, illustrating the same categories proportionally. The bar chart emphasizes differences in magnitude, while the pie chart shows the relative distribution of the same data set, aiding in visual data comparison and. Relative values illustrations Comparison of data through bar chart and pie chart visualizations isolated on white background. The image displays a bar chart with three vertical bars of varying heights, representing different values in descending order. Next to it, a pie chart divides data into three segments, illustrating the same categories proportionally. The bar chart emphasizes differences in magnitude, while the pie chart shows the relative distribution of the same data set, aiding in visual data comparison and
Free with trial A side-by-side comparison of a pie chart and a bar graph, illustrating data distribution and relative values across different categories for analysis. Relative values illustrations Comparative Analysis - Pie Chart and Bar Graph Visualization of Data. A side-by-side comparison of a pie chart and a bar graph, illustrating data distribution and relative values across different categories for analysis
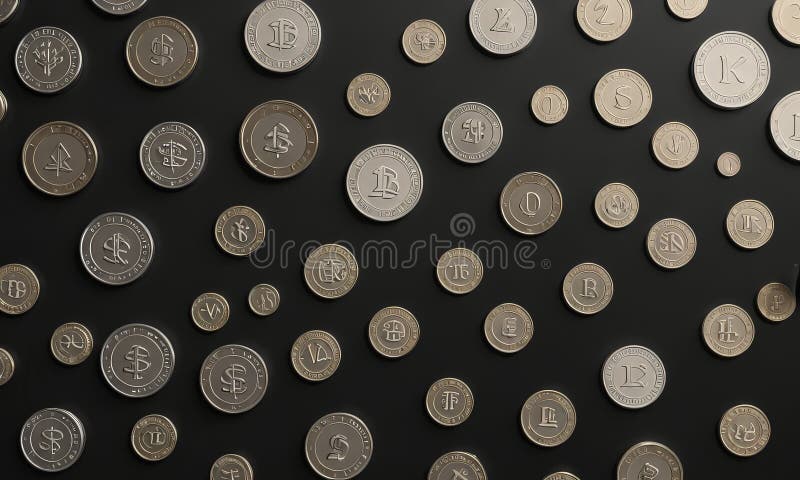
Free with trial The image shows a collection of coins arranged in a grid-like pattern against a black background. The coins vary in size, shape, and color, creating a visually striking contrast. The coins are not perfectly aligned, adding a sense of randomness and depth to the composition. The use of black and white colors, along with the dark background, gives the image a timeless and classic feel. The coins appear to be of different denominations, suggesting a diverse range of values and purposes. The image does not contain any discernible text or actions, and the relative positions of the coins to each other and the background remain constant, maintaining the grid-like pattern. The overall composition is balanced and harmonious, with the coins serving as the main subjects and the background providing a stark contrast. Relative values illustrations Collection various coins, including pennies, nickels, dimes, and quarters, arranged in grid-like pattern. The image shows a collection of coins arranged in a grid-like pattern against a black background. The coins vary in size, shape, and color, creating a visually striking contrast. The coins are not perfectly aligned, adding a sense of randomness and depth to the composition. The use of black and white colors, along with the dark background, gives the image a timeless and classic feel. The coins appear to be of different denominations, suggesting a diverse range of values and purposes. The image does not contain any discernible text or actions, and the relative positions of the coins to each other and the background remain constant, maintaining the grid-like pattern. The overall composition is balanced and harmonious, with the coins serving as the main subjects and the background providing a stark contrast.
Free with trial This image features an abstract and colorful business graph set against a calming blue background The graph depicts four cylindrical columns in different colors blue cyan yellow and pink These represent different values or metrics and their relative sizes suggest growth and progression A white curved line with colorful spheres representing data points archs over the columns symbolizing the trend. Relative values illustrations Abstract colorful business graph on a blue background representing growth and success. This image features an abstract and colorful business graph set against a calming blue background The graph depicts four cylindrical columns in different colors blue cyan yellow and pink These represent different values or metrics and their relative sizes suggest growth and progression A white curved line with colorful spheres representing data points archs over the columns symbolizing the trend
Free with trial Family tree mural illustrating values from past to present, sunset, colorful and detailed, heritage focus, GenerativeAI illustration. Relative values illustrations Family tree mural illustrating values from past to present, sunset, colorful and detailed, heritage focus
Free with trial The image features a majestic bald eagle, its head turned to the left, set against the backdrop of the American flag. The eagle is the central focus, with its white head and brown body contrasting sharply with the red, white, and blue of the flag. The flag is slightly blurred, adding a sense of depth and movement to the image. The colors and lighting create a patriotic and majestic atmosphere, with the eagle's sharp gaze and powerful presence commanding attention. The background is a simple, uncluttered blue, which further accentuates the eagle and the flag. The image does not contain any discernible text or other objects, and the relative positions of the eagle and the flag create a balanced composition. The overall mood of the image is one of pride, freedom, and strength, reflecting the values and spirit of the United States. Relative values illustrations Majestic bald eagle, with yellow beak and brown and white feathers, stands against backdrop the American. The image features a majestic bald eagle, its head turned to the left, set against the backdrop of the American flag. The eagle is the central focus, with its white head and brown body contrasting sharply with the red, white, and blue of the flag. The flag is slightly blurred, adding a sense of depth and movement to the image. The colors and lighting create a patriotic and majestic atmosphere, with the eagle's sharp gaze and powerful presence commanding attention. The background is a simple, uncluttered blue, which further accentuates the eagle and the flag. The image does not contain any discernible text or other objects, and the relative positions of the eagle and the flag create a balanced composition. The overall mood of the image is one of pride, freedom, and strength, reflecting the values and spirit of the United States.
Free with trial The image displays a bar chart alongside a pie chart representing the same data distribution. The bar chart shows three categories with varying heights, indicating different quantities, while the pie chart visually breaks down the same categories into proportional segments, illustrating their relative sizes within the whole. The largest segment in the pie chart corresponds to the tallest bar in. Relative values illustrations Comparison of data distribution through bar and pie charts isolated on white background. The image displays a bar chart alongside a pie chart representing the same data distribution. The bar chart shows three categories with varying heights, indicating different quantities, while the pie chart visually breaks down the same categories into proportional segments, illustrating their relative sizes within the whole. The largest segment in the pie chart corresponds to the tallest bar in
Free with trial Create a family for orphans. Family reunification and traditional values. Reuniting children with biological relatives. Experience love and security. Relative values illustrations Create a family for orphans. Family reunification and traditional values. Reuniting children with biological relatives
Free with trial Create a family for orphans. Family reunification and traditional values. Reuniting children with biological relatives. Experience love and security. Relative values illustrations Create a family for orphans. Family reunification and traditional values. Reuniting children with biological relatives
Free with trial Create a family for orphans. Family reunification and traditional values. Reuniting children with biological relatives. Experience love and security. Relative values illustrations Create a family for orphans. Family reunification and traditional values. Reuniting children with biological relatives
Free with trial Create a family for orphans. Family reunification and traditional values. Reuniting children with biological relatives. Experience love and security. Relative values illustrations Create a family for orphans. Family reunification and traditional values. Reuniting children with biological relatives
Free with trial Create a family for orphans. Family reunification and traditional values. Reuniting children with biological relatives. Experience love and security. Relative values illustrations Create a family for orphans. Family reunification and traditional values. Reuniting children with biological relatives
Free with trial A heartwarming cartoon illustration of a loving grandmother embracing her young grandson. The elderly woman with gray hair holds the little boy in a warm, tender hug, both with their eyes closed in a moment of peace and affection. A gentle yellow glow surrounds them, symbolizing their strong family bond and love. This charming vector art is perfect for concepts like family values, intergenerational relationships, childhood memories, senior care, and celebrating Grandparents' Day. Isolated on a light blue background. Relative values illustrations Grandmother and Grandson Loving Hug Illustration. A heartwarming cartoon illustration of a loving grandmother embracing her young grandson. The elderly woman with gray hair holds the little boy in a warm, tender hug, both with their eyes closed in a moment of peace and affection. A gentle yellow glow surrounds them, symbolizing their strong family bond and love. This charming vector art is perfect for concepts like family values, intergenerational relationships, childhood memories, senior care, and celebrating Grandparents' Day. Isolated on a light blue background.
Free with trial A world map infographic showing global economic data visualization. The continents are rendered in a light turquoise color with clean, simplified outlines. A zigzagging green upward-trending arrow cuts across the map from the bottom left to the top right, representing growth or increase. Below the map is a horizontal bar chart with multiple bars in varying shades of blue and turquoise. The bars are arranged in a descending pattern from left to right, showing different data values. The bars range from light blue to darker turquoise, creating a gradient effect. The entire image has a clean, minimalist design style with a white background. The continents are shown in their correct relative positions, with North America, South America, Africa, Europe, Asia, and Australia clearly visible. The image has a professional, business-focused aesthetic suitable for financial or economic presentations. Relative values vectors Global Economy Growth World Map Infographic. A world map infographic showing global economic data visualization. The continents are rendered in a light turquoise color with clean, simplified outlines. A zigzagging green upward-trending arrow cuts across the map from the bottom left to the top right, representing growth or increase. Below the map is a horizontal bar chart with multiple bars in varying shades of blue and turquoise. The bars are arranged in a descending pattern from left to right, showing different data values. The bars range from light blue to darker turquoise, creating a gradient effect. The entire image has a clean, minimalist design style with a white background. The continents are shown in their correct relative positions, with North America, South America, Africa, Europe, Asia, and Australia clearly visible. The image has a professional, business-focused aesthetic suitable for financial or economic presentations.
Free with trial This Family Solid Vector Glyph Icon Set featuring baby icon, family house, child rights, family tree, married couple, mother child, girl friends, and grandmother for social themes is a heartwarming and versatile collection of graphics representing human relationships and household life. The set includes essential icons for parenthood, childhood, and multi-generational connections, making it perfect for parenting blogs, community apps, and social service websites. The bold, solid design effectively communicates concepts of love, togetherness, and family support, providing a professional and compassionate look for any creative project. Use these high-quality vector graphics to enhance your social media content, family-themed presentations, and website UI, providing a consistent and high-quality visual representation of family values, household lifestyle, and community connection for a diverse global audience of parents, children, and social workers. Relative values vectors Family Solid Icon Set with Baby, House, Child Rights, Family Tree, Married Couple, and Mother. This Family Solid Vector Glyph Icon Set featuring baby icon. This Family Solid Vector Glyph Icon Set featuring baby icon, family house, child rights, family tree, married couple, mother child, girl friends, and grandmother for social themes is a heartwarming and versatile collection of graphics representing human relationships and household life. The set includes essential icons for parenthood, childhood, and multi-generational connections, making it perfect for parenting blogs, community apps, and social service websites. The bold, solid design effectively communicates concepts of love, togetherness, and family support, providing a professional and compassionate look for any creative project. Use these high-quality vector graphics to enhance your social media content, family-themed presentations, and website UI, providing a consistent and high-quality visual representation of family values, household lifestyle, and community connection for a diverse global audience of parents, children, and social workers.
Free with trial A cartoon businessman in a suit presents a colorful bar graph with three categories: Sanues, Magles, and Corels. The graph shows the relative values of each category with blue, green, and red bars respectively. The image conveys a sense of business presentation, data analysis, and financial reporting. It can be used for illustrating business concepts, marketing strategies, or educational materials. Relative values illustrations Cartoon Businessman Presenting Bar Graph. A cartoon businessman in a suit presents a colorful bar graph with three categories: Sanues, Magles, and Corels. The graph shows the relative values of each category with blue, green, and red bars respectively. The image conveys a sense of business presentation, data analysis, and financial reporting. It can be used for illustrating business concepts, marketing strategies, or educational materials.
Free with trial This cheerful illustration features diverse parents and children holding hands together in a community setting, highlighting unity and happiness, Rendered by Ai. This vibrant digital artwork is perfect for educational or promotional materials emphasizing family values and diversity, Rendered by Ai. Relative values vectors Diverse Families Holding Hands Illustration. This cheerful illustration features diverse parents and children holding hands together in a community setting, highlighting unity and happiness, Rendered by Ai. This vibrant digital artwork is perfect for educational or promotional materials emphasizing family values and diversity, Rendered by Ai
Free with trial Standard atomic weight on blue background. Relative values illustrations Standard atomic weight on blue
Free with trial A pink piggy bank and a blue bitcoin coin are placed on opposite ends of a yellow seesaw, with a gold coin hovering above the piggy bank. The image symbolizes the comparison between traditional saving methods and cryptocurrency, highlighting their relative values or growth. Relative values illustrations Piggy bank and bitcoin on a seesaw. A pink piggy bank and a blue bitcoin coin are placed on opposite ends of a yellow seesaw, with a gold coin hovering above the piggy bank. The image symbolizes the comparison between traditional saving methods and cryptocurrency, highlighting their relative values or growth.
Free with trial Close-up of hands writing family on wood. Generative AI. Relative values illustrations Hands writing family on wooden board. Close-up of hands writing family on wood. Generative AI
Free with trial A symbolic image featuring a classic balance scale held by hands, with a decorative key on one side and a gold coin on the other. The key represents access, opportunity, or secrets, while the coin signifies wealth, value, or investment. The composition suggests a comparison of values, highlighting concepts like financial decisions, security, or the relative importance of different assets. The blurred background adds a sense of depth and focus. Relative values illustrations Weighing the Value: Key vs. Coin on Scales. A symbolic image featuring a classic balance scale held by hands, with a decorative key on one side and a gold coin on the other. The key represents access, opportunity, or secrets, while the coin signifies wealth, value, or investment. The composition suggests a comparison of values, highlighting concepts like financial decisions, security, or the relative importance of different assets. The blurred background adds a sense of depth and focus.
Free with trial The image displays a bar chart consisting of four vertical bars in different colors: yellow, orange, red, and blue. The red bar is the tallest, indicating the highest value, while the orange bar is the shortest. The yellow and blue bars are of medium height, with yellow being slightly taller than blue. The chart visually compares the relative values of these four categories. Relative values illustrations Colorful bar chart comparison with varying heights and distinct colors. The image displays a bar chart consisting of four vertical bars in different colors: yellow, orange, red, and blue. The red bar is the tallest, indicating the highest value, while the orange bar is the shortest. The yellow and blue bars are of medium height, with yellow being slightly taller than blue. The chart visually compares the relative values of these four categories
Free with trial The word \'Family\' in a white background. International Day of Families, celebrated on May 15th. Relative values illustrations The word \'Family\' in a white background. International Day of Families, celebrated on May 15th
Free with trial The word \'Family\' in a white background. International Day of Families, celebrated on May 15th. Relative values illustrations The word \'Family\' in a white background. International Day of Families, celebrated on May 15th
Free with trial The word \'Family\' in a white background. International Day of Families, celebrated on May 15th. Relative values illustrations The word \'Family\' in a white background. International Day of Families, celebrated on May 15th
Free with trial The word \'Family\' in a white background. International Day of Families, celebrated on May 15th. Relative values illustrations The word \'Family\' in a white background. International Day of Families, celebrated on May 15th
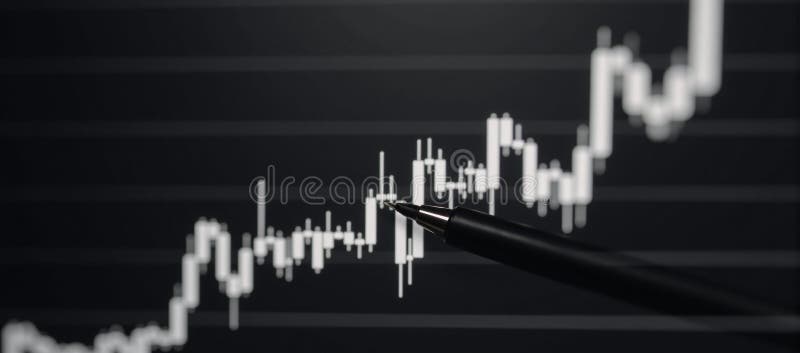
Free with trial Concept Of Uptrend line graph candlesticks displayed on an abstract finance chart with BW backdrop. Relative values illustrations Uptrend line graph candlesticks displayed on an abstract finance chart with BW backdrop
Free with trial Human chorionic gonadotropin level during pregnancy. HCG in the woman body, maximum and minimum values infographic. Female hormones changes from the first weeks to the delivery vector illustration. Relative values vectors Hormones in pregnancy. Human chorionic gonadotropin level during pregnancy. HCG in the woman body, maximum and minimum values infographic. Female hormones changes from the first weeks to the delivery vector illustration
Free with trial Prolactin graphic diagram in the woman body. PRL and lactation during postpartum. Produce of milk in female body infographic chart maximum and minimum values isolated medical flat vector illustration. Relative values vectors Hormones in pregnancy. Prolactin graphic diagram in the woman body. PRL and lactation during postpartum. Produce of milk in female body infographic chart maximum and minimum values isolated medical flat vector illustration
Free with trial Human chorionic gonadotropin level during pregnancy. HCG in the woman body, maximum and minimum values infographic. Female hormones changes from the first weeks to the delivery vector illustration. Relative values vectors Hormones in pregnancy. Human chorionic gonadotropin level during pregnancy. HCG in the woman body, maximum and minimum values infographic. Female hormones changes from the first weeks to the delivery vector illustration
Free with trial A heartwarming illustration depicts a multi-generational family portrait. The image features a smiling elderly couple, presumably grandparents, surrounded by their grandchildren. The children are depicted with cheerful expressions and embrace each other. The scene conveys themes of love, family bonds, togetherness, and happiness. This image is suitable for use in educational materials, family-themed projects, greeting cards, and advertising campaigns promoting family values. Relative values illustrations Happy Family Portrait: Grandparents and Grandchildren. A heartwarming illustration depicts a multi-generational family portrait. The image features a smiling elderly couple, presumably grandparents, surrounded by their grandchildren. The children are depicted with cheerful expressions and embrace each other. The scene conveys themes of love, family bonds, togetherness, and happiness. This image is suitable for use in educational materials, family-themed projects, greeting cards, and advertising campaigns promoting family values.
Free with trial This captivating macro close-up showcases a vibrant one-third section of a pie chart. The intense focus reveals the rich color palette used to represent different data categories, offering a striking visual representation of numerical information. The detailed texture of the chart's surface, from the smooth gradients to the subtle shading, emphasizes the meticulous design behind the data. Relative values illustrations Intriguing Data Insights A Detailed CloseUp of a Colorful OneThird Pie Chart Section Highlighting Data Visualization. This captivating macro close-up showcases a vibrant one-third section of a pie chart. The intense focus reveals the rich color palette used to represent different data categories, offering a striking visual representation of numerical information. The detailed texture of the chart's surface, from the smooth gradients to the subtle shading, emphasizes the meticulous design behind the data
Free with trial Concept Of Uptrend line graph candlesticks displayed on an abstract finance chart with BW backdrop. Relative values illustrations Uptrend line graph candlesticks displayed on an abstract finance chart with BW backdrop
Free with trial Concept Of Uptrend line graph candlesticks displayed on an abstract finance chart with BW backdrop. Relative values illustrations Uptrend line graph candlesticks displayed on an abstract finance chart with BW backdrop
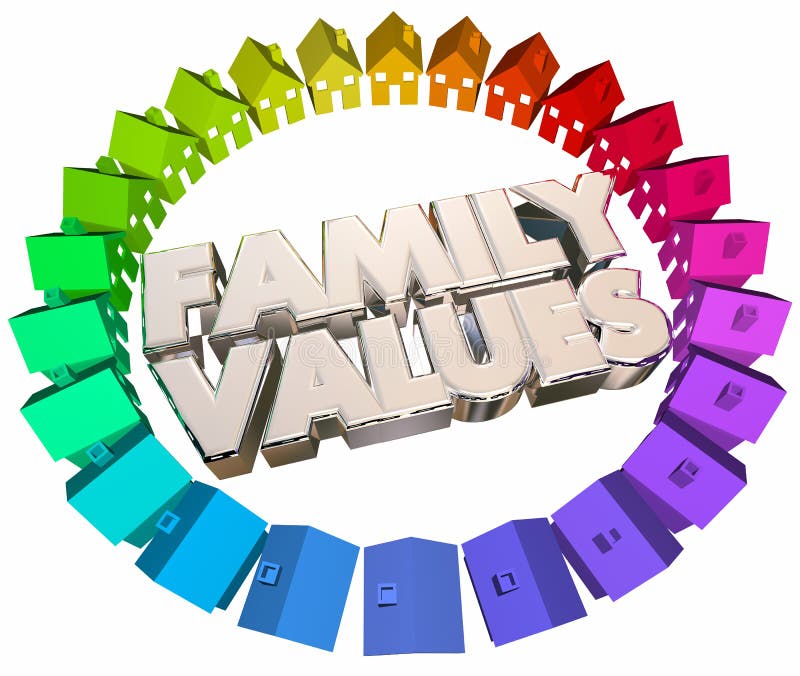
Free with trial Family Values Religious Beliefs Homes Houses Words 3d Illustration. Relative values illustrations Family Values Religious Beliefs Homes Houses Words
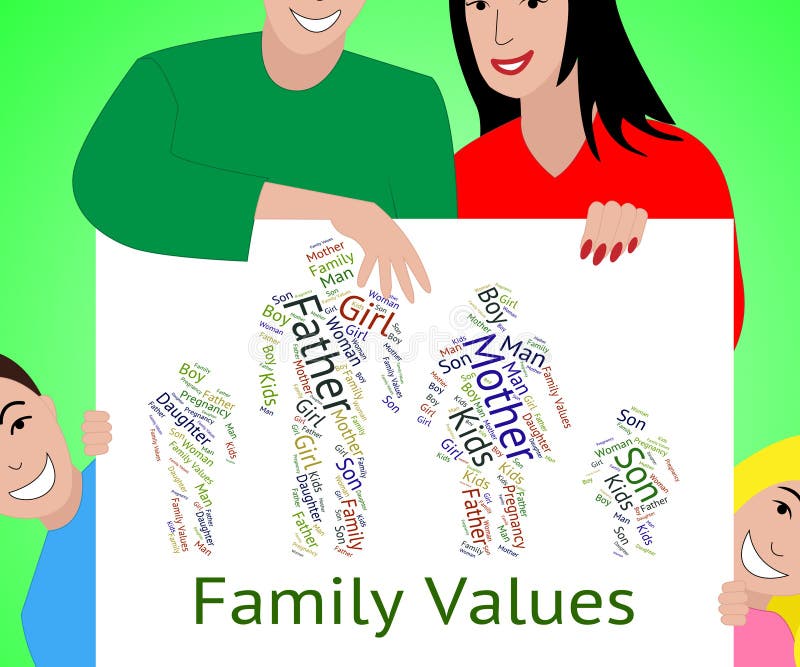
Free with trial Family Values Indicating Blood Relative And Standards. Relative values illustrations Family Values Shows Blood Relation And Children. Family Values Indicating Blood Relative And Standards
Free with trial Family relations and values. A set of characters of the family members. Children s drawings on paper with inscriptions. Vector illustration. Relative values illustrations Family relations and values. A set of characters of the family members. Children s drawings on paper with inscriptions. Vector ill
Free with trial Hand holding a mobile phone. A video call on a smartphone to his father. The concept of family values and love for parents. vector flat design on a white background. Relative values vectors Hand holding a mobile phone. A video call on a smartphone to his father. The concept of family values and love for parents
Free with trial Hand holding a mobile phone. A video call on a smartphone to his father. The concept of family values and love for parents. vector flat design on a white background. Relative values vectors Hand holding a mobile phone. A video call on a smartphone to his father. The concept of family values and love for parents
Free with trial Hand holding mobile phone calling mom using smartphone. The concept of mother`s day and family values. love for parents. Vector flat design on a white background. Relative values vectors Hand holding mobile phone calling mom using smartphone. The concept of mother`s day and family values
Free with trial The word FAMILY concept written in colorful retro shapes and colors illustration. Relative values vectors Family Concept Retro Colorful Word Art Illustration. The word FAMILY concept written in colorful retro shapes and colors illustration
Free with trial The word FAMILY written in colorful abstract word art on a vibrant background. Vector EPS 10 available. Relative values vectors Family Concept Colorful Word Art Illustration. The word FAMILY written in colorful abstract word art on a vibrant background. Vector EPS 10 available.
Free with trial The word FAMILY concept written in colorful abstract typography. Vector EPS 10 available. Relative values vectors Family Concept Word Art Illustration. The word FAMILY concept written in colorful abstract typography. Vector EPS 10 available.
Free with trial The word FAMILY concept printed in letterpress hand stamped colorful grunge paint and ink. Vector EPS 10 available. Relative values vectors Family Concept Stamped Word Art Illustration. The word FAMILY concept printed in letterpress hand stamped colorful grunge paint and ink. Vector EPS 10 available.
Free with trial Family Matters People Relatives Relationships 3d Illustration. Relative values illustrations Family Matters People Relatives Relationships
Free with trial The word FAMILY concept written in colorful abstract typography. Vector EPS 10 available. Relative values vectors Family Concept Word Art Illustration. The word FAMILY concept written in colorful abstract typography. Vector EPS 10 available.
Free with trial The word FAMILY concept written in colorful abstract typography. Vector EPS 10 available. Relative values vectors Family Concept Word Art Illustration. The word FAMILY concept written in colorful abstract typography. Vector EPS 10 available.
Free with trial FAMILY IS FOREVER-the inscription about the foster care. Handwritten lettering desigh. Motivation text. Perfect for poster, postcard, card, banner, lettering typography. Vector illustration EPS 10. Relative values illustrations FAMILY IS FOREVER
Free with trial I LOVE MY FAMILY-the inscription about the foster care. Handwritten lettering desigh. Motivation text. Perfect for poster, postcard, card, banner, lettering typography. Vector illustration EPS 10. Relative values illustrations I LOVE MY FAMILY, LETTERING. I LOVE MY FAMILY-the inscription about the foster care. Handwritten lettering desigh.Motivation text.Perfect for poster, postcard, card, banner, lettering typography.Vector illustration EPS 10
Free with trial Christmas Eve Family Dinner, New Year Celebration Traditions Trendy Flat Vector Concept. Parents with Little Children Sitting at Holiday Table at Home Living Room, Eating Tasty Dishes Illustration. Relative values vectors Christmas Eve Family Dinner Flat Vector Concept. Christmas Eve Family Dinner, New Year Celebration Traditions Trendy Flat Vector Concept. Parents with Little Children Sitting at Holiday Table at Home Living Room, Eating Tasty Dishes Illustration
Free with trial HAPPY FAMILYS DAY-the inscription about the foster care. Handwritten lettering desigh. Motivation text. Perfect for poster, postcard, card, banner, lettering typography. Vector illustration EPS 10. Relative values illustrations HAPPY FAMILYS DAY
Free with trial Lactation infographics. Prolactin level in the woman body, hormonal changes during postpartum days. Produce of milk in the female body. Infographic chart maximum and minimum values vector illustration. Relative values vectors Hormones in pregnancy. Lactation infographics. Prolactin level in the woman body, hormonal changes during postpartum days. Produce of milk in the female body. Infographic chart maximum and minimum values vector illustration
Free with trial Human chorionic gonadotropin level during pregnancy. HCG in the woman body, maximum and minimum values infographic. Female hormones changes from the first weeks to the delivery vector illustration. Relative values vectors Hormones in pregnancy. Human chorionic gonadotropin level during pregnancy. HCG in the woman body, maximum and minimum values infographic. Female hormones changes from the first weeks to the delivery vector illustration
Free with trial Human chorionic gonadotropin level during pregnancy. HCG in the woman body, maximum and minimum values infographic. Female hormones changes from the first weeks to the delivery vector illustration. Relative values vectors Hormones in pregnancy. Human chorionic gonadotropin level during pregnancy. HCG in the woman body, maximum and minimum values infographic. Female hormones changes from the first weeks to the delivery vector illustration
Free with trial Human chorionic gonadotropin level during pregnancy. HCG in the woman body, maximum and minimum values infographic. Female hormones changes from the first weeks to the delivery vector illustration. Relative values vectors Hormones in pregnancy. Human chorionic gonadotropin level during pregnancy. HCG in the woman body, maximum and minimum values infographic. Female hormones changes from the first weeks to the delivery vector illustration
Free with trial Human chorionic gonadotropin level during pregnancy. HCG in the woman body, maximum and minimum values infographic. Female hormones changes from the first weeks to the delivery vector illustration. Relative values vectors Hormones in pregnancy. Human chorionic gonadotropin level during pregnancy. HCG in the woman body, maximum and minimum values infographic. Female hormones changes from the first weeks to the delivery vector illustration
Free with trial Prolactin graphic diagram in the woman body. PRL and lactation during postpartum. Produce of milk in female body infographic chart maximum and minimum values isolated medical flat vector illustration. Relative values vectors Hormones in pregnancy. Prolactin graphic diagram in the woman body. PRL and lactation during postpartum. Produce of milk in female body infographic chart maximum and minimum values isolated medical flat vector illustration
Free with trial Prolactin graphic diagram in the woman body. PRL and lactation during postpartum. Produce of milk in female body infographic chart maximum and minimum values isolated medical flat vector illustration. Relative values vectors Hormones in pregnancy. Prolactin graphic diagram in the woman body. PRL and lactation during postpartum. Produce of milk in female body infographic chart maximum and minimum values isolated medical flat vector illustration
Free with trial Prolactin graphic diagram in the woman body. PRL and lactation during postpartum. Produce of milk in female body infographic chart maximum and minimum values isolated medical flat vector illustration. Relative values vectors Hormones in pregnancy. Prolactin graphic diagram in the woman body. PRL and lactation during postpartum. Produce of milk in female body infographic chart maximum and minimum values isolated medical flat vector illustration
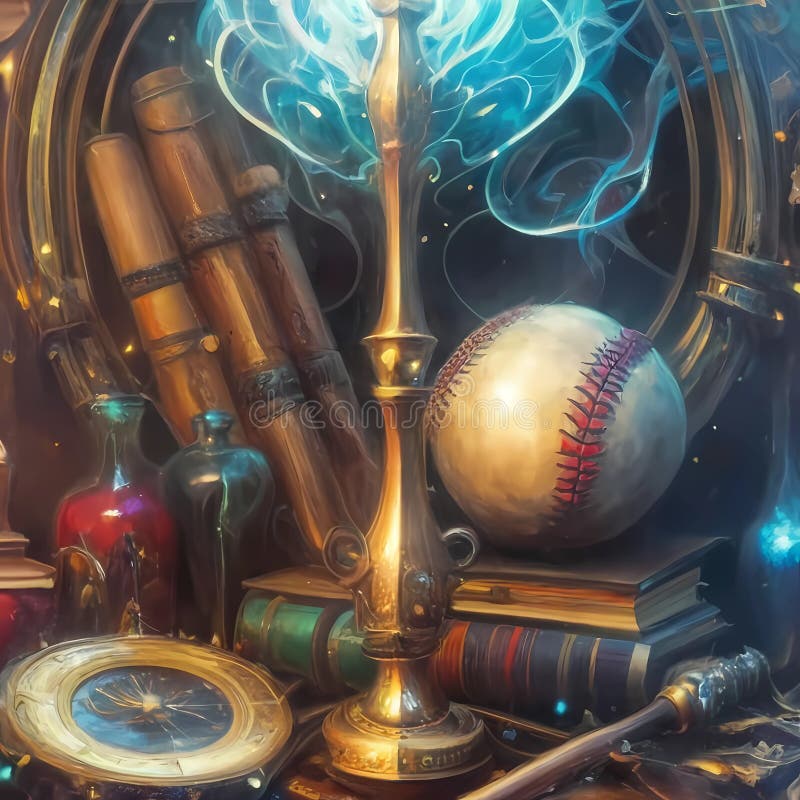
Free with trial Generating an image of a baseball and a wooden bat using AI involves training a model to understand the characteristics of baseballs and bats and then generating images that combine these elements realistically. Here's a simplified approach using Generative Adversarial Networks (GANs): Data Collection: Gather a dataset of images containing baseballs and wooden bats. Ensure that the images are diverse and cover different angles, lighting conditions, and variations of both the baseballs and bats. Preprocessing: Resize all images to a uniform size and format. Normalize the pixel values if required. Model Training: Train a GAN model on the preprocessed dataset. The GAN consists of a generator network that generates images and a discriminator network that tries to distinguish between real and fake images. Generating Images: Once the model is trained, use the generator network to generate images of baseballs and bats. You may need to provide some input to the generator network to control the features of the generated images, such as the size and position of the baseball relative to the bat. Relative values illustrations Baseball and wooden bat AI generated. Generating an image of a baseball and a wooden bat using AI involves training a model to understand the characteristics of baseballs and bats and then generating images that combine these elements realistically. Here's a simplified approach using Generative Adversarial Networks (GANs): Data Collection: Gather a dataset of images containing baseballs and wooden bats. Ensure that the images are diverse and cover different angles, lighting conditions, and variations of both the baseballs and bats. Preprocessing: Resize all images to a uniform size and format. Normalize the pixel values if required. Model Training: Train a GAN model on the preprocessed dataset. The GAN consists of a generator network that generates images and a discriminator network that tries to distinguish between real and fake images. Generating Images: Once the model is trained, use the generator network to generate images of baseballs and bats. You may need to provide some input to the generator network to control the features of the generated images, such as the size and position of the baseball relative to the bat.
Free with trial Generating an image of a baseball and a wooden bat using AI involves training a model to understand the characteristics of baseballs and bats and then generating images that combine these elements realistically. Here's a simplified approach using Generative Adversarial Networks (GANs): Data Collection: Gather a dataset of images containing baseballs and wooden bats. Ensure that the images are diverse and cover different angles, lighting conditions, and variations of both the baseballs and bats. Preprocessing: Resize all images to a uniform size and format. Normalize the pixel values if required. Model Training: Train a GAN model on the preprocessed dataset. The GAN consists of a generator network that generates images and a discriminator network that tries to distinguish between real and fake images. Generating Images: Once the model is trained, use the generator network to generate images of baseballs and bats. You may need to provide some input to the generator network to control the features of the generated images, such as the size and position of the baseball relative to the bat. Relative values illustrations Baseball and wooden bat AI generated. Generating an image of a baseball and a wooden bat using AI involves training a model to understand the characteristics of baseballs and bats and then generating images that combine these elements realistically. Here's a simplified approach using Generative Adversarial Networks (GANs): Data Collection: Gather a dataset of images containing baseballs and wooden bats. Ensure that the images are diverse and cover different angles, lighting conditions, and variations of both the baseballs and bats. Preprocessing: Resize all images to a uniform size and format. Normalize the pixel values if required. Model Training: Train a GAN model on the preprocessed dataset. The GAN consists of a generator network that generates images and a discriminator network that tries to distinguish between real and fake images. Generating Images: Once the model is trained, use the generator network to generate images of baseballs and bats. You may need to provide some input to the generator network to control the features of the generated images, such as the size and position of the baseball relative to the bat.
Free with trial Generating an image of a baseball and a wooden bat using AI involves training a model to understand the characteristics of baseballs and bats and then generating images that combine these elements realistically. Here's a simplified approach using Generative Adversarial Networks (GANs): Data Collection: Gather a dataset of images containing baseballs and wooden bats. Ensure that the images are diverse and cover different angles, lighting conditions, and variations of both the baseballs and bats. Preprocessing: Resize all images to a uniform size and format. Normalize the pixel values if required. Model Training: Train a GAN model on the preprocessed dataset. The GAN consists of a generator network that generates images and a discriminator network that tries to distinguish between real and fake images. Generating Images: Once the model is trained, use the generator network to generate images of baseballs and bats. You may need to provide some input to the generator network to control the features of the generated images, such as the size and position of the baseball relative to the bat. Relative values illustrations Baseball and wooden bat AI generated. Generating an image of a baseball and a wooden bat using AI involves training a model to understand the characteristics of baseballs and bats and then generating images that combine these elements realistically. Here's a simplified approach using Generative Adversarial Networks (GANs): Data Collection: Gather a dataset of images containing baseballs and wooden bats. Ensure that the images are diverse and cover different angles, lighting conditions, and variations of both the baseballs and bats. Preprocessing: Resize all images to a uniform size and format. Normalize the pixel values if required. Model Training: Train a GAN model on the preprocessed dataset. The GAN consists of a generator network that generates images and a discriminator network that tries to distinguish between real and fake images. Generating Images: Once the model is trained, use the generator network to generate images of baseballs and bats. You may need to provide some input to the generator network to control the features of the generated images, such as the size and position of the baseball relative to the bat.
Free with trial Generating an image of a baseball and a wooden bat using AI involves training a model to understand the characteristics of baseballs and bats and then generating images that combine these elements realistically. Here's a simplified approach using Generative Adversarial Networks (GANs): Data Collection: Gather a dataset of images containing baseballs and wooden bats. Ensure that the images are diverse and cover different angles, lighting conditions, and variations of both the baseballs and bats. Preprocessing: Resize all images to a uniform size and format. Normalize the pixel values if required. Model Training: Train a GAN model on the preprocessed dataset. The GAN consists of a generator network that generates images and a discriminator network that tries to distinguish between real and fake images. Generating Images: Once the model is trained, use the generator network to generate images of baseballs and bats. You may need to provide some input to the generator network to control the features of the generated images, such as the size and position of the baseball relative to the bat. Relative values illustrations Baseball and wooden bat AI generated. Generating an image of a baseball and a wooden bat using AI involves training a model to understand the characteristics of baseballs and bats and then generating images that combine these elements realistically. Here's a simplified approach using Generative Adversarial Networks (GANs): Data Collection: Gather a dataset of images containing baseballs and wooden bats. Ensure that the images are diverse and cover different angles, lighting conditions, and variations of both the baseballs and bats. Preprocessing: Resize all images to a uniform size and format. Normalize the pixel values if required. Model Training: Train a GAN model on the preprocessed dataset. The GAN consists of a generator network that generates images and a discriminator network that tries to distinguish between real and fake images. Generating Images: Once the model is trained, use the generator network to generate images of baseballs and bats. You may need to provide some input to the generator network to control the features of the generated images, such as the size and position of the baseball relative to the bat.
Free with trial FAMILY-the inscription about the foster care. Handwritten lettering desigh. Motivation text. Perfect for poster, postcard, card, banner, lettering typography. Vector illustration EPS 10. Relative values illustrations FAMILY
Free with trial Lactation infographics. Prolactin level in the woman body, hormonal changes during postpartum days. Produce of milk in the female body. Infographic chart maximum and minimum values vector illustration. Relative values vectors Hormones in pregnancy. Lactation infographics. Prolactin level in the woman body, hormonal changes during postpartum days. Produce of milk in the female body. Infographic chart maximum and minimum values vector illustration
Free with trial Lovely family relationship RGB color icon. Parenthood values. Happy childhood. Parenting life. Isolated vector illustration. Simple filled line drawing. Editable stroke. Arial font used. Relative values vectors Lovely family relationship RGB color icon
Free with trial Tags cloud of protein. Words collage. 3D rendering. Relative values illustrations Silhouette of a male head and nutrition relative tags cloud. Tags cloud of protein. Words collage. 3D rendering