Free with trial A glowing red zigzag arrow points downward, representing a decline on a digital financial chart. The surface is gridded and dark, highlighting the red of the arrow. The arrow has a neon-like appearance and reflects off the glossy surface, signaling a decrease in value. The surrounding chart includes descending graphical elements indicating fluctuating data, conveying a downturn in financial performance or market trends. Sale decrease graphic illustrations A large red arrow points downwards over a gridded financial chart showing a sharp decline in value. A glowing red zigzag arrow points downward, representing a decline on a digital financial chart. The surface is gridded and dark, highlighting the red of the arrow. The arrow has a neon-like appearance and reflects off the glossy surface, signaling a decrease in value. The surrounding chart includes descending graphical elements indicating fluctuating data, conveying a downturn in financial performance or market trends.
Free with trial Set line Global economic crisis Dollar rate decrease Hanging sign with Sale Drop crude oil price Money bag Gold bars and icon. Vector. Sale decrease graphic vectors Set line Global economic crisis, Dollar rate decrease, Hanging sign with Sale, Drop crude oil price, Money bag, Gold. Set line Global economic crisis Dollar rate decrease Hanging sign with Sale Drop crude oil price Money bag Gold bars and icon. Vector.
Free with trial Set line Hanging sign with Sale, Drop crude oil price and Dollar rate decrease. Business infographic template. Vector. Sale decrease graphic illustrations Set line Hanging sign with Sale, Drop crude oil price and Dollar rate decrease. Business infographic template. Vector
Free with trial A glowing red zigzag arrow points downward, representing a decline on a digital financial chart. The surface is gridded and dark, highlighting the red of the arrow. The arrow has a neon-like appearance and reflects off the glossy surface, signaling a decrease in value. The surrounding chart includes descending graphical elements indicating fluctuating data, conveying a downturn in financial performance or market trends. Sale decrease graphic illustrations A large red arrow points downwards over a gridded financial chart showing a sharp decline in value. A glowing red zigzag arrow points downward, representing a decline on a digital financial chart. The surface is gridded and dark, highlighting the red of the arrow. The arrow has a neon-like appearance and reflects off the glossy surface, signaling a decrease in value. The surrounding chart includes descending graphical elements indicating fluctuating data, conveying a downturn in financial performance or market trends.
Free with trial A glowing red zigzag arrow points downward, representing a decline on a digital financial chart. The surface is gridded and dark, highlighting the red of the arrow. The arrow has a neon-like appearance and reflects off the glossy surface, signaling a decrease in value. The surrounding chart includes descending graphical elements indicating fluctuating data, conveying a downturn in financial performance or market trends. Sale decrease graphic illustrations A large red arrow points downwards over a gridded financial chart showing a sharp decline in value. A glowing red zigzag arrow points downward, representing a decline on a digital financial chart. The surface is gridded and dark, highlighting the red of the arrow. The arrow has a neon-like appearance and reflects off the glossy surface, signaling a decrease in value. The surrounding chart includes descending graphical elements indicating fluctuating data, conveying a downturn in financial performance or market trends.
Free with trial A glowing red zigzag arrow points downward, representing a decline on a digital financial chart. The surface is gridded and dark, highlighting the red of the arrow. The arrow has a neon-like appearance and reflects off the glossy surface, signaling a decrease in value. The surrounding chart includes descending graphical elements indicating fluctuating data, conveying a downturn in financial performance or market trends. Sale decrease graphic illustrations A large red arrow points downwards over a gridded financial chart showing a sharp decline in value,. A glowing red zigzag arrow points downward, representing a. A glowing red zigzag arrow points downward, representing a decline on a digital financial chart. The surface is gridded and dark, highlighting the red of the arrow. The arrow has a neon-like appearance and reflects off the glossy surface, signaling a decrease in value. The surrounding chart includes descending graphical elements indicating fluctuating data, conveying a downturn in financial performance or market trends.
Free with trial Set Arrow, Dollar symbol, Mountains with flag, Unknown search, Pie chart infographic, and Layers icon. Vector. Sale decrease graphic vectors Set Arrow, Dollar symbol, Mountains with flag, Unknown search, Pie chart infographic, and Layers icon. Vector
Free with trial Sale Decrease Graphic icon. Mobile app, printing, web site icon. Simple element sing. Monochrome Sale Decrease Graphic icon illustration. Sale decrease graphic illustrations Sale Decrease Graphic icon. Mobile app, printing, web site icon. Simple element sing. Monochrome Sale Decrease Graphic icon illust
Free with trial Sale Decrease Graphic icon. Monochrome style design from diagram collection. UI. Pixel perfect simple pictogram sale decrease graphic icon. Web design, apps, software, print usage. Sale decrease graphic illustrations Sale Decrease Graphic icon. Monochrome style design from diagram icon collection. UI. Pixel perfect simple pictogram sale decrease. Sale Decrease Graphic icon. Monochrome style design from diagram collection. UI. Pixel perfect simple pictogram sale decrease graphic icon. Web design, apps, software, print usage.
Free with trial Sale Decrease Graphic icon. Mobile app, printing, web site icon. Simple element sing. Monochrome Sale Decrease Graphic icon illustration. Sale decrease graphic vectors Sale Decrease Graphic icon. Mobile app, printing, web site icon. Simple element sing. Monochrome Sale Decrease Graphic
Free with trial Sale Decrease Graphic icon. Monochrome style design from diagram collection. UI. Pixel perfect simple pictogram sale decrease graphic icon. Web design, apps, software, print usage. Sale decrease graphic illustrations Sale Decrease Graphic icon. Monochrome style design from diagram icon collection. UI. Pixel perfect simple pictogram sale decrease. Sale Decrease Graphic icon. Monochrome style design from diagram collection. UI. Pixel perfect simple pictogram sale decrease graphic icon. Web design, apps, software, print usage.
Free with trial Sale Decrease Graphic icon. Mobile app, printing, web site icon. Simple element sing. Monochrome Sale Decrease Graphic icon illustration. Sale decrease graphic illustrations Sale Decrease Graphic icon. Mobile app, printing, web site icon. Simple element sing. Monochrome Sale Decrease Graphic icon illust
Free with trial Cost reduction icon dollar. Price decrease arrow symbol. business sale sign illustration. Sale decrease graphic vectors Cost reduction icon dollar. Price decrease arrow symbol. business sale sign illustration
Free with trial Cost reduction icon dollar. Price decrease arrow symbol. business sale sign illustration. Sale decrease graphic vectors Cost reduction icon dollar. Price decrease arrow symbol. business sale sign illustration
Free with trial Cost reduction icon dollar. Price decrease arrow symbol. business sale sign illustration. Sale decrease graphic vectors Cost reduction icon dollar. Price decrease arrow symbol. business sale sign illustration
Free with trial Sale, discounts, price decrease icon. Tablet pc with arrow and euro sign. Flat design vector illustration. Sale decrease graphic vectors Sale, discounts, price decrease icon. Tablet pc with arrow and euro sign. Flat design vector illustration
Free with trial Dollar increase decrease icon. Money symbol with arrow stretching rising up and drop fall down. Business cost sale and reduction icon. vector illustration. Sale decrease graphic vectors Dollar increase decrease icon. Money symbol with arrow stretching rising up and drop fall down. Business cost sale and reduction
Free with trial Dollar increase decrease icon. Money symbol with arrow stretching rising up and drop fall down. Business cost sale and reduction icon. vector illustration. Sale decrease graphic vectors Dollar increase decrease icon. Money symbol with arrow stretching rising up and drop fall down. Business cost sale and reduction i
Free with trial Dollar increase decrease icon. Money symbol with arrow stretching rising up and drop fall down. Business cost sale and reduction icon. vector illustration. Sale decrease graphic vectors Dollar increase decrease icon. Money symbol with arrow stretching rising up and drop fall down. Business cost sale and reduction i
Free with trial Set of digital red labels for sale discounts percent, circle with arrow down for decrease price, tags bubbles, isolated. Sale decrease graphic vectors Set of digital red labels for sale discounts percent, circle with arrow down for decrease price, tags bubbles
Free with trial Set line Global economic crisis Dollar rate decrease Hanging sign with Sale Drop crude oil price Mobile stock trading and icon. Vector. Sale decrease graphic illustrations Set line Global economic crisis, Dollar rate decrease, Hanging sign with Sale, Drop crude oil price, Mobile stock. Set line Global economic crisis Dollar rate decrease Hanging sign with Sale Drop crude oil price Mobile stock trading and icon. Vector.
Free with trial Global Economic Crisis, Defaulted Economy, Sale Drop Landing Page Template. Businessman Look on Chart Going Down. Investor Character Bankrupt, Lost Money, Business Decrease. Linear Vector Illustration. Sale decrease graphic vectors Global Economic Crisis, Defaulted Economy, Sale Drop Landing Page Template. Businessman Look on Chart Go Down, Decrease. Global Economic Crisis, Defaulted Economy, Sale Drop Landing Page Template. Businessman Look on Chart Going Down. Investor Character Bankrupt, Lost Money, Business Decrease. Linear Vector Illustration
Free with trial Set Bank building, Dollar rate decrease, and Hanging sign with Sale icon. Vector. Sale decrease graphic vectors Set Bank building, Dollar rate decrease, and Hanging sign with Sale icon. Vector
Free with trial Dollar increase decrease icon. Money symbol with arrow stretching rising up and drop fall down. Business cost sale and reduction icon. vector illustration. Sale decrease graphic vectors Dollar increase decrease icon. Money symbol with arrow stretching rising up and drop fall down. Business cost sale and reduction
Free with trial Dollar increase decrease icon. Money symbol with arrow stretching rising up and drop fall down. Business cost sale and reduction icon. vector illustration. Sale decrease graphic vectors Dollar increase decrease icon. Money symbol with arrow stretching rising up and drop fall down. Business cost sale and reduction
Free with trial Dollar increase decrease icon. Money symbol with arrow stretching rising up and drop fall down. Business cost sale and reduction icon. vector illustration. Sale decrease graphic vectors Dollar increase decrease icon. Money symbol with arrow stretching rising up and drop fall down. Business cost sale and reduction
Free with trial Set Dollar rate decrease, Briefcase, Hanging sign with Sale and on seamless pattern. Vector. Sale decrease graphic vectors Set Dollar rate decrease, Briefcase, Hanging sign with Sale and on seamless pattern. Vector
Free with trial Dollar increase decrease icon. Money symbol with arrow stretching rising up and drop fall down. Business cost sale and reduction icon. vector illustration. Sale decrease graphic vectors Dollar increase decrease icon. Money symbol with arrow stretching rising up and drop fall down. Business cost sale and reduction
Free with trial Dollar increase decrease icon. Money symbol with arrow stretching rising up and drop fall down. Business cost sale and reduction icon. vector illustration. Sale decrease graphic vectors Dollar increase decrease icon. Money symbol with arrow stretching rising up and drop fall down. Business cost sale and reduction i
Free with trial Set line Infographic element Pie chart infographic Shopping bag with Sale Financial growth decrease Layers Intersection point and Many ways directional arrow icon. Vector. Sale decrease graphic illustrations Set line Infographic element, Pie chart infographic, Shopping bag with Sale, Financial growth decrease, Layers. Set line Infographic element Pie chart infographic Shopping bag with Sale Financial growth decrease Layers Intersection point and Many ways directional arrow icon. Vector.
Free with trial Set Isometric Dollar rate decrease, Glass money jar with coin, and Hanging sign Sale icon. Vector. Sale decrease graphic illustrations Set Isometric Dollar rate decrease, Glass money jar with coin, and Hanging sign Sale icon. Vector
Free with trial Set line Hanging sign with Sale, Pie chart infographic, Dollar rate decrease and Safe icon. Vector. Sale decrease graphic vectors Set line Hanging sign with Sale, Pie chart infographic, Dollar rate decrease and Safe icon. Vector
Free with trial Set Arrow, Financial growth increase, Shopping bag with Sale, decrease, and Unknown search icon. Vector. Sale decrease graphic vectors Set Arrow, Financial growth increase, Shopping bag with Sale, decrease, and Unknown search icon. Vector
Free with trial Set Isometric line Global economic crisis, , Dollar rate decrease and Hanging sign with Sale icon. Vector. Sale decrease graphic illustrations Set Isometric line Global economic crisis, , Dollar rate decrease and Hanging sign with Sale icon. Vector
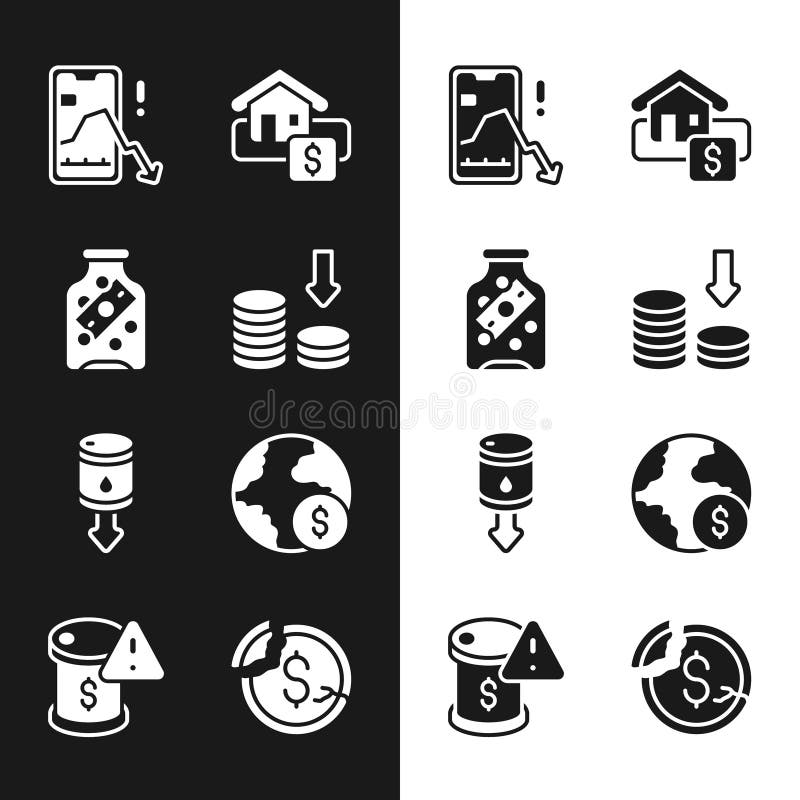
Free with trial Set Hanging sign with Sale Global economic crisis news Glass money jar coin Dollar rate decrease Money bomb dollar and Stop delivery cargo truck icon. Vector. Sale decrease graphic vectors Set Hanging sign with Sale, Global economic crisis news, Glass money jar coin, Dollar rate decrease, Money bomb dollar. Set Hanging sign with Sale Global economic crisis news Glass money jar coin Dollar rate decrease Money bomb dollar and Stop delivery cargo truck icon. Vector.
Free with trial Set line Hanging sign with Sale, Global economic crisis, Dollar rate decrease and Briefcase icon. Vector. Sale decrease graphic vectors Set line Hanging sign with Sale, Global economic crisis, Dollar rate decrease and Briefcase icon. Vector
Free with trial Set Pyramid chart infographics Shopping bag with Sale Percent up arrow Financial growth decrease Graph chart diagram Clock Dollar symbol and Pie icon. Vector. Sale decrease graphic illustrations Set Pyramid chart infographics, Shopping bag with Sale, Percent up arrow, Financial growth decrease, Graph, chart. Set Pyramid chart infographics Shopping bag with Sale Percent up arrow Financial growth decrease Graph chart diagram Clock Dollar symbol and Pie icon. Vector.
Free with trial Set Financial growth decrease Arrow Location Shopping bag with Sale Many ways directional arrow and Pie chart infographic icon. Vector. Sale decrease graphic vectors Set Financial growth decrease, Arrow, Location, Shopping bag with Sale, Many ways directional arrow and Pie chart. Set Financial growth decrease Arrow Location Shopping bag with Sale Many ways directional arrow and Pie chart infographic icon. Vector.
Free with trial Set line Dollar rate decrease, Hanging sign with Sale, Global economic crisis and. Glowing neon icon. Vector. Sale decrease graphic vectors Set line Dollar rate decrease, Hanging sign with Sale, Global economic crisis and . Glowing neon icon. Vector
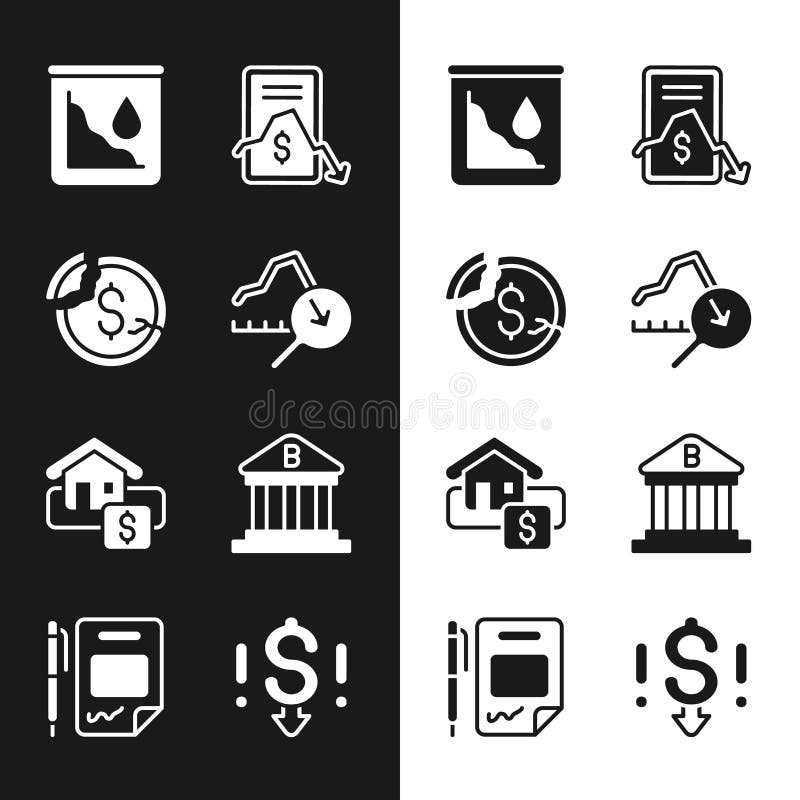
Free with trial Set line Contract money and pen, Hanging sign with Sale, Dollar rate decrease and. Business infographic template. Vector. Sale decrease graphic vectors Set line Contract money and pen, Hanging sign with Sale, Dollar rate decrease and . Business infographic template
Free with trial Set Financial growth decrease, Pie chart infographic, Graph, chart, diagram and Shopping bag with Sale. Black square button. Vector. Sale decrease graphic vectors Set Financial growth decrease, Pie chart infographic, Graph, chart, diagram and Shopping bag with Sale. Black square
Free with trial Set Gold bars Drop in crude oil price Hanging sign with Sale Safe Money bag Storm Dollar rate decrease and Briefcase icon. Vector. Sale decrease graphic vectors Set Gold bars, Drop in crude oil price, Hanging sign with Sale, Safe, Money bag, Storm, Dollar rate decrease and. Set Gold bars Drop in crude oil price Hanging sign with Sale Safe Money bag Storm Dollar rate decrease and Briefcase icon. Vector.
Free with trial Set Contract money and pen Global economic crisis Dollar rate decrease Burning dollar bill Hanging sign with Sale Money bomb Briefcase and icon. Vector. Sale decrease graphic vectors Set Contract money and pen, Global economic crisis, Dollar rate decrease, Burning dollar bill, Hanging sign with Sale. Set Contract money and pen Global economic crisis Dollar rate decrease Burning dollar bill Hanging sign with Sale Money bomb Briefcase and icon. Vector.
Free with trial Set line Financial growth decrease Unknown search Arrow Shopping bag with Sale Clock Many ways directional arrow and Pie chart infographic icon. Vector. Sale decrease graphic vectors Set line Financial growth decrease, Unknown search, Arrow, Shopping bag with Sale, Clock, Many ways directional arrow. Set line Financial growth decrease Unknown search Arrow Shopping bag with Sale Clock Many ways directional arrow and Pie chart infographic icon. Vector.
Free with trial Set Global economic crisis, Hanging sign with Sale, Dollar rate decrease and Mobile stock trading icon. Vector. Sale decrease graphic vectors Set Global economic crisis, Hanging sign with Sale, Dollar rate decrease and Mobile stock trading icon. Vector
Free with trial Set line Arrow Shopping bag with Sale Financial growth decrease Location Pie chart infographic and Delivery tracking icon. Vector. Sale decrease graphic vectors Set line Arrow, Shopping bag with Sale, Financial growth decrease, Location, Pie chart infographic, and Delivery. Set line Arrow Shopping bag with Sale Financial growth decrease Location Pie chart infographic and Delivery tracking icon. Vector.
Free with trial Set Financial growth decrease Pie chart infographic Arrow increase Shopping bag with Sale and Graph chart diagram icon. Vector. Sale decrease graphic vectors Set Financial growth decrease, Pie chart infographic, Arrow, increase, Shopping bag with Sale, and Graph, chart, diagram. Set Financial growth decrease Pie chart infographic Arrow increase Shopping bag with Sale and Graph chart diagram icon. Vector.
Free with trial Set Credit card, Hanging sign with Sale, Dollar rate decrease, Drop crude oil price, and icon. Vector. Sale decrease graphic vectors Set Credit card, Hanging sign with Sale, Dollar rate decrease, Drop crude oil price, and icon. Vector
Free with trial Set Dollar rate decrease, Shutdown of factory, Hanging sign with Sale and icon. Vector. Sale decrease graphic vectors Set Dollar rate decrease, Shutdown of factory, Hanging sign with Sale and icon. Vector
Free with trial Set Drop in crude oil price, Hanging sign with Sale, Pie chart infographic and Dollar rate decrease icon. Vector. Sale decrease graphic vectors Set Drop in crude oil price, Hanging sign with Sale, Pie chart infographic and Dollar rate decrease icon. Vector
Free with trial Set Dollar rate decrease, Drop in crude oil price, Hanging sign with Sale and Global economic crisis icon. Vector. Sale decrease graphic illustrations Set Dollar rate decrease, Drop in crude oil price, Hanging sign with Sale and Global economic crisis icon. Vector
Free with trial Set Hanging sign with Sale Dollar rate decrease Drop crude oil price Stop delivery cargo truck Global economic crisis news and Worker icon. Vector. Sale decrease graphic vectors Set Hanging sign with Sale, Dollar rate decrease, Drop crude oil price, Stop delivery cargo truck, Global economic. Set Hanging sign with Sale Dollar rate decrease Drop crude oil price Stop delivery cargo truck Global economic crisis news and Worker icon. Vector.
Free with trial Set Dollar rate decrease Glass money jar with coin Mobile stock trading Hanging sign Sale Drop crude oil price Global economic crisis and icon. Vector. Sale decrease graphic vectors Set Dollar rate decrease, Glass money jar with coin, Mobile stock trading, Hanging sign Sale, Drop crude oil price. Set Dollar rate decrease Glass money jar with coin Mobile stock trading Hanging sign Sale Drop crude oil price Global economic crisis and icon. Vector.
Free with trial Set Global economic crisis Money bag Dollar rate decrease Fire in burning house and Hanging sign with Sale icon. Vector. Sale decrease graphic vectors Set Global economic crisis, Money bag, Dollar rate decrease, Fire in burning house and Hanging sign with Sale icon
Free with trial Set line Hanging sign with Sale Dollar rate decrease Glass money jar coin Debt ball chained to Falling property prices Bank building and Mobile stock trading icon. Vector. Sale decrease graphic vectors Set line Hanging sign with Sale, Dollar rate decrease, Glass money jar coin, Debt ball chained to, Falling property. Set line Hanging sign with Sale Dollar rate decrease Glass money jar coin Debt ball chained to Falling property prices Bank building and Mobile stock trading icon. Vector.
Free with trial Set Pie chart infographic Shopping bag with Sale Arrow Digital speed meter Layers Financial growth decrease and icon. Vector. Sale decrease graphic vectors Set Pie chart infographic, Shopping bag with Sale, Arrow, Digital speed meter, Layers, Financial growth decrease, and. Set Pie chart infographic Shopping bag with Sale Arrow Digital speed meter Layers Financial growth decrease and icon. Vector.
Free with trial Set line Shopping bag with Sale, Financial growth decrease, Pyramid chart infographics and Pie. Color circle button. Vector. Sale decrease graphic vectors Set line Shopping bag with Sale, Financial growth decrease, Pyramid chart infographics and Pie. Color circle button
Free with trial Set Isometric line Shopping bag with Sale, Layers, Financial growth decrease and Pie chart infographic. Blue square button. Vector. Sale decrease graphic vectors Set Isometric line Shopping bag with Sale, Layers, Financial growth decrease and Pie chart infographic. Blue square
Free with trial Set line Arrow Clock Pie chart infographic Shopping bag with Sale Financial growth decrease Pyramid infographics and Infographic element icon. Vector. Sale decrease graphic vectors Set line Arrow, Clock, Pie chart infographic, Shopping bag with Sale, Financial growth decrease, Pyramid infographics. Set line Arrow Clock Pie chart infographic Shopping bag with Sale Financial growth decrease Pyramid infographics and Infographic element icon. Vector.
Free with trial Set Shutdown of factory Global economic crisis Dollar rate decrease Hanging sign with Sale Debt ball chained coin and Drop crude oil price icon. Vector. Sale decrease graphic illustrations Set Shutdown of factory, Global economic crisis, Dollar rate decrease, Hanging sign with Sale, Debt ball chained coin. Set Shutdown of factory Global economic crisis Dollar rate decrease Hanging sign with Sale Debt ball chained coin and Drop crude oil price icon. Vector.
Free with trial Set Safe, Shutdown of factory, Dollar rate decrease and Hanging sign with Sale. Business infographic template. Vector. Sale decrease graphic vectors Set Safe, Shutdown of factory, Dollar rate decrease and Hanging sign with Sale. Business infographic template. Vector
Free with trial Set line Dollar rate decrease, Global economic crisis, Debt ball chained to coin and Hanging sign with Sale. Glowing neon icon. Vector. Sale decrease graphic vectors Set line Dollar rate decrease, Global economic crisis, Debt ball chained to coin and Hanging sign with Sale. Glowing
Free with trial Set Dollar rate decrease Mobile stock trading Bank building Global economic crisis news and Hanging sign with Sale icon. Vector. Sale decrease graphic vectors Set Dollar rate decrease, Mobile stock trading, Bank building, Global economic crisis, news and Hanging sign with Sale
Free with trial Set line Hanging sign with Sale, Dollar rate decrease, Tearing money banknote and Global economic crisis icon. Vector. Sale decrease graphic illustrations Set line Hanging sign with Sale, Dollar rate decrease, Tearing money banknote and Global economic crisis icon. Vector
Free with trial Set Global economic crisis Dollar rate decrease Drop in crude oil price Mobile stock trading Hanging sign with Sale Bank building and Contract money and pen icon. Vector. Sale decrease graphic vectors Set Global economic crisis, Dollar rate decrease, Drop in crude oil price, Mobile stock trading, Hanging sign with Sale. Set Global economic crisis Dollar rate decrease Drop in crude oil price Mobile stock trading Hanging sign with Sale Bank building and Contract money and pen icon. Vector.
Free with trial Set Prison cell door Dollar rate decrease Drop in crude oil price Global economic crisis Hanging sign with Sale and icon. Vector. Sale decrease graphic vectors Set Prison cell door, Dollar rate decrease, Drop in crude oil price, Global economic crisis, Hanging sign with Sale and
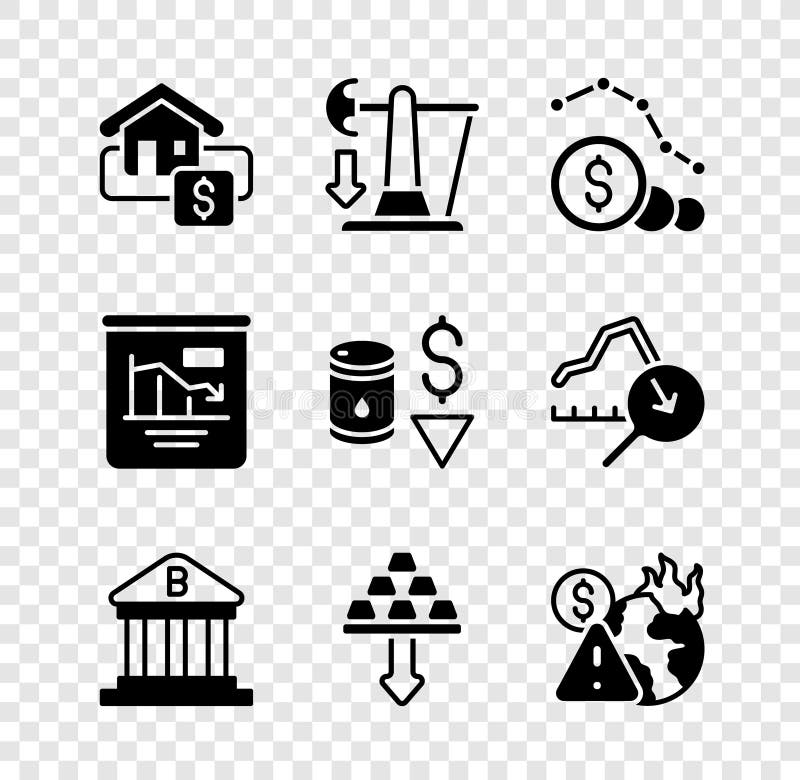
Free with trial Set Hanging sign with Sale Drop crude oil price Dollar rate decrease Bank building Gold bars Global economic crisis Pie chart infographic and icon. Vector. Sale decrease graphic vectors Set Hanging sign with Sale, Drop crude oil price, Dollar rate decrease, Bank building, Gold bars, Global economic crisis. Set Hanging sign with Sale Drop crude oil price Dollar rate decrease Bank building Gold bars Global economic crisis Pie chart infographic and icon. Vector.
Free with trial Set Hanging sign with Sale Drop crude oil price Dollar rate decrease Global economic crisis news and Contract money and pen icon. Vector. Sale decrease graphic vectors Set Hanging sign with Sale, Drop crude oil price, Dollar rate decrease, Global economic crisis news, and Contract money. Set Hanging sign with Sale Drop crude oil price Dollar rate decrease Global economic crisis news and Contract money and pen icon. Vector.
Free with trial Set Financial growth decrease Pie chart infographic Wrench and gear Old hourglass with sand Arrow Shopping bag Sale and Dollar symbol icon. Vector. Sale decrease graphic vectors Set Financial growth decrease, Pie chart infographic, Wrench and gear, Old hourglass with sand, Arrow, Shopping bag Sale. Set Financial growth decrease Pie chart infographic Wrench and gear Old hourglass with sand Arrow Shopping bag Sale and Dollar symbol icon. Vector.
Free with trial Set line Contract money and pen Global economic crisis news Dollar rate decrease Hanging sign with Sale Fire burning house and icon. Vector. Sale decrease graphic vectors Set line Contract money and pen, Global economic crisis news, Dollar rate decrease, Hanging sign with Sale, Fire burning. Set line Contract money and pen Global economic crisis news Dollar rate decrease Hanging sign with Sale Fire burning house and icon. Vector.
Free with trial Set Dollar rate decrease Hanging sign with Sale Tearing money banknote Pie chart infographic Falling property prices Glass jar coin Debt ball chained to and Global economic crisis icon. Vector. Sale decrease graphic vectors Set Dollar rate decrease, Hanging sign with Sale, Tearing money banknote, Pie chart infographic, Falling property prices. Set Dollar rate decrease Hanging sign with Sale Tearing money banknote Pie chart infographic Falling property prices Glass jar coin Debt ball chained to and Global economic crisis icon. Vector.
Free with trial Set Hanging sign with Sale, Dollar rate decrease, Pie chart infographic and Global economic crisis on seamless pattern. Vector. Sale decrease graphic vectors Set Hanging sign with Sale, Dollar rate decrease, Pie chart infographic and Global economic crisis on seamless pattern
Free with trial Set Dollar rate decrease, Mobile stock trading, Global economic crisis and Hanging sign with Sale. Business infographic template. Vector. Sale decrease graphic vectors Set Dollar rate decrease, Mobile stock trading, Global economic crisis and Hanging sign with Sale. Business infographic
Free with trial Set line Hanging sign with Sale Drop crude oil price Dollar rate decrease Shutdown of factory Tearing money banknote Debt ball chained coin and icon. Vector. Sale decrease graphic vectors Set line Hanging sign with Sale, Drop crude oil price, Dollar rate decrease, Shutdown of factory, Tearing money banknote. Set line Hanging sign with Sale Drop crude oil price Dollar rate decrease Shutdown of factory Tearing money banknote Debt ball chained coin and icon. Vector.
Free with trial Set Isometric line Hanging sign with Sale, Dollar rate decrease, and icon. Vector. Sale decrease graphic vectors Set Isometric line Hanging sign with Sale, Dollar rate decrease, and icon. Vector
Free with trial Set Hanging sign with Sale Global economic crisis Drop crude oil price Dollar rate decrease Shutdown of factory Mobile stock trading Worker and icon. Vector. Sale decrease graphic vectors Set Hanging sign with Sale, Global economic crisis, Drop crude oil price, Dollar rate decrease, Shutdown of factory. Set Hanging sign with Sale Global economic crisis Drop crude oil price Dollar rate decrease Shutdown of factory Mobile stock trading Worker and icon. Vector.
Free with trial Set Drop in crude oil price Hanging sign with Sale Dollar rate decrease Global economic crisis Shutdown of factory and Calculation expenses icon. Vector. Sale decrease graphic vectors Set Drop in crude oil price, Hanging sign with Sale, Dollar rate decrease, Global economic crisis, Shutdown of factory. Set Drop in crude oil price Hanging sign with Sale Dollar rate decrease Global economic crisis Shutdown of factory and Calculation expenses icon. Vector.
Free with trial Set line Location Graph chart diagram Financial growth decrease Pie infographic Flag Shopping bag with Sale Arrow and Project team base icon. Vector. Sale decrease graphic vectors Set line Location, Graph, chart, diagram, Financial growth decrease, Pie infographic, Flag, Shopping bag with Sale. Set line Location Graph chart diagram Financial growth decrease Pie infographic Flag Shopping bag with Sale Arrow and Project team base icon. Vector.
Free with trial Set Intersection point Financial growth decrease Shopping bag with Sale Location Percent up arrow Flag Target and Unknown search icon. Vector. Sale decrease graphic illustrations Set Intersection point, Financial growth decrease, Shopping bag with Sale, Location, Percent up arrow, Flag, Target and. Set Intersection point Financial growth decrease Shopping bag with Sale Location Percent up arrow Flag Target and Unknown search icon. Vector.
Free with trial Global Economic Crisis, Trading Risks, Defaulted Economy, Corporate Sale Drop. Investor Character Bankrupt, Lost Money, Investment Business Finance Decrease at Covid19. Linear Vector Illustration. Sale decrease graphic vectors Global Economic Crisis, Trading Risks, Defaulted Economy, Corporate Sale Drop. Investor Character Bankrupt