Free with trial Graph or block diagram shows the increase or decrease of shares, which means financial loss or gain -. Sale decrease illustrations Graph or block diagram shows the increase or decrease of shares, which means financial loss or gain
Free with trial Three red, downward-pointing arrows are displayed against a black background. Each arrow prominently features the number "50" and a "%" symbol in white, indicating a 50% discount or reduction. The central arrow is larger than the two flanking arrows, creating a visual emphasis. Sale decrease illustrations Three Red Arrows With 50 Percent Discount sale percentage. Three red, downward-pointing arrows are displayed against a black background. Each arrow prominently features the number "50" and a "%" symbol in white, indicating a 50% discount or reduction. The central arrow is larger than the two flanking arrows, creating a visual emphasis
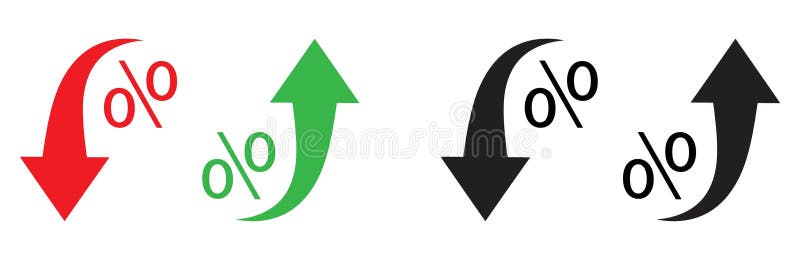
Free with trial Red and black arrows point downward, while green and black arrows point upward. Each arrow is curved, paired with a percentage symbol (%), indicating changes in rate or value. The red and black arrows denote decrease, and the green and black arrows denote increase, suggesting economic or statistical trends. The arrows and symbols are bold and stylized for emphasis. Sale decrease vectors Percent arrow icon. Growth, increase, decrease arrow filled icons. Up arrows, down arrows. Red and black arrows point downward, while green and black arrows point upward. Each arrow is curved, paired with a percentage symbol (%), indicating changes in rate or value. The red and black arrows denote decrease, and the green and black arrows denote increase, suggesting economic or statistical trends. The arrows and symbols are bold and stylized for emphasis.
Free with trial Graph or block diagram shows the increase or decrease of shares, which means financial loss or gain -. Sale decrease illustrations Graph or block diagram shows the increase or decrease of shares, which means financial loss or gain
Free with trial Graph or block diagram shows the increase or decrease of shares, which means financial loss or gain -. Sale decrease illustrations Graph or block diagram shows the increase or decrease of shares, which means financial loss or gain
Free with trial Graph or block diagram shows the increase or decrease of shares, which means financial loss or gain -. Sale decrease illustrations Graph or block diagram shows the increase or decrease of shares, which means financial loss or gain
Free with trial Graph or block diagram shows the increase or decrease of shares, which means financial loss or gain -. Sale decrease illustrations Graph or block diagram shows the increase or decrease of shares, which means financial loss or gain
Free with trial Graph or block diagram shows the increase or decrease of shares, which means financial loss or gain -. Sale decrease illustrations Graph or block diagram shows the increase or decrease of shares, which means financial loss or gain
Free with trial Graph or block diagram shows the increase or decrease of shares, which means financial loss or gain -. Sale decrease illustrations Graph or block diagram shows the increase or decrease of shares, which means financial loss or gain
Free with trial Graph or block diagram shows the increase or decrease of shares, which means financial loss or gain -. Sale decrease illustrations Graph or block diagram shows the increase or decrease of shares, which means financial loss or gain
Free with trial Graph or block diagram shows the increase or decrease of shares, which means financial loss or gain -. Sale decrease illustrations Graph or block diagram shows the increase or decrease of shares, which means financial loss or gain
Free with trial Graph or block diagram shows the increase or decrease of shares, which means financial loss or gain -. Sale decrease illustrations Graph or block diagram shows the increase or decrease of shares, which means financial loss or gain
Free with trial Graph or block diagram shows the increase or decrease of shares, which means financial loss or gain -. Sale decrease illustrations Graph or block diagram shows the increase or decrease of shares, which means financial loss or gain
Free with trial Graph or block diagram shows the increase or decrease of shares, which means financial loss or gain -. Sale decrease illustrations Graph or block diagram shows the increase or decrease of shares, which means financial loss or gain
Free with trial Graph or block diagram shows the increase or decrease of shares, which means financial loss or gain -. Sale decrease illustrations Graph or block diagram shows the increase or decrease of shares, which means financial loss or gain
Free with trial Graph or block diagram shows the increase or decrease of shares, which means financial loss or gain -. Sale decrease illustrations Graph or block diagram shows the increase or decrease of shares, which means financial loss or gain
Free with trial Graph or block diagram shows the increase or decrease of shares, which means financial loss or gain -. Sale decrease illustrations Graph or block diagram shows the increase or decrease of shares, which means financial loss or gain
Free with trial Graph or block diagram shows the increase or decrease of shares, which means financial loss or gain -. Sale decrease illustrations Graph or block diagram shows the increase or decrease of shares, which means financial loss or gain
Free with trial Graph or block diagram shows the increase or decrease of shares, which means financial loss or gain -. Sale decrease illustrations Graph or block diagram shows the increase or decrease of shares, which means financial loss or gain
Free with trial Graph or block diagram shows the increase or decrease of shares, which means financial loss or gain -. Sale decrease illustrations Graph or block diagram shows the increase or decrease of shares, which means financial loss or gain
Free with trial Graph or block diagram shows the increase or decrease of shares, which means financial loss or gain -. Sale decrease illustrations Graph or block diagram shows the increase or decrease of shares, which means financial loss or gain
Free with trial Graph or block diagram shows the increase or decrease of shares, which means financial loss or gain -. Sale decrease illustrations Graph or block diagram shows the increase or decrease of shares, which means financial loss or gain
Free with trial Graph or block diagram shows the increase or decrease of shares, which means financial loss or gain -. Sale decrease illustrations Graph or block diagram shows the increase or decrease of shares, which means financial loss or gain
Free with trial Graph or block diagram shows the increase or decrease of shares, which means financial loss or gain -. Sale decrease illustrations Graph or block diagram shows the increase or decrease of shares, which means financial loss or gain
Free with trial Graph or block diagram shows the increase or decrease of shares, which means financial loss or gain -. Sale decrease illustrations Graph or block diagram shows the increase or decrease of shares, which means financial loss or gain
Free with trial Graph or block diagram shows the increase or decrease of shares, which means financial loss or gain -. Sale decrease illustrations Graph or block diagram shows the increase or decrease of shares, which means financial loss or gain
Free with trial Graph or block diagram shows the increase or decrease of shares, which means financial loss or gain -. Sale decrease illustrations Graph or block diagram shows the increase or decrease of shares, which means financial loss or gain
Free with trial Graph or block diagram shows the increase or decrease of shares, which means financial loss or gain -. Sale decrease illustrations Graph or block diagram shows the increase or decrease of shares, which means financial loss or gain
Free with trial Graph or block diagram shows the increase or decrease of shares, which means financial loss or gain -. Sale decrease illustrations Graph or block diagram shows the increase or decrease of shares, which means financial loss or gain
Free with trial Graph or block diagram shows the increase or decrease of shares, which means financial loss or gain -. Sale decrease illustrations Graph or block diagram shows the increase or decrease of shares, which means financial loss or gain
Free with trial Graph or block diagram shows the increase or decrease of shares, which means financial loss or gain -. Sale decrease illustrations Graph or block diagram shows the increase or decrease of shares, which means financial loss or gain
Free with trial Graph or block diagram shows the increase or decrease of shares, which means financial loss or gain -. Sale decrease illustrations Graph or block diagram shows the increase or decrease of shares, which means financial loss or gain
Free with trial Graph or block diagram shows the increase or decrease of shares, which means financial loss or gain -. Sale decrease illustrations Graph or block diagram shows the increase or decrease of shares, which means financial loss or gain
Free with trial Set Browser window Cloud technology data transfer Laptop with browser setting Search engine Photo retouching Financial growth decrease and icon. Vector. Sale decrease vectors Set Browser window, Cloud technology data transfer, Laptop with browser, setting, Search engine, Photo retouching. Set Browser window Cloud technology data transfer Laptop with browser setting Search engine Photo retouching Financial growth decrease and icon. Vector.
Free with trial Set line Glass money jar with coin, Dollar rate decrease, Tearing banknote and Safe. Glowing neon icon. Vector. Sale decrease vectors Set line Glass money jar with coin, Dollar rate decrease, Tearing banknote and Safe. Glowing neon icon. Vector
Free with trial High and Low Percent arrow icon set in black and white colors. EPS 10. Sale decrease vectors High and Low Percent Arrow Icon Set. Increase Decrease and Price Vector symbol in a black filled and outlined style. Market. High and Low Percent arrow icon set in black and white colors. EPS 10
Free with trial A black and white line illustration features a speech bubble with a downward arrow and a dollar sign, indicating a decrease in value. Below, a stylized gold bar is depicted, flanked by two sparkles. The minimalistic design suggests an economic theme, likely related to changes in gold prices. Sale decrease vectors Gold Price Down. A black and white line illustration features a speech bubble with a downward arrow and a dollar sign, indicating a decrease in value. Below, a stylized gold bar is depicted, flanked by two sparkles. The minimalistic design suggests an economic theme, likely related to changes in gold prices.
Free with trial A graphic icon shows a stylized gold bar with two sparkle symbols on either side, suggesting value or shine. Above, a speech bubble contains a downward-facing arrow and a dollar sign, indicating a decrease or decline in value or price. The design uses a simple black and white color scheme, conveying information clearly and directly. Sale decrease vectors Gold Price Down. A graphic icon shows a stylized gold bar with two sparkle symbols on either side, suggesting value or shine. Above, a speech bubble contains a downward-facing arrow and a dollar sign, indicating a decrease or decline in value or price. The design uses a simple black and white color scheme, conveying information clearly and directly.
Free with trial Black Friday y2k trendy contemporary sticker collage banner set. Colorful groovy font. Get 50 off sale. Pop art badges vertical post for social media. Discount price promo poster. Vector illustration. Sale decrease vectors Black Friday Social Media Post Sticker Collage Set. Black Friday y2k trendy contemporary sticker collage banner set. Colorful groovy font. Get 50 off sale. Pop art badges vertical post for social media. Discount price promo poster. Vector illustration.
Free with trial A line graph with a decreasing trend is commonly used to depict scenarios like declining sales, decreasing stock prices, or any situation where a decrease in values over time or across categories is a significant aspect of the data. It provides a clear and intuitive way to understand trends and make informed interpretations about the decreasing values being represented. Sale decrease illustrations Chart with decreasing line graph. A line graph with a decreasing trend is commonly used to depict scenarios like declining sales, decreasing stock prices, or any situation where a decrease in values over time or across categories is a significant aspect of the data. It provides a clear and intuitive way to understand trends and make informed interpretations about the decreasing values being represented.
Free with trial Dollar Vector illustration on a transparent background. Premium quality symmbols. Line Color vector icons for concept and graphic design. Sale decrease vectors Dollar income money currency sale. Dollar Vector illustration on a transparent background. Premium quality symmbols. Line Color vector icons for concept and graphic design
Free with trial Cost label icon outline vector. Discount price. Sale promotion color flat. Sale decrease vectors Cost label icon vector flat. Cost label icon outline vector. Discount price. Sale promotion color flat
Free with trial Set of Halftone Hand Gestures. Black Friday collage elements with retro Y2K doodle stars, shopping bags and tags. Big sale discount. Perfect for social media. Isolated stickers. Vector illustration. Sale decrease vectors Black Friday Halftone Collage Hand Gestures Set. Set of Halftone Hand Gestures. Black Friday collage elements with retro Y2K doodle stars, shopping bags and tags. Big sale discount. Perfect for social media. Isolated stickers. Vector illustration.
Free with trial Black Friday special offer for social media in glass morphism. 50 OFF sale. Discount price. Special offer marketing Ad for social media. Discount promotion, sale discount offer. Vector illustration. Sale decrease vectors Black Friday social media post in glass morphism. Black Friday special offer for social media in glass morphism. 50 OFF sale. Discount price. Special offer marketing Ad for social media. Discount promotion, sale discount offer. Vector illustration.
Free with trial A red arrow with a zigzag line falls downward illustrating decrease or loss on a light blue background to represent financial or economic decline. Sale decrease illustrations Red Arrow Falling Zigzag Chart. A red arrow with a zigzag line falls downward illustrating decrease or loss on a light blue background to represent financial or economic decline
Free with trial A 3D rendered, vibrant red arrow pointing downwards and to the right, isolated on a transparent background. The arrow has a modern, sleek design. It can be used to represent concepts like decrease, decline, direction, navigation, or a downward trend. The clean background makes it easy to integrate into various designs and projects. Sale decrease illustrations Red Arrow Pointing Down
Free with trial Home with arrows down. Property value decrease. Pixel perfect, editable stroke vector icon. Sale decrease vectors Home with arrows down. Property value decrease. Pixel perfect vector icon. Home with arrows down. Property value decrease. Pixel perfect, editable stroke vector icon
Free with trial A minimalist vector icon representing a house with a prominent downward arrow. Sale decrease vectors Real Estate Market Decrease Vector Icon. A minimalist vector icon representing a house with a prominent downward arrow
Free with trial 3d realistic percent gold balloon in cartoon style. Business, sales and discounts concept. Discount sign and sale. Vector illustration in yellow colors. Sale decrease vectors 3d realistic percent gold balloon in cartoon style
Free with trial Black and white line icon depicting a t-shirt with a speech bubble above it. Inside the bubble, a downward arrow is next to a dollar sign, symbolizing a price reduction or sale. The design is simple and clean, using bold lines for easy recognition, likely used in retail contexts to indicate discounts on clothing items. Sale decrease vectors Prices Go Down. Black and white line icon depicting a t-shirt with a speech bubble above it. Inside the bubble, a downward arrow is next to a dollar sign, symbolizing a price reduction or sale. The design is simple and clean, using bold lines for easy recognition, likely used in retail contexts to indicate discounts on clothing items.
Free with trial Home with arrows down. Property value decrease. Pixel perfect, editable stroke vector icon. Sale decrease vectors Home with arrows down. Property value decrease. Pixel perfect, editable stroke icon
Free with trial A minimalist black outline icon depicting a dollar sign with a downward arrow, indicating a decrease in value or price reduction. Sale decrease vectors Simple Outline Dollar Downward Arrow Currency Icon. A minimalist black outline icon depicting a dollar sign with a downward arrow, indicating a decrease in value or price reduction.
Free with trial A dark icon showing a dollar sign within a circle, with a downward arrow signifying a decrease in price or value. Sale decrease vectors Dollar sign with downward arrow indicating cost reduction. A dark icon showing a dollar sign within a circle, with a downward arrow signifying a decrease in price or value
Free with trial A bold blue arrow points downwards, indicating a decrease or decline. Attached to the shaft of the arrow is a pink circular icon with a scalloped edge, featuring a white percentage symbol (%) in the center. The graphic is presented on a clean white background, suggesting a concept related to sales, discounts, price reduction, or a negative market trend. Sale decrease illustrations Blue Downward Arrow with Pink Percentage Discount Icon on White Background direction. A bold blue arrow points downwards, indicating a decrease or decline. Attached to the shaft of the arrow is a pink circular icon with a scalloped edge, featuring a white percentage symbol (%) in the center. The graphic is presented on a clean white background, suggesting a concept related to sales, discounts, price reduction, or a negative market trend
Free with trial Open laptop showing line chart, bar chart, and trend analysis with arrow indicating sales decline. Ideal for analytics, e-commerce, business strategy, financial forecasting, market analysis, sales. Sale decrease vectors Laptop screen displaying charts, analytics, and sale trend with downward arrow. Open laptop showing line chart, bar chart, and trend analysis with arrow indicating sales decline. Ideal for analytics, e-commerce, business strategy, financial forecasting, market analysis, sales
Free with trial Downward arrow with SALE, analytics dashboard, and a cloud icon. Ideal for ecommerce, marketing, analysis, cloud services, business strategy, financial review simple landing page. Sale decrease vectors Sales Decline with Data Analytics and Cloud Connectivity for Business Insights. Downward arrow with SALE, analytics dashboard, and a cloud icon. Ideal for ecommerce, marketing, analysis, cloud services, business strategy, financial review simple landing page
Free with trial Three identical red arrows, each featuring a white percentage symbol (%) and the word "DISCOUNT" in white text, are shown pointing downwards against a black background. The arrows have a slightly rounded, three-dimensional appearance, suggesting a concept of decrease or reduction in price. This visual strongly relates to sales and promotions. Sale decrease illustrations Three red discount arrows pointing down with percentage signs. Three identical red arrows, each featuring a white percentage symbol (%) and the word "DISCOUNT" in white text, are shown pointing downwards against a black background. The arrows have a slightly rounded, three-dimensional appearance, suggesting a concept of decrease or reduction in price. This visual strongly relates to sales and promotions
Free with trial Wooden numbers representing 96% are placed on a dark wooden surface, with a red downward-pointing arrow positioned beside them. Sale decrease illustrations 96% Decrease Shown with Wooden Numbers and Arrow. Wooden numbers representing 96% are placed on a dark wooden surface, with a red downward-pointing arrow positioned beside them.
Free with trial Money falling down concept, cash flow decreasing icon, financial crisis symbol, business loss, bankruptcy. Sale decrease vectors Line vector icon of money falling down, representing a decrease in cash flow. Money falling down concept, cash flow decreasing icon, financial crisis symbol, business loss, bankruptcy
Free with trial 3D percent icons with red and green arrows symbolizing price growth and fall. Modern vector concept for business, finance, sale, and economy illustration, up and down financial rate design. Sale decrease vectors 3D percent icons with red and green arrows symbolizing price growth and fall. Modern vector concept for business
Free with trial A vibrant 3D rendering featuring a black minus and percentage sign combination, set against a playful, irregularly shaped pink background with a bright green border. The icon is prominently displayed on a dark, textured surface, creating a modern and eye-catching visual. This graphic effectively symbolizes discounts, sales, price reductions, and special offers, making it ideal for e-commerce promotions, marketing campaigns, financial presentations, or any content related to savings and deals. Sale decrease illustrations Vibrant 3D Minus Percentage Icon for Discount and Sale Promotions. A vibrant 3D rendering featuring a black minus and percentage sign combination, set against a playful, irregularly shaped pink background with a bright green border. The icon is prominently displayed on a dark, textured surface, creating a modern and eye-catching visual. This graphic effectively symbolizes discounts, sales, price reductions, and special offers, making it ideal for e-commerce promotions, marketing campaigns, financial presentations, or any content related to savings and deals.
Free with trial A single, glossy green arrow points directly downwards. The arrow has a rounded, smooth appearance and is rendered in 3D. It is presented on a clean white background, making it stand out as a distinct icon or symbol. The image is simple and direct, conveying a sense of direction or decrease. Sale decrease illustrations Glossy Green Downward Arrow Icon on White Background image photo. A single, glossy green arrow points directly downwards. The arrow has a rounded, smooth appearance and is rendered in 3D. It is presented on a clean white background, making it stand out as a distinct icon or symbol. The image is simple and direct, conveying a sense of direction or decrease
Free with trial Vector illustration shows a black outlined downward arrow with percentage symbol inside, representing decrease and reduction concept. Clear and minimal design mood. Generative AI. Sale decrease vectors Downward arrow with percentage symbol simple black outline vector illustration. Vector illustration shows a black outlined downward arrow with percentage symbol inside, representing decrease and reduction concept. Clear and minimal design mood. Generative AI
Free with trial A striking, minimalist graphic conveying a message of price reduction or a sale. The design features the 3D text "PRICE" in bold, red and pink shades, dramatically positioned above three large, downward-pointing red arrows. The clean, isometric style and high-contrast color palette make this a highly effective visual metaphor for falling prices, perfect for web banners, promotional posters, advertising campaigns, and social media posts related to discounts, sales, and low cost events like Black Friday or clearance. Sale decrease illustrations Price Reduction Graphic with Bold 3D Text and Downward Red Arrows. A striking, minimalist graphic conveying a message of price reduction or a sale. The design features the 3D text "PRICE" in bold, red and pink shades, dramatically positioned above three large, downward-pointing red arrows. The clean, isometric style and high-contrast color palette make this a highly effective visual metaphor for falling prices, perfect for web banners, promotional posters, advertising campaigns, and social media posts related to discounts, sales, and low cost events like Black Friday or clearance.
Free with trial Vibrant Percentage Sign Displaying a Sale or Discount Representation. Sale decrease vectors Vibrant Percentage Sign Displaying a Sale or Discount Representation
Free with trial High and Low Percent Arrow Icon Set. Increase Decrease and Price Vector symbol in a black filled and outlined style. Market Fluctuation Sign. Sale decrease vectors High and Low Percent arrow icon
Free with trial High and Low Percent Arrow Icon Set. Increase Decrease and Price Vector symbol in a black filled and outlined style. Market Fluctuation Sign. Sale decrease vectors High and Low Percent arrow icon
Free with trial High and Low Percent Arrow Icon Set. Increase Decrease and Price Vector symbol in a black filled and outlined style. Market Fluctuation Sign. Sale decrease vectors High and Low Percent arrow icon
Free with trial Set Safe, Dollar rate decrease, Bank building and Worker icon. Vector. Sale decrease vectors Set Safe, Dollar rate decrease, Bank building and Worker icon. Vector
Free with trial Green percentage symbol with a down arrow shows rate decline on clean white background Representing financial and economic concepts. Sale decrease illustrations Green Percentage Sign with Down Arrow Indicating Decrease on White. Green percentage symbol with a down arrow shows rate decline on clean white background Representing financial and economic concepts
Free with trial Golden shiny nine percent symbol stands out on a peach background offering a great deal for promotions Use for finance and retail visuals. Sale decrease illustrations Nine Percent Golden Sign Promotion Offer Discount for Business Sale. Golden shiny nine percent symbol stands out on a peach background offering a great deal for promotions Use for finance and retail visuals
Free with trial 3D low price icons with red up and down arrows showing rate drop and market decline. Abstract financial vector about price decrease, percent change, and economic fall in modern business design. Sale decrease vectors 3D low price icons with red up and down arrows showing rate drop and market decline. Abstract financial vector about
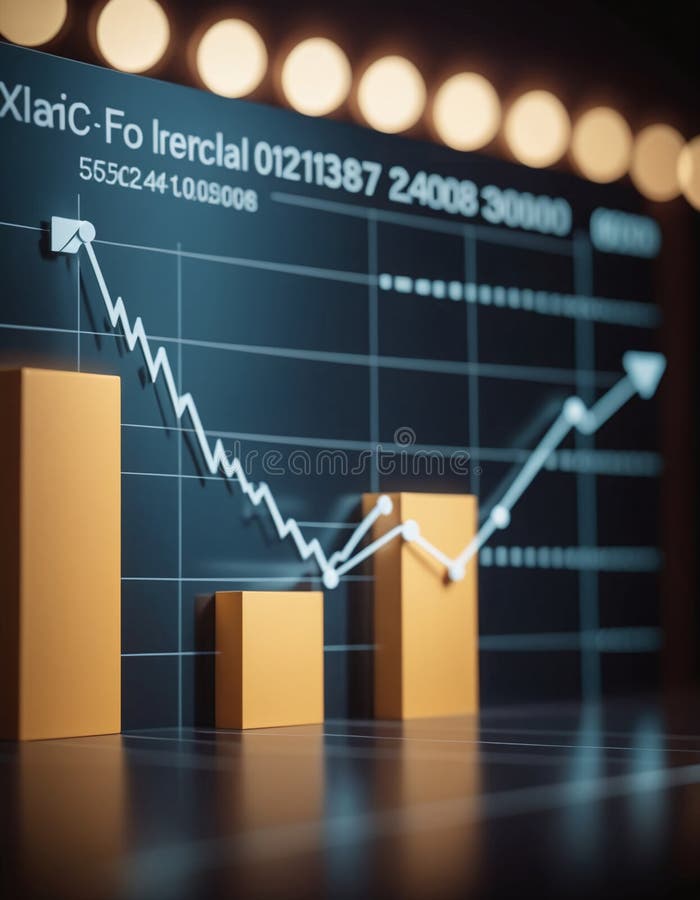
Free with trial Modern rendered line graph with yellow marker points rising and falling vertically, forming a white trend line that fluctuates across the screen. The graph represents business data such as growth, decrease, profit, and market performance. Set against a blurred office background, the image has a clean, digital aesthetic ideal for financial presentations, company reports, startup pitches, and data analysis. This visual is suitable for showcasing trading performance, corporate strategy, and economic trends. Sale decrease illustrations Business Trend Line Graph Showing Growth and Market Fluctuations. Modern rendered line graph with yellow marker points rising and falling vertically, forming a white trend line that fluctuates across the screen. The graph represents business data such as growth, decrease, profit, and market performance. Set against a blurred office background, the image has a clean, digital aesthetic ideal for financial presentations, company reports, startup pitches, and data analysis. This visual is suitable for showcasing trading performance, corporate strategy, and economic trends.
Free with trial The image depicts a vibrant purple rectangular tag with a metallic ring at the top, suggesting it can be attached to an item. Sale decrease illustrations A vibrant purple sale tag with a prominent orange percentage symbol, signifying discounts. The image depicts a vibrant purple rectangular tag with a metallic. The image depicts a vibrant purple rectangular tag with a metallic ring at the top, suggesting it can be attached to an item
Free with trial Scissors cutting a percentage sign, representing cost cutting, sales, and discounts. 3D render. Sale decrease illustrations Cutting Costs: 3D Render of Scissors Snipping a Percentage Sign, Sale Discount Concept. Scissors cutting a percentage sign, representing cost cutting, sales, and discounts. 3D render
Free with trial A 3D blue downward-pointing arrow is depicted with a pink circular tag featuring a white percentage sign attached to its shaft. The graphic is isolated on a white background, symbolizing a decrease or reduction. Sale decrease illustrations 3D Blue Downward Arrow with Pink Percentage Sign on White Background image photo. A 3D blue downward-pointing arrow is depicted with a pink circular tag featuring a white percentage sign attached to its shaft. The graphic is isolated on a white background, symbolizing a decrease or reduction
Free with trial A 3D rendered blue arrow points downwards, signifying a decrease or reduction. Attached to the top of the arrow is a bright pink circular icon containing a white percent sign. The entire graphic is isolated on a clean white background, making it suitable for use in presentations, websites, or marketing materials related to sales, discounts, or negative financial trends. Sale decrease illustrations 3D Blue Downward Arrow with Pink Circle and White Percent Sign Isolated on White image. A 3D rendered blue arrow points downwards, signifying a decrease or reduction. Attached to the top of the arrow is a bright pink circular icon containing a white percent sign. The entire graphic is isolated on a clean white background, making it suitable for use in presentations, websites, or marketing materials related to sales, discounts, or negative financial trends
Free with trial A bold, solid blue arrow points downwards, indicating a decrease or decline. To the right of the arrow, a vibrant pink circular icon features a white percentage sign. The entire graphic is isolated on a plain white background, commonly used to represent concepts like sales, discounts, or negative trends. Sale decrease illustrations Blue Downward Arrow with Pink Percentage Sign Icon on White Background image photo. A bold, solid blue arrow points downwards, indicating a decrease or decline. To the right of the arrow, a vibrant pink circular icon features a white percentage sign. The entire graphic is isolated on a plain white background, commonly used to represent concepts like sales, discounts, or negative trends
Free with trial A set of eight black and white line art icons depicting sales and discount themes, including a gift box, scissors cutting a dollar sign, and a mobile phone with a percentage symbol. Sale decrease vectors Sale Discount Shopping Icons Gift Box Scissors Phone Percentage vector illustration. A set of eight black and white line art icons depicting sales and discount themes, including a gift box, scissors cutting a dollar sign, and a mobile phone with a percentage symbol
Free with trial Set Briefcase, Dollar rate decrease, Worker and Glass money jar with coin icon. Vector. Sale decrease illustrations Set Briefcase, Dollar rate decrease, Worker and Glass money jar with coin icon. Vector