Free with trial Business Down Icon - Percentage Rate Loss Icon sing symbol. Sale decrease vectors Business Down Icon - Percentage Rate Loss Icon
Free with trial Seventy-one percent is displayed in textured gold against a peach backdrop offering a visual for financial promotions or sales statistics. Sale decrease illustrations Golden Seventy-one Percent on Peach Background Displaying Discount or Rate. Seventy-one percent is displayed in textured gold against a peach backdrop offering a visual for financial promotions or sales statistics
Free with trial A collection of six red downward pointing arrows, each featuring a percentage symbol, presented on a clean white background. Sale decrease illustrations Six red downward arrows with percentage symbols isolated on white background. A collection of six red downward pointing arrows, each featuring a percentage symbol, presented on a clean white background
Free with trial Digita blue bar charts descend steadily across a digital grid, illustrating a decline in financial performance and market trends. Downward arrows emphasize loss, negative growth, and economic challenges, while smooth transitions and a tech-inspired layout enhance the visual impact of the data downturn. Sale decrease illustrations Digital blue bar chart with decreasing business concept. Digita blue bar charts descend steadily across a digital grid, illustrating a decline in financial performance and market trends. Downward arrows emphasize loss, negative growth, and economic challenges, while smooth transitions and a tech-inspired layout enhance the visual impact of the data downturn.
Free with trial A 3D golden percentage symbol on white background, ideal for financial and business presentations. High-quality render. Sale decrease illustrations Golden percentage symbol isolated on white background for finance. A 3D golden percentage symbol on white background, ideal for financial and business presentations. High-quality render
Free with trial A colorful, stylized, and somewhat whimsical looking percentage sign. The sign is made up of two lines, one of which is green and the other brown. The green line is the top of the sign. Sale decrease vectors A colorful, stylized, and somewhat whimsical looking percentage sign
Free with trial A stunning visual showcasing a golden, glittering '63%' symbol. The radiant design illuminates a dark, reflective surface, perfect for promotions or financial visuals. Sale decrease illustrations Captivating Golden 63 Percent Symbol on a Reflective Dark Surface. A stunning visual showcasing a golden, glittering '63%' symbol. The radiant design illuminates a dark, reflective surface, perfect for promotions or financial visuals
Free with trial Interest rates going down is represented with a percentage symbol and an arrow in this 3-d illustration. Sale decrease illustrations Interest rates going down is represented with a percentage symbol and an arrow
Free with trial Interest rates going down is represented witha percentage symbol and an arrow in this 3-d illustration. Sale decrease illustrations Interest rates going down is represented with a percentage symbol and an arrow. Interest rates going down is represented witha percentage symbol and an arrow in this 3-d illustration
Free with trial Marketing cost vector line icon. Business illustration is a symbol of marketing strategy and cost reduction. Thin finance and investment icon signifies growth and visual representation managing money. Sale decrease vectors Marketing cost vector line icon. Business illustration is a symbol of marketing strategy and cost reduction. Thin finance and
Free with trial A shiny green metallic arrow with a percentage symbol pointing downwards, isolated on a clean white background. Sale decrease illustrations Green metallic percentage down arrow isolated on white background. A shiny green metallic arrow with a percentage symbol pointing downwards, isolated on a clean white background
Free with trial A 3D red arrow with a yellow percentage sign symbolizing discounts, sales, or financial reductions. Sale decrease illustrations Bright red arrow with yellow percentage symbol indicating discount. A 3D red arrow with a yellow percentage sign symbolizing discounts, sales, or financial reductions
Free with trial Hot Percentage Discount Promo with Flames Special Deal Hot Price Offers. Sale decrease vectors Hot Percentage Discount Promo with Flames Special Deal Hot Price Offers
Free with trial Smartphone is showing a percentage symbol with a downward arrow, indicating a drop in price for online shopping or cashback. Sale decrease illustrations Smartphone showing percentage symbol with downward arrow indicating price drop. Smartphone is showing a percentage symbol with a downward arrow, indicating a drop in price for online shopping or cashback
Free with trial Parking lot full of many cars with a large red arrow pointing downward. Declining business, sales, or economic performance concept for vehicle industry report. Sale decrease illustrations Parking lot full of many cars with a large red arrow pointing downward. Declining business, sales, or economic performance concept for vehicle industry report
Free with trial High and Low Percent arrow vector icon set on white background. eps10. Sale decrease vectors High and Low Percent arrow icon. High and Low Percent arrow vector icon set on white background. eps10
Free with trial Graph line icons. Interest rate, AI generate, Inflation icons. Set of Chart presentation, Report, Increase growth graph icons. Analytics testing, Falling demand, Pie chart report. Vector. Sale decrease vectors Graph line icons. Set of Chart presentation, Report and Increase growth graph icons. App line icons. Vector. Graph line icons. Interest rate, AI generate, Inflation icons. Set of Chart presentation, Report, Increase growth graph icons. Analytics testing, Falling demand, Pie chart report. Vector
Free with trial An archer releases an arrow that completes the percentage symbol with the arrow going at a downward angle in an illustration about interest rates going down. Sale decrease illustrations An archer releases an arrow that completes the percentage symbol with the arrow going at a downward angle
Free with trial Vector drawing illustration stacked coins and arrow trending down, decreasing statistical graphic concept, drawn in black and white color. Sale decrease vectors Vector drawn illustration black and white icon coins and down arrow trend. vector drawing illustration stacked coins and arrow trending down, decreasing statistical graphic concept, drawn in black and white color
Free with trial This image features a set of discount icons with percentage signs, perfect for promotions. It includes various symbols like arrows, tags, leaves, and a magnifier. Sale decrease vectors Vector art of set of discount icons with percentage signs for promotion. This image features a set of discount icons with percentage signs, perfect for promotions. It includes various symbols like arrows, tags, leaves, and a magnifier
Free with trial Percentage reduction target icon with downward and directional arrows. Sale decrease vectors Percentage reduction target icon with downward and directional arrows
Free with trial A golden percentage sign stands amidst stacks of coins on a dark background. This image represents finance, investment, interest rates, and financial growth. Ideal for illustrating economic concepts and investment opportunities. Sale decrease illustrations Golden Percentage Sign with Coins on Black Background Finance Concept. A golden percentage sign stands amidst stacks of coins on a dark background. This image represents finance, investment, interest rates, and financial growth. Ideal for illustrating economic concepts and investment opportunities
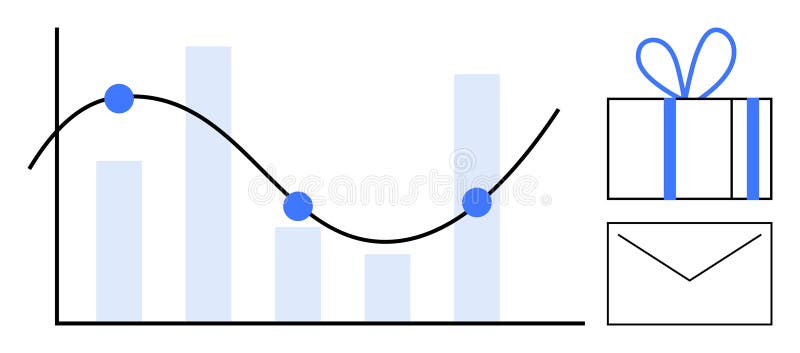
Free with trial Graph with decreasing bar chart and line graph noting key points beside a gift box and envelope. Ideal for business analysis, performance tracking, rewards programs, marketing, sales targets, client. Sale decrease vectors Bar Graph with Line Chart, Gift Box, and Envelope Representing Business Metrics and Rewards. Graph with decreasing bar chart and line graph noting key points beside a gift box and envelope. Ideal for business analysis, performance tracking, rewards programs, marketing, sales targets, client
Free with trial Report document line icon. Neumorphic, Purple gradient, 3d pin buttons. Column graph sign. Growth diagram, pie chart symbol. Line icons. Neumorphic buttons with outline signs. Vector. Sale decrease vectors Report document line icon. Column graph sign. Line icons. Vector. Report document line icon. Neumorphic, Purple gradient, 3d pin buttons. Column graph sign. Growth diagram, pie chart symbol. Line icons. Neumorphic buttons with outline signs. Vector
Free with trial Percentage Symbol Black and White Rounded Icon Discount Finance Design. Sale decrease vectors Percentage Symbol Black and White Rounded Icon Discount Finance Design
Free with trial Circular arrows and down arrow with percent symbol indicating discount. Sale decrease vectors Circular arrows and down arrow with percent symbol indicating discount
Free with trial Laptop showing downward stock chart on screen, realistic graphic style, on white office desk background, concept of financial crisis. 3D Rendering. Sale decrease illustrations Laptop displaying falling stock market chart on office desk showing financial crisis and global market crash in business. Laptop showing downward stock chart on screen, realistic graphic style, on white office desk background, concept of financial crisis. 3D Rendering
Free with trial Percentage Timer Icon Symbolizing Discount Promotion Limited Time Offer. Sale decrease vectors Percentage Timer Icon Symbolizing Discount Promotion Limited Time Offer
Free with trial Shopping basket with a decreasing percentage sign above, symbolizing a reduction in price. Sale decrease vectors Shopping basket displaying decreasing percentage sign representing price reduction. Shopping basket with a decreasing percentage sign above, symbolizing a reduction in price
Free with trial A clean and modern vector icon representing the action of removing an item from a digital shopping cart. Sale decrease vectors Remove from Cart Ecommerce Icon. A clean and modern vector icon representing the action of removing an item from a digital shopping cart
Free with trial Report statistics line icon. Neumorphic, Flat shadow, 3d buttons. Column graph sign. Growth diagram symbol. Line report statistics icon. Social media icons. Vector. Sale decrease illustrations Report statistics line icon. Column graph sign. Neumorphic buttons. Vector. Report statistics line icon. Neumorphic, Flat shadow, 3d buttons. Column graph sign. Growth diagram symbol. Line report statistics icon. Social media icons. Vector
Free with trial Report statistics line icon. Neumorphic, Flat shadow, 3d buttons. Column graph sign. Growth diagram symbol. Line report statistics icon. Social media icons. Vector. Sale decrease illustrations Report statistics line icon. Column graph sign. Neumorphic buttons. Vector. Report statistics line icon. Neumorphic, Flat shadow, 3d buttons. Column graph sign. Growth diagram symbol. Line report statistics icon. Social media icons. Vector
Free with trial Graph laptop line icon. Halftone dotted pattern. Gradient icon with grain shadow. Column chart sign. Growth diagram symbol. Line graph laptop icon. Various designs. Vector. Sale decrease illustrations Graph laptop line icon. Column chart sign. Halftone dotted pattern. Vector. Graph laptop line icon. Halftone dotted pattern. Gradient icon with grain shadow. Column chart sign. Growth diagram symbol. Line graph laptop icon. Various designs. Vector
Free with trial Worldwide Percentage Outline Icon With Ribbon, Discount Promotion Concept. Sale decrease vectors Worldwide Percentage Outline Icon With Ribbon, Discount Promotion Concept
Free with trial Graph line icon. Neumorphic, Orange gradient, 3d pin buttons. Column chart sign. Ab test diagram symbol. Line icons. Neumorphic buttons with outline signs. Vector. Sale decrease vectors Graph line icon. Column chart sign. Line icons. Vector. Graph line icon. Neumorphic, Orange gradient, 3d pin buttons. Column chart sign. Ab test diagram symbol. Line icons. Neumorphic buttons with outline signs. Vector
Free with trial A bold blue percentage symbol, 3D-rendered, ideal for financial, statistical, and business presentations. Clean design. Sale decrease illustrations Blue percentage symbol isolated on white background for finance concepts. A bold blue percentage symbol, 3D-rendered, ideal for financial, statistical, and business presentations. Clean design
Free with trial Graph line icon. Neumorphic, Blue gradient, 3d pin buttons. Column chart sign. Growth diagram symbol. Line icons. Neumorphic buttons with outline signs. Vector. Sale decrease vectors Graph line icon. Column chart sign. Line icons. Vector. Graph line icon. Neumorphic, Blue gradient, 3d pin buttons. Column chart sign. Growth diagram symbol. Line icons. Neumorphic buttons with outline signs. Vector
Free with trial Costs optimization icon set on white background. Eps 10 stock vector. Sale decrease vectors Costs optimization thin line icon set. Costs optimization icon set on white background. Eps 10 stock vector
Free with trial Costs optimization icon set on white background. Eps 10 stock vector. Sale decrease vectors Costs optimization thin line icon set. Costs optimization icon set on white background. Eps 10 stock vector
Free with trial Costs optimization icon set on white background. Eps 10 stock vector. Sale decrease vectors Costs optimization thin line icon set. Costs optimization icon set on white background. Eps 10 stock vector
Free with trial Black jagged badge with Percentage Sign Symbolizing Discount or Promotion. Sale decrease vectors Black jagged badge with Percentage Sign Symbolizing Discount or Promotion
Free with trial Discount Promotion Percentage Symbol in Starburst Shape Isolated on White. Sale decrease vectors Discount Promotion Percentage Symbol in Starburst Shape Isolated on White
Free with trial Man using smartphone with stock market chart overlay, holographic style, dark background. Concept of financial crisis and investment loss. Sale decrease illustrations Man holding smartphone with stock market chart overlay on dark background, showing financial crisis and market crash concept. Man using smartphone with stock market chart overlay, holographic style, dark background. Concept of financial crisis and investment loss
Free with trial Statistics line icon. Continuous line with share plane. Column chart sign. Growth graph diagram symbol. 3d star in speech bubble. Graph chart single line ribbon. Loop curve pattern. Vector. Sale decrease illustrations Statistics line icon. Column graph chart sign. Continuous line with plane. Vector. Statistics line icon. Continuous line with share plane. Column chart sign. Growth graph diagram symbol. 3d star in speech bubble. Graph chart single line ribbon. Loop curve pattern. Vector
Free with trial Statistics line icon. Continuous line with share plane. Column chart sign. Growth graph diagram symbol. 3d star in speech bubble. Graph chart single line ribbon. Loop curve pattern. Vector. Sale decrease illustrations Statistics line icon. Column graph chart sign. Continuous line with plane. Vector. Statistics line icon. Continuous line with share plane. Column chart sign. Growth graph diagram symbol. 3d star in speech bubble. Graph chart single line ribbon. Loop curve pattern. Vector
Free with trial Red arrow showing downward trend over supermarket shelves with scarce product. Economic crisis and inflation impact on food supply or demand. Sale decrease illustrations Red arrow showing downward trend over supermarket shelves with scarce product
Free with trial A human hand is shown presenting a vivid, glowing yellow percentage symbol, radiating light and prominence. In the background, a digital bar chart visually represents growth and data analysis, set against a dark, abstract backdrop with subtle bokeh lights. This image powerfully conveys concepts related to finance, interest rates, discounts, business growth, profit, and investment. It's perfect for illustrating financial reports, economic articles, banking promotions, or investment strategy presentations. Sale decrease illustrations Financial Growth and Interest Rates Concept with Glowing Percentage Symbol. A human hand is shown presenting a vivid, glowing yellow percentage symbol, radiating light and prominence. In the background, a digital bar chart visually represents growth and data analysis, set against a dark, abstract backdrop with subtle bokeh lights. This image powerfully conveys concepts related to finance, interest rates, discounts, business growth, profit, and investment. It's perfect for illustrating financial reports, economic articles, banking promotions, or investment strategy presentations.
Free with trial Hands on laptop with red stock charts and falling graphs overlaid, on a dark office desk background, concept of financial market crash and panic. Sale decrease illustrations Hands typing on laptop with financial stock market crash charts and graphs overlaid, indicating global economic crisis and. Hands on laptop with red stock charts and falling graphs overlaid, on a dark office desk background, concept of financial market crash and panic
Free with trial Laptop screen showing downward red stock chart and yellow trend line, with dark abstract background. Concept of market crash and recession. 3D Rendering. Sale decrease illustrations Laptop displaying red and yellow falling stock chart on dark geometric background, symbolizing financial crisis and market. Laptop screen showing downward red stock chart and yellow trend line, with dark abstract background. Concept of market crash and recession. 3D Rendering
Free with trial Report document line icon. Halftone dotted pattern. Gradient icon with grain shadow. Column graph sign. Growth diagram, pie chart symbol. Line report document icon. Various designs. Vector. Sale decrease vectors Report document line icon. Column graph sign. Halftone dotted pattern. Vector. Report document line icon. Halftone dotted pattern. Gradient icon with grain shadow. Column graph sign. Growth diagram, pie chart symbol. Line report document icon. Various designs. Vector
Free with trial Report document line icon. Halftone dotted pattern. Gradient icon with grain shadow. Column graph sign. Growth diagram, pie chart symbol. Line report document icon. Various designs. Vector. Sale decrease vectors Report document line icon. Column graph sign. Halftone dotted pattern. Vector. Report document line icon. Halftone dotted pattern. Gradient icon with grain shadow. Column graph sign. Growth diagram, pie chart symbol. Line report document icon. Various designs. Vector
Free with trial Down arrow with percentage symbol showing price reduction or discount offer. Sale decrease vectors Down arrow with percentage symbol showing price reduction or discount offer
Free with trial Wooden house model sits beside three percentage blocks on a light wooden table against a dark background, illustrating financial concepts. Sale decrease illustrations Wooden House Model and Percentage Blocks Representing Real Estate Interest. Wooden house model sits beside three percentage blocks on a light wooden table against a dark background, illustrating financial concepts
Free with trial Shiny blue percentage sign sits atop document suggesting discounts or interest rates This image conveys financial concepts for marketing and presentations. Sale decrease illustrations Percentage Sign on Document Business Finance Discount Concept. Shiny blue percentage sign sits atop document suggesting discounts or interest rates This image conveys financial concepts for marketing and presentations
Free with trial Percentage sign on the stack of coin bar chart and red graph trending downward with blur wall background on table. Economy recession crisis, inflation, stagflation, business and financial loss concept. Sale decrease illustrations Percentage sign on the stack of coin bar chart and red graph trending downward with blur wall background on table.
Free with trial Discount percentage icon. Down arrow symbol. Price reduction process. Vector gear illustration. EPS 10. Sale decrease vectors Discount percentage icon. Down arrow symbol. Price reduction process. Vector gear illustration.
Free with trial Energetic doodle percentage down arrow for online sales, discount, and download. Sale decrease vectors Energetic doodle percentage down arrow for online sales, discount, and download
Free with trial Percentage Symbol Entering Downward Arrow Box Representing Discount Reduction. Sale decrease vectors Percentage Symbol Entering Downward Arrow Box Representing Discount Reduction
Free with trial Concept of high interest rates and heavy loan payments, economic recession, risk of debt burden. Vector illustration. Sale decrease vectors Concept of high interest rates and heavy loan payments, economic recession, risk of debt burden.
Free with trial Revenue Decline line icon. Universal creative premium symbol. Vector sign icon logo template. Vector illustration. Sale decrease vectors Revenue Decline line icon. Universal creative premium symbol. Vector sign icon logo template. Vector illustration
Free with trial 3D rendering of a percentage symbol in blue and yellow, featuring rounded edges. Great for sales, discounts, or promotions. Sale decrease vectors Modern percentage symbol in blue and yellow colors on transparent background. 3D rendering of a percentage symbol in blue and yellow, featuring rounded edges. Great for sales, discounts, or promotions.
Free with trial A simple and clear vector icon representing a downturn in the housing market. Sale decrease illustrations Real Estate Market Decline Vector Icon. A simple and clear vector icon representing a downturn in the housing market
Free with trial Cost reduction concept. Cost wording on decreasing coins stacking. cost reduction concept which effect to product cost , profit , inflation and economy recession concept. Sale decrease illustrations Cost reduction concept. Cost wording on decreasing coins stacking. cost reduction concept which effect to product cost , profit
Free with trial Percentage symbol icon in circle shape abstract concept for discount or finance. Sale decrease vectors Percentage symbol icon in circle shape abstract concept for discount or finance
Free with trial Blue zigzag arrow pointing downward, 3D Rendering style, on digital dark grid background. Concept of financial crisis, market crash, and recession. Sale decrease illustrations Blue downward arrow symbolizing economic decline on virtual grid background, representing financial crisis, market crash, and. Blue zigzag arrow pointing downward, 3D Rendering style, on digital dark grid background. Concept of financial crisis, market crash, and recession
Free with trial A textured golden fifty-seven percent symbol rests on a peach background ideal for illustrating sales, discounts, or financial data. Sale decrease illustrations Golden Fifty-seven Percent Symbol on Peach Background for Sales and Promotions. A textured golden fifty-seven percent symbol rests on a peach background ideal for illustrating sales, discounts, or financial data
Free with trial Business graph data analysis on wooden desk with pencils, bananas and notebooks. Sale decrease illustrations Business graph data analysis on wooden desk with pencils, bananas and notebooks
Free with trial Set of Chart presentation, Report, Increase growth graph icons. Design shape elements. Graph line icons. Analytics testing, Falling demand, Pie chart report. Calendar statistics, Stats. Vector. Sale decrease vectors Graph line icons. Set of Chart presentation, Report and Increase growth graph icons. Design elements. Vector. Set of Chart presentation, Report, Increase growth graph icons. Design shape elements. Graph line icons. Analytics testing, Falling demand, Pie chart report. Calendar statistics, Stats. Vector
Free with trial Abstract red and yellow candlestick chart on dark background with descending arrow, representing global financial crisis and market crash. 3D Rendering. Sale decrease illustrations Abstract background showing downward yellow arrow and red candlestick chart indicating global financial crisis and stock market. Abstract red and yellow candlestick chart on dark background with descending arrow, representing global financial crisis and market crash. 3D Rendering
Free with trial Concept of interest rate reduction. Giant red arrow down, gold coins, balloons percent. Service price reduction, promotional announcement. Vector layout. Sale decrease vectors Concept of interest rate reduction. Giant red arrow down, gold coins, balloons percent
Free with trial Modern buildings in Moscow with financial graph overlay, showing market decline on blue background, symbolizing economic and investment crisis. Sale decrease illustrations Moscow city skyline with financial stock chart overlay depicting property market downturn and economic crisis impact on real. Modern buildings in Moscow with financial graph overlay, showing market decline on blue background, symbolizing economic and investment crisis
Free with trial Financial chart with red and yellow candlesticks and a downward yellow arrow, on a dark background, concept of market crash and recession. 3D Rendering. Sale decrease illustrations Abstract financial chart with red and yellow candlesticks showing a downward trend and falling market data on dark background. 3D. Financial chart with red and yellow candlesticks and a downward yellow arrow, on a dark background, concept of market crash and recession. 3D Rendering
Free with trial A graphic display of multiple red arrows pointing downwards, each featuring a percentage symbol. This visual metaphor suggests declining financial markets, price reductions, or negative trends. Sale decrease illustrations Red arrows with percentage symbols indicate market downturn or decreasing prices. A graphic display of multiple red arrows pointing downwards, each featuring a percentage symbol. This visual metaphor suggests declining financial markets, price reductions, or negative trends
Free with trial Luxury gold inscription tax on black podium, soft light, front view smooth background, 3d rendering. Sale decrease illustrations Luxury gold inscription tax on black podium, soft light, smooth background, 3d rendering
Free with trial Percent down icon vector set on white background. EPS 10. Sale decrease vectors Percent down icon isolated on white background. Percent down icon vector set on white background. EPS 10
Free with trial Percent down icon vector set on white background. EPS 10. Sale decrease vectors Percent down icon isolated on white background. Percent down icon vector set on white background. EPS 10
Free with trial A red arrow is pointing upward, with wooden blocks stacked below it. Concept of progress and growth, as the arrow rises and the blocks below it grow in size generated by AI. Sale decrease vectors A red arrow is pointing upward, with wooden blocks stacked below it generated by AI. A red arrow is pointing upward, with wooden blocks stacked below it. Concept of progress and growth, as the arrow rises and the blocks below it grow in size generated by AI
Free with trial Vintage film projector projecting a bright beam of light forming the text Black Friday. Concept of discounts and sales for this holiday. Sale decrease illustrations Vintage film projector projecting a bright beam of light forming the text Black Friday
Free with trial A 3D rendered gray percentage symbol is presented against a clean white background. The symbol is composed of two circles and a diagonal line, with subtle shading that gives it a three-dimensional appearance. The lighting highlights the smooth surfaces of the symbol. Sale decrease illustrations 3D Rendered Gray Percentage Symbol on White Background sign discount. A 3D rendered gray percentage symbol is presented against a clean white background. The symbol is composed of two circles and a diagonal line, with subtle shading that gives it a three-dimensional appearance. The lighting highlights the smooth surfaces of the symbol
Free with trial A series of red downward-pointing arrows, each featuring a white percent symbol, visually represent falling prices, sales, and economic decline. Sale decrease illustrations Red downward arrows with percent symbols indicate decreasing prices and discounts. A series of red downward-pointing arrows, each featuring a white percent symbol, visually represent falling prices, sales, and economic decline