Free with trial Math percentage sign hand drawn. calculation finance, statistics increase, decrease ratio math percentage sign vector sketch. isolated black illustration. Decrease illustrations Math percentage sign sketch hand drawn vector. Math percentage sign hand drawn. calculation finance, statistics increase, decrease ratio math percentage sign. math percentage sign hand drawn. calculation finance, statistics increase, decrease ratio math percentage sign vector sketch. isolated black illustration
Free with trial Golden dollar sign with red arrow pointing down. Financial crisis concept, recession chart, stock market crash symbol. Economic downturn, loss, decrease, risk, bad investment money. Decrease illustrations Golden dollar sign with red arrow pointing down. Financial crisis concept, recession chart, stock market crash symbol. Economic. Downturn, loss, decrease, risk
Free with trial Wooden blocks with arrow up, down icons sitting atop stacks of coins. Concept of financial growth decrease, economic market risk, business, banking, finance investment. Decrease illustrations Wooden blocks with arrow up, down icons sitting atop stacks of coins. Concept of financial growth decrease, economic market risk,. Business, banking, finance
Free with trial A line graph shows a steady increase in sales over the past five years while a corresponding bar graph demonstrates the decrease in operating expenses during the same period.. Vector. Decrease illustrations A line graph shows a steady increase in sales over the past five years while a corresponding bar graph demonstrates the. Decrease in operating expenses during. A line graph shows a steady increase in sales over the past five years while a corresponding bar graph demonstrates the decrease in operating expenses during the same period.. Vector
Free with trial A high-quality, hand-drawn vector graphic of a simple red arrow pointing downwards. This versatile image is ideal for various applications, including presentations, websites, social media posts, and infographics. The clean and minimalist style ensures seamless integration into any design project. Perfect for visually representing concepts such as decrease, decline, negative trends, or reduction. Download this royalty-free vector today!. Decrease illustrations Hand-drawn Red Down Arrow: Simple, Clean Vector Graphic for Presentations, Websites, and Social Media. Perfect for. A high-quality, hand-drawn vector graphic of. A high-quality, hand-drawn vector graphic of a simple red arrow pointing downwards. This versatile image is ideal for various applications, including presentations, websites, social media posts, and infographics. The clean and minimalist style ensures seamless integration into any design project. Perfect for visually representing concepts such as decrease, decline, negative trends, or reduction. Download this royalty-free vector today!
Free with trial Symbol percentage sign hand drawn. math calculation, finance statistics, increase decrease symbol percentage sign vector sketch. isolated color illustration. Decrease illustrations Symbol percentage sign sketch hand drawn vector. Symbol percentage sign hand drawn. math calculation, finance statistics, increase decrease symbol percentage. symbol percentage sign hand drawn. math calculation, finance statistics, increase decrease symbol percentage sign vector sketch. isolated color illustration
Free with trial Symbol percentage sign hand drawn. math calculation, finance statistics, increase decrease symbol percentage sign vector sketch. isolated black illustration. Decrease vectors Symbol percentage sign sketch hand drawn vector. Symbol percentage sign hand drawn. math calculation, finance statistics, increase decrease symbol percentage. symbol percentage sign hand drawn. math calculation, finance statistics, increase decrease symbol percentage sign vector sketch. isolated black illustration
Free with trial This compelling image depicts a visual representation of the current state of the real estate market. Wooden houses, symbolic of residential properties, are nestled within an empty shopping cart. A red downward-trending chart, overlaid with a soft bokeh effect, graphically illustrates the negative market trend. This visual narrative conveys a significant drop in sales, a decrease in property. Decrease illustrations Wooden Homes in Shopping Cart A Visual Representation of the Declining Real Estate Market and Reduced Demand. This compelling image depicts a visual. This compelling image depicts a visual representation of the current state of the real estate market. Wooden houses, symbolic of residential properties, are nestled within an empty shopping cart. A red downward-trending chart, overlaid with a soft bokeh effect, graphically illustrates the negative market trend. This visual narrative conveys a significant drop in sales, a decrease in property
Free with trial The "Vector Dollar Down Icon Symbol" is a graphical representation designed to indicate a decrease or downward trend related to financial aspects, specifically involving currency or value. Decrease vectors Vector Dollar Down Icon Symbol. The 'Vector Dollar Down Icon Symbol' is a graphical representation designed to indicate a decrease or downward trend related to. The "Vector Dollar Down Icon Symbol" is a graphical representation designed to indicate a decrease or downward trend related to financial aspects, specifically involving currency or value.
Free with trial Finance percentage sign hand drawn. statistics increase, decrease ratio, proportion interest finance percentage sign vector sketch. isolated color illustration. Decrease illustrations Finance percentage sign sketch hand drawn vector. Finance percentage sign hand drawn. statistics increase, decrease ratio, proportion interest finance percentage. finance percentage sign hand drawn. statistics increase, decrease ratio, proportion interest finance percentage sign vector sketch. isolated color illustration
Free with trial Finance percentage sign hand drawn. statistics increase, decrease ratio, proportion interest finance percentage sign vector sketch. isolated black illustration. Decrease illustrations Finance percentage sign sketch hand drawn vector. Finance percentage sign hand drawn. statistics increase, decrease ratio, proportion interest finance percentage. finance percentage sign hand drawn. statistics increase, decrease ratio, proportion interest finance percentage sign vector sketch. isolated black illustration
Free with trial Finance percentage sign hand drawn. statistics increase, decrease ratio, proportion interest finance percentage sign vector sketch. isolated color illustration. Decrease illustrations Finance percentage sign sketch hand drawn vector. Finance percentage sign hand drawn. statistics increase, decrease ratio, proportion interest finance percentage. finance percentage sign hand drawn. statistics increase, decrease ratio, proportion interest finance percentage sign vector sketch. isolated color illustration
Free with trial Red arrow pointing downward against dark background. Declining stock market graph represents financial loss. Economic downturn, business crisis concept, investment decrease budget. Decrease illustrations Red arrow pointing downward against dark background. Declining stock market graph represents financial loss. Economic downturn,. Business crisis concept. Red arrow pointing downward against dark background. Declining stock market graph represents financial loss. Economic downturn, business crisis concept, investment decrease budget.
Free with trial A fuel pump nozzle is positioned over a declining bar graph with a red arrow indicating a downward trend. This symbolizes decreasing gas prices and the impact on the economy and financial markets. Isolated on white. Decrease illustrations Fuel pump over graph isolated on white background. concept for gas price decrease, economy, finance, and business use cases. A fuel pump nozzle is positioned. A fuel pump nozzle is positioned over a declining bar graph with a red arrow indicating a downward trend. This symbolizes decreasing gas prices and the impact on the economy and financial markets. Isolated on white
Free with trial The up and down arrows represent movement and choices. The up arrow indicates an increase or forward direction, while the down arrow signifies a decrease or backward movement. Together, they guide users in navigating options or adjusting settings. Decrease illustrations Up down arrows symbol. The up and down arrows represent movement and choices. The up arrow indicates an increase or forward direction, while the down arrow. The up and down arrows represent movement and choices. The up arrow indicates an increase or forward direction, while the down arrow signifies a decrease or backward movement. Together, they guide users in navigating options or adjusting settings.
Free with trial The up and down arrows represent movement and choices. The up arrow indicates an increase or forward direction, while the down arrow signifies a decrease or backward movement. Together, they guide users in navigating options or adjusting settings. Decrease illustrations Up down arrows symbol. The up and down arrows represent movement and choices. The up arrow indicates an increase or forward direction, while the down arrow. The up and down arrows represent movement and choices. The up arrow indicates an increase or forward direction, while the down arrow signifies a decrease or backward movement. Together, they guide users in navigating options or adjusting settings.
Free with trial The up and down arrows represent movement and choices. The up arrow indicates an increase or forward direction, while the down arrow signifies a decrease or backward movement. Together, they guide users in navigating options or adjusting settings. Decrease illustrations Up down arrows symbol. The up and down arrows represent movement and choices. The up arrow indicates an increase or forward direction, while the down arrow. The up and down arrows represent movement and choices. The up arrow indicates an increase or forward direction, while the down arrow signifies a decrease or backward movement. Together, they guide users in navigating options or adjusting settings.
Free with trial The up and down arrows represent movement and choices. The up arrow indicates an increase or forward direction, while the down arrow signifies a decrease or backward movement. Together, they guide users in navigating options or adjusting settings. Decrease illustrations Up down arrows symbol. The up and down arrows represent movement and choices. The up arrow indicates an increase or forward direction, while the down arrow. The up and down arrows represent movement and choices. The up arrow indicates an increase or forward direction, while the down arrow signifies a decrease or backward movement. Together, they guide users in navigating options or adjusting settings.
Free with trial Intricate machinery hums with efficient energy usage a key factor in the companys goal to become carbon neutral and. Decrease its environmental AI generated. Decrease vectors Intricate machinery hums with efficient energy usage a key factor in the companys goal to become carbon neutral and. Decrease its environmental AI generated
Free with trial Creative downtrend red arrow, national colors of Germany and the European Union. As background as economy and crisis and decrease image symbolic. Decrease illustrations Creative downtrend red arrow, national colors of Germany and the European Union. As background as economy and crisis and decrease image symbolic
Free with trial Creative downtrend red arrow, national colors the European Union as background as economy and crisis and decrease. Creative downtrend red arrow, national colors. Decrease illustrations Creative downtrend red arrow, national colors the European Union as background as economy and crisis and decrease. Creative downtrend red arrow, national colors
Free with trial Statistics percentage sign hand drawn. increase decrease, ratio proportion, interest profit statistics percentage sign vector sketch. isolated black illustration. Decrease vectors Statistics percentage sign sketch hand drawn vector. Statistics percentage sign hand drawn. increase decrease, ratio proportion, interest profit statistics. statistics percentage sign hand drawn. increase decrease, ratio proportion, interest profit statistics percentage sign vector sketch. isolated black illustration
Free with trial Statistics percentage sign hand drawn. increase decrease, ratio proportion, interest profit statistics percentage sign vector sketch. isolated black illustration. Decrease illustrations Statistics percentage sign sketch hand drawn vector. Statistics percentage sign hand drawn. increase decrease, ratio proportion, interest profit statistics. statistics percentage sign hand drawn. increase decrease, ratio proportion, interest profit statistics percentage sign vector sketch. isolated black illustration
Free with trial Statistics percentage sign hand drawn. increase decrease, ratio proportion, interest profit statistics percentage sign vector sketch. isolated color illustration. Decrease vectors Statistics percentage sign sketch hand drawn vector. Statistics percentage sign hand drawn. increase decrease, ratio proportion, interest profit statistics. statistics percentage sign hand drawn. increase decrease, ratio proportion, interest profit statistics percentage sign vector sketch. isolated color illustration
Free with trial Statistics percentage sign hand drawn. increase decrease, ratio proportion, interest profit statistics percentage sign vector sketch. isolated black illustration. Decrease illustrations Statistics percentage sign sketch hand drawn vector. Statistics percentage sign hand drawn. increase decrease, ratio proportion, interest profit statistics. statistics percentage sign hand drawn. increase decrease, ratio proportion, interest profit statistics percentage sign vector sketch. isolated black illustration
Free with trial Simple icon of a cooling system, represented by three arrows pointing down to a snowflake, ideal for visualizing temperature decrease. Decrease vectors Three arrows pointing down to snowflake representing cooling system. Simple icon of a cooling system, represented by three arrows pointing down to a snowflake. Simple icon of a cooling system, represented by three arrows pointing down to a snowflake, ideal for visualizing temperature decrease
Free with trial Abstract financial background with arrows going forward. Concept decrease. Vector illustration. Abstract background with white paper arrows. Decrease vectors Abstract financial background with arrows Concept decrease. Vector illustration. Abstract financial background with arrows going forward. Concept decrease. Abstract financial background with arrows going forward. Concept decrease. Vector illustration. Abstract background with white paper arrows.
Free with trial Price low down icon concept. Interest low price 3d percent discount. Icon reduction arrow decrease render symbol finance. Decrease vectors Price low down icon concept. Interest low price 3d percent discount. Icon reduction arrow decrease render symbol finance
Free with trial Price low down icon concept. Interest low price 3d percent discount. Icon reduction arrow decrease render symbol finance. Decrease illustrations Price low down icon concept. Interest low price 3d percent discount. Icon reduction arrow decrease render symbol finance
Free with trial Price low down icon concept. Interest low price 3d percent discount. Icon reduction arrow decrease render symbol finance. Decrease vectors Price low down icon concept. Interest low price 3d percent discount. Icon reduction arrow decrease render symbol finance
Free with trial Price low down icon concept. Interest low price 3d percent discount. Icon reduction arrow decrease render symbol finance. Decrease vectors Price low down icon concept. Interest low price 3d percent discount. Icon reduction arrow decrease render symbol finance
Free with trial Calculation percentage sign hand drawn. finance statistics, increase decrease, ratio proportion calculation percentage sign vector sketch. isolated color illustration. Decrease illustrations Calculation percentage sign sketch hand drawn vector. Calculation percentage sign hand drawn. finance statistics, increase decrease, ratio proportion calculation. calculation percentage sign hand drawn. finance statistics, increase decrease, ratio proportion calculation percentage sign vector sketch. isolated color illustration
Free with trial Calculation percentage sign hand drawn. finance statistics, increase decrease, ratio proportion calculation percentage sign vector sketch. isolated color illustration. Decrease vectors Calculation percentage sign sketch hand drawn vector. Calculation percentage sign hand drawn. finance statistics, increase decrease, ratio proportion calculation. calculation percentage sign hand drawn. finance statistics, increase decrease, ratio proportion calculation percentage sign vector sketch. isolated color illustration
Free with trial Calculation percentage sign hand drawn. finance statistics, increase decrease, ratio proportion calculation percentage sign vector sketch. isolated black illustration. Decrease illustrations Calculation percentage sign sketch hand drawn vector. Calculation percentage sign hand drawn. finance statistics, increase decrease, ratio proportion calculation. calculation percentage sign hand drawn. finance statistics, increase decrease, ratio proportion calculation percentage sign vector sketch. isolated black illustration
Free with trial Calculation percentage sign hand drawn. finance statistics, increase decrease, ratio proportion calculation percentage sign vector sketch. isolated color illustration. Decrease illustrations Calculation percentage sign sketch hand drawn vector. Calculation percentage sign hand drawn. finance statistics, increase decrease, ratio proportion calculation. calculation percentage sign hand drawn. finance statistics, increase decrease, ratio proportion calculation percentage sign vector sketch. isolated color illustration
Free with trial Set Global economic crisis Dollar rate decrease Drop in crude oil price Tearing money banknote Employee dismissal Mobile stock trading and Falling property prices icon. Vector. Decrease vectors Set Global economic crisis, Dollar rate decrease, Drop in crude oil price, Tearing money banknote, Employee dismissal. Set Global economic crisis Dollar rate. Set Global economic crisis Dollar rate decrease Drop in crude oil price Tearing money banknote Employee dismissal Mobile stock trading and Falling property prices icon. Vector.
Free with trial Set line Mobile phone Magnifying glass with check mark Laptop browser window Secure your site HTTPS SSL Financial growth decrease Browser shield and Online shopping screen icon. Vector. Decrease illustrations Set line Mobile phone, Magnifying glass with check mark, Laptop browser window, Secure your site HTTPS, SSL, Financial. Set line Mobile phone Magnifying glass. Set line Mobile phone Magnifying glass with check mark Laptop browser window Secure your site HTTPS SSL Financial growth decrease Browser shield and Online shopping screen icon. Vector.
Free with trial Flat lay view of several bitter melon slices and a green leaf. Bitter melon (Momordica charantia) is low in calories and high in fibers, which helps decrease body weight. Decrease illustrations Bitter melon (Momordica charantia) is full of antioxidants. Flat lay view of several bitter melon slices and a green leaf. Bitter melon (Momordica charantia) is. Flat lay view of several bitter melon slices and a green leaf. Bitter melon (Momordica charantia) is low in calories and high in fibers, which helps decrease body weight
Free with trial Illustrating a financial downturn with descending blocks. The image conveys a sense of economic decline, investment risk, and potential market instability. A visual representation of financial loss. Decrease illustrations Stock market decline concept showing decrease in value and investment risk with downward trend diagram. Illustrating a financial downturn with descending blocks. Illustrating a financial downturn with descending blocks. The image conveys a sense of economic decline, investment risk, and potential market instability. A visual representation of financial loss.
Free with trial Finance economy crisis, financial decrease, rate business fall, money failure, inflation or devaluation, investment loss. Generative Ai. Decrease illustrations Finance economy crisis, financial decrease, rate business fall, money failure, inflation or devaluation, investment loss. Generative Ai
Free with trial Black and white bitcoin coin with a blue downward arrow indicating a decrease in value. Ideal for economic trends, cryptocurrency market analysis, financial decline, forex trading, money management. Decrease vectors Bitcoin Price Drop Representation with Blue Downward Arrow and Coin Illustration. Black and white bitcoin coin with a blue downward arrow indicating a decrease. Black and white bitcoin coin with a blue downward arrow indicating a decrease in value. Ideal for economic trends, cryptocurrency market analysis, financial decline, forex trading, money management
Free with trial Set line Stop delivery cargo truck Dollar rate decrease Money bomb dollar crisis Hanging sign with Sale Mobile stock trading Drop crude oil price and Glass money jar coin icon. Vector. Decrease illustrations Set line Stop delivery cargo truck, Dollar rate decrease, Money bomb dollar crisis, Hanging sign with Sale, Mobile stock. Set line Stop delivery cargo truck. Set line Stop delivery cargo truck Dollar rate decrease Money bomb dollar crisis Hanging sign with Sale Mobile stock trading Drop crude oil price and Glass money jar coin icon. Vector.
Free with trial Description: This image captures the essence of a home finance crisis, depicting an empty shopping cart against a backdrop of decreasing financial charts. The symbolism behind this composition conveys the impact of economic downturn on household finances, highlighting the struggle and uncertainty faced by individuals during such challenging times. The visual representation serves as a reminder of the importance of financial planning and stability in maintaining a secure future. Decrease illustrations Home Finance Crisis: Empty Cart Charting Decrease. Description: This image captures the essence of a home finance crisis, depicting an empty shopping cart. Description: This image captures the essence of a home finance crisis, depicting an empty shopping cart against a backdrop of decreasing financial charts. The symbolism behind this composition conveys the impact of economic downturn on household finances, highlighting the struggle and uncertainty faced by individuals during such challenging times. The visual representation serves as a reminder of the importance of financial planning and stability in maintaining a secure future.
Free with trial Description: This image captures the essence of a home finance crisis, depicting an empty shopping cart against a backdrop of decreasing financial charts. The symbolism behind this composition conveys the impact of economic downturn on household finances, highlighting the struggle and uncertainty faced by individuals during such challenging times. The visual representation serves as a reminder of the importance of financial planning and stability in maintaining a secure future. Decrease illustrations Home Finance Crisis: Empty Cart Charting Decrease. Description: This image captures the essence of a home finance crisis, depicting an empty shopping cart. Description: This image captures the essence of a home finance crisis, depicting an empty shopping cart against a backdrop of decreasing financial charts. The symbolism behind this composition conveys the impact of economic downturn on household finances, highlighting the struggle and uncertainty faced by individuals during such challenging times. The visual representation serves as a reminder of the importance of financial planning and stability in maintaining a secure future.
Free with trial Description: This image captures the essence of a home finance crisis, depicting an empty shopping cart against a backdrop of decreasing financial charts. The symbolism behind this composition conveys the impact of economic downturn on household finances, highlighting the struggle and uncertainty faced by individuals during such challenging times. The visual representation serves as a reminder of the importance of financial planning and stability in maintaining a secure future. Decrease illustrations Home Finance Crisis: Empty Cart Charting Decrease. Description: This image captures the essence of a home finance crisis, depicting an empty shopping cart. Description: This image captures the essence of a home finance crisis, depicting an empty shopping cart against a backdrop of decreasing financial charts. The symbolism behind this composition conveys the impact of economic downturn on household finances, highlighting the struggle and uncertainty faced by individuals during such challenging times. The visual representation serves as a reminder of the importance of financial planning and stability in maintaining a secure future.
Free with trial Description: This image captures the essence of a home finance crisis, depicting an empty shopping cart against a backdrop of decreasing financial charts. The symbolism behind this composition conveys the impact of economic downturn on household finances, highlighting the struggle and uncertainty faced by individuals during such challenging times. The visual representation serves as a reminder of the importance of financial planning and stability in maintaining a secure future. Decrease illustrations Home Finance Crisis: Empty Cart Charting Decrease. Description: This image captures the essence of a home finance crisis, depicting an empty shopping cart. Description: This image captures the essence of a home finance crisis, depicting an empty shopping cart against a backdrop of decreasing financial charts. The symbolism behind this composition conveys the impact of economic downturn on household finances, highlighting the struggle and uncertainty faced by individuals during such challenging times. The visual representation serves as a reminder of the importance of financial planning and stability in maintaining a secure future.
Free with trial Graphical depiction of declining gold prices Three labeled gold bars on line graph showing downturn trend Red arrow indicates decrease against grid patterned background, suggesting financial or economic analysis related to gold markets For Social Media Post Size. Decrease illustrations Declining gold prices depicted with red arrow, gold bars, downturn trend. Graphical depiction of declining gold prices Three labeled gold bars on line graph. Graphical depiction of declining gold prices Three labeled gold bars on line graph showing downturn trend Red arrow indicates decrease against grid patterned background, suggesting financial or economic analysis related to gold markets For Social Media Post Size
Free with trial A bright yellow arrow curves downwards indicating a downward trend, decrease, or decline. Ideal for presentations on finance, market analysis, or performance changes. Decrease illustrations Yellow arrow pointing downward showing a decline or falling trend. A bright yellow arrow curves downwards indicating a downward trend, decrease, or decline. A bright yellow arrow curves downwards indicating a downward trend, decrease, or decline. Ideal for presentations on finance, market analysis, or performance changes
Free with trial A police department is using data analysis to track traffic violations and target areas with high rates of accidents resulting in a decrease in trafficrelated crimes.. Vector illustration. Decrease vectors A police department is using data analysis to track traffic violations and target areas with high rates of accidents. Resulting in a decrease in trafficrelated. A police department is using data analysis to track traffic violations and target areas with high rates of accidents resulting in a decrease in trafficrelated crimes.. Vector illustration
Free with trial Two distinct lines illustrate a decrease and an increase, creating a dynamic contrast in shades of orange that captures attention and represents change. Decrease illustrations Visual Representation of Contrasting Trends With Realistic Orange Hues. Two distinct lines illustrate a decrease and an increase, creating a dynamic contrast in. Two distinct lines illustrate a decrease and an increase, creating a dynamic contrast in shades of orange that captures attention and represents change
Free with trial Woman using laptop with virtual global map, CO2 reduce icons. Concept of decrease carbon dioxide emission, carbon footprint, carbon credit, go green technology innovation, natural resources, ecology. Decrease illustrations Woman using laptop with virtual global map, CO2 reduce icons. Concept of decrease carbon dioxide emission, carbon footprint,. Carbon credit, go green technology. Woman using laptop with virtual global map, CO2 reduce icons. Concept of decrease carbon dioxide emission, carbon footprint, carbon credit, go green technology innovation, natural resources, ecology
Free with trial Diversity Decline Two pie charts showing the demographic distribution of a neighborhood before and after gentrification highlighting the decrease in diversity as affluent newcomers. Decrease vectors Diversity Decline Two pie charts showing the demographic distribution of a neighborhood before and after gentrification. Highlighting the decrease in diversity
Free with trial Set Dollar rate decrease Mobile stock trading Shutdown of factory Gold bars Debt ball chained coin Broken piggy bank and Global economic crisis icon. Vector. Decrease illustrations Set Dollar rate decrease, Mobile stock trading, Shutdown of factory, Gold bars, Debt ball chained coin, Broken piggy. Set Dollar rate decrease Mobile stock. Set Dollar rate decrease Mobile stock trading Shutdown of factory Gold bars Debt ball chained coin Broken piggy bank and Global economic crisis icon. Vector.
Free with trial Potential bank failure, financial crisis, decrease in investor confidence,. Decrease vectors Potential bank failure, financial crisis, decrease in investor confidence,. Potential bank failure, financial crisis, decrease in investor confidence
Free with trial Creative downtrend red arrow, national colors of Germany and the European Union as background as economy and crisis and decrease. Creative downtrend red arrow. Decrease illustrations Creative downtrend red arrow, national colors of Germany and the European Union as background as economy and crisis and decrease. Creative downtrend red arrow
Free with trial Set Prison cell door, Dollar rate decrease, Calculation of expenses and Drop in crude oil price on seamless pattern. Vector. Decrease illustrations Set Prison cell door, Dollar rate decrease, Calculation of expenses and Drop in crude oil price on seamless pattern. Vector
Free with trial Set Calculation of expenses Global economic crisis news Dollar rate decrease Bank building and Debt ball chained to coin icon. Vector. Decrease illustrations Set Calculation of expenses, Global economic crisis, news, Dollar rate decrease, Bank building, and Debt ball chained to. Set Calculation of expenses Global. Set Calculation of expenses Global economic crisis news Dollar rate decrease Bank building and Debt ball chained to coin icon. Vector.
Free with trial This dynamic 3D animation offers a unique perspective on the impact of the pandemic on San Francisco. From a breathtaking aerial viewpoint, witness the city transformed. The vivid visualization showcases the spread of the virus through 3D motion graphics, highlighting the dramatic decrease in urban activity. Empty streets, deserted parks, and reduced traffic flow are beautifully represented,. Decrease illustrations San Francisco Under Lockdown A 3D Visualization of Pandemic Impacts on a Cityscape Showing COVID19 Virus Spread and. This dynamic 3D animation offers a unique. This dynamic 3D animation offers a unique perspective on the impact of the pandemic on San Francisco. From a breathtaking aerial viewpoint, witness the city transformed. The vivid visualization showcases the spread of the virus through 3D motion graphics, highlighting the dramatic decrease in urban activity. Empty streets, deserted parks, and reduced traffic flow are beautifully represented,
Free with trial Economy, balloons or man on graph for crisis, stock market investment or inflation on white background. Financial decrease, crash or trader on charts for price drop or crypto profit risk in studio. Decrease illustrations Economy, balloons or man on graph for crisis, stock market investment or inflation on white background. Financial. Decrease, crash or trader on charts for price. Economy, balloons or man on graph for crisis, stock market investment or inflation on white background. Financial decrease, crash or trader on charts for price drop or crypto profit risk in studio.
Free with trial High-Quality Vector Icons Collection with Editable Stroke. Ideal for Professional and Creative Projects. Decrease vectors Increase and decrease icons High-Quality Vector Icons Collection with Editable Stroke. Ideal for Professional and. High-Quality Vector Icons Collection with. High-Quality Vector Icons Collection with Editable Stroke. Ideal for Professional and Creative Projects.
Free with trial A striking red downward arrow breaks through charts and data, symbolizing a sharp decrease in market values or performance metrics during a financial analysis session. Decrease illustrations Red downward arrow indicates a sudden decline in market performance and trends. A striking red downward arrow breaks through charts and data, symbolizing a sharp. A striking red downward arrow breaks through charts and data, symbolizing a sharp decrease in market values or performance metrics during a financial analysis session.
Free with trial A visual representation of financial decrease with stacks of golden coins, symbolizing economic decline and instability now. Decrease illustrations Financial decrease concept with stacked golden coins representing economic decline now isolated on white background. A visual representation of financial. a visual representation of financial decrease with stacks of golden coins, symbolizing economic decline and instability now
Free with trial A focused image of a map with colorful lines connecting production facilities to local distribution centers symbolizing. The decrease in AI generated. Decrease vectors A focused image of a map with colorful lines connecting production facilities to local distribution centers symbolizing. The decrease in AI generated
Free with trial Businessman falls from a stack of coins. Financial crisis. Decrease in capital. Decrease vectors Businessman falls from a stack of coins. Financial crisis. Decrease in capital. Businessman falls from a stack of coins. Financial crisis. Decrease in capital
Free with trial Housing price falling down, Businessman investor and homeowner experiencing a decrease in the housing market. Decrease vectors Housing price falling down, Businessman investor and homeowner experiencing a decrease in the housing market.
Free with trial This visually striking graph displays two contrasting trends one line shows a sharp decrease while the other illustrates a significant increase in an engaging orange palette. Decrease illustrations Dynamic Trends of Change Illustrated Through Contrasting Lines in Orange Hues. This visually striking graph displays two contrasting trends one line shows a. This visually striking graph displays two contrasting trends one line shows a sharp decrease while the other illustrates a significant increase in an engaging orange palette
Free with trial An illustration depicting deflation, which is a decrease in the general price level of goods and services within an economy , beautiful background. Decrease illustrations Economic Downturn. Deflation concept. An illustration depicting deflation, which is a decrease in the general price level of goods and services within an economy. An illustration depicting deflation, which is a decrease in the general price level of goods and services within an economy , beautiful background
Free with trial Economic Downturn. Deflation concept. A visual representation of deflation, showing a decrease in the general pricing and economic activity , high resolution. Decrease illustrations Economic Downturn. Deflation concept. A visual representation of deflation, showing a decrease in the general pricing and economic activity , high resolution
Free with trial This image symbolizes deflation, which is a decrease in the general price level of goods and services in an economy. The deflating balloon represents the shrinking purchasing power and overall , refined elegance. Decrease illustrations Economic Downturn. Deflation concept. This image symbolizes deflation, which is a decrease in the general price level of goods and services in an economy. The. This image symbolizes deflation, which is a decrease in the general price level of goods and services in an economy. The deflating balloon represents the shrinking purchasing power and overall , refined elegance
Free with trial Anxious Trader Female Character Panics As Ethereum Cryptocurrency Price Decrease, Fearing Financial Loss And Uncertainty In Market, Exacerbating The Downward Trend. Cartoon People Vector Illustration. Decrease vectors Anxious Trader Female Character Panics As Cryptocurrency Prices Decrease, Fearing Financial Loss And Uncertainty. Anxious Trader Female Character Panics As. Anxious Trader Female Character Panics As Ethereum Cryptocurrency Price Decrease, Fearing Financial Loss And Uncertainty In Market, Exacerbating The Downward Trend. Cartoon People Vector Illustration
Free with trial CO2 reducing icon on green leaf with water droplet for decrease CO2 , carbon footprint and carbon credit to limit global warming from climate change, Bio Circular Green Economy concept. Decrease illustrations Circular economy icon on nature, reducing CO2, carbon footprint & carbon credit to limit global warming due to climate change. CO2 reducing icon on green leaf. CO2 reducing icon on green leaf with water droplet for decrease CO2 , carbon footprint and carbon credit to limit global warming from climate change, Bio Circular Green Economy concept.
Free with trial A striking red downward arrow is prominently placed on a chart highlighting a notable decrease in financial metrics over time suggesting a troubling trend in market analysis. Decrease illustrations A striking red downward arrow is prominently placed on a chart highlighting a notable decrease in financial metrics over time. Suggesting a troubling trend in
Free with trial Percentage sign set hand drawn. math calculation, finance statistics, increase decrease percentage sign vector sketch. isolated black illustration. Decrease illustrations Percentage sign set sketch hand drawn vector. Percentage sign set hand drawn. math calculation, finance statistics, increase decrease percentage sign vector. percentage sign set hand drawn. math calculation, finance statistics, increase decrease percentage sign vector sketch. isolated black illustration
Free with trial Upgrade your vehicle's aesthetic and comfort with premium ceramic car window film. This innovative tint technology significantly reduces solar heat, keeping your interior cool and comfortable during the hottest days. Experience a noticeable decrease in interior temperature, contributing to improved fuel efficiency. Ceramic film's exceptional heat rejection properties are a game-changer for. Decrease illustrations Transform Your Ride with Ceramic Car Window Tint Superior Heat Rejection UV Protection and Enhanced Style. Upgrade your vehicle's aesthetic and comfort with. Upgrade your vehicle's aesthetic and comfort with premium ceramic car window film. This innovative tint technology significantly reduces solar heat, keeping your interior cool and comfortable during the hottest days. Experience a noticeable decrease in interior temperature, contributing to improved fuel efficiency. Ceramic film's exceptional heat rejection properties are a game-changer for
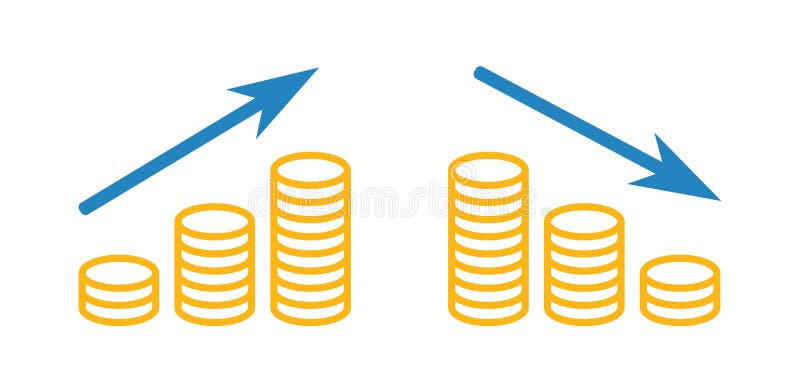
Free with trial Profit increase and decrease graph, coin icon. Decrease vectors Profit increase and decrease graph. Coin icon
Free with trial Profit increase and decrease graph, coin icon. Decrease vectors Profit increase and decrease graph. Coin icon
Free with trial Math percentage sign hand drawn. calculation finance, statistics increase, decrease ratio math percentage sign vector sketch. isolated color illustration. Decrease illustrations Math percentage sign sketch hand drawn vector. Math percentage sign hand drawn. calculation finance, statistics increase, decrease ratio math percentage sign. math percentage sign hand drawn. calculation finance, statistics increase, decrease ratio math percentage sign vector sketch. isolated color illustration
Free with trial Math percentage sign hand drawn. calculation finance, statistics increase, decrease ratio math percentage sign vector sketch. isolated black illustration. Decrease vectors Math percentage sign sketch hand drawn vector. Math percentage sign hand drawn. calculation finance, statistics increase, decrease ratio math percentage sign. math percentage sign hand drawn. calculation finance, statistics increase, decrease ratio math percentage sign vector sketch. isolated black illustration
Free with trial Math percentage sign hand drawn. calculation finance, statistics increase, decrease ratio math percentage sign vector sketch. isolated black illustration. Decrease illustrations Math percentage sign sketch hand drawn vector. Math percentage sign hand drawn. calculation finance, statistics increase, decrease ratio math percentage sign. math percentage sign hand drawn. calculation finance, statistics increase, decrease ratio math percentage sign vector sketch. isolated black illustration
Free with trial This high-quality vector graphic features a simple, hand-drawn red arrow pointing downwards. It's perfect for illustrating decline, decrease, or negative trends in presentations, reports, websites, and infographics. The clean and minimalist style ensures versatility across various design projects. Easily scalable and editable, this vector graphic is a valuable addition to any designer's toolkit. Its simple design makes it suitable for a wide range of applications and audiences. Decrease illustrations Hand-Drawn Red Down Arrow: Simple, Clean, and Versatile Vector Graphic for Presentations, Websites, and More. Perfect. This high-quality vector graphic features. This high-quality vector graphic features a simple, hand-drawn red arrow pointing downwards. It's perfect for illustrating decline, decrease, or negative trends in presentations, reports, websites, and infographics. The clean and minimalist style ensures versatility across various design projects. Easily scalable and editable, this vector graphic is a valuable addition to any designer's toolkit. Its simple design makes it suitable for a wide range of applications and audiences.
 Sign in