Free with trial Multipurpose Venn diagram schema template with five oval sets and their intersections, detailed descriptions and sample texts. Separate data sets vectors Multipurpose Venn diagram schema template with five elements. Multipurpose Venn diagram schema template with five oval sets and their intersections, detailed descriptions and sample texts
Free with trial Multipurpose Venn diagram dark schema template green and red circle sets with purple intersection, detailed descriptions and sample texts. Separate data sets vectors Multipurpose Venn diagram schema template. Multipurpose Venn diagram dark schema template green and red circle sets with purple intersection, detailed descriptions and sample texts
Free with trial Multipurpose Venn diagram schema template with three circles blue and red circle sets with purple intersection, detailed descriptions and sample texts. Separate data sets vectors Multipurpose Venn diagram schema template with three circles
Free with trial The image shows multiple types of charts and graphs, including bar charts, line graphs, scatter plots, and histograms. Each chart is displayed in a separate box and appears to represent different data sets or statistical analyses, suggesting a focus on data visualization and comparative analysis. Separate data sets illustrations A collection of various charts and graphs representing different data sets and trends. The image shows multiple types of charts and graphs, including bar charts, line graphs, scatter plots, and histograms. Each chart is displayed in a separate box and appears to represent different data sets or statistical analyses, suggesting a focus on data visualization and comparative analysis
Free with trial The image shows four separate bar charts, each with bars of different colors and heights. The first chart features a gradient from orange to red, showing an increasing trend. The second chart has blue bars that increase and then decrease slightly. The third chart uses green bars with a steady upward trend. The fourth chart combines purple and blue bars, showing a fluctuating pattern with an. Separate data sets illustrations Colorful bar charts displaying varying data trends across four distinct sets. The image shows four separate bar charts, each with bars of different colors and heights. The first chart features a gradient from orange to red, showing an increasing trend. The second chart has blue bars that increase and then decrease slightly. The third chart uses green bars with a steady upward trend. The fourth chart combines purple and blue bars, showing a fluctuating pattern with an
Free with trial The image displays three separate maps of the United States, each representing different data sets or visualizations. The first map on the left uses varying shades of gray to indicate different intensity levels, with the darkest regions concentrated in the northeast and parts of the west. The middle map is predominantly gray with a single red line tracing a path across the country, suggesting. Separate data sets illustrations Three side-by-side maps of the united states showing different data visualizations. The image displays three separate maps of the United States, each representing different data sets or visualizations. The first map on the left uses varying shades of gray to indicate different intensity levels, with the darkest regions concentrated in the northeast and parts of the west. The middle map is predominantly gray with a single red line tracing a path across the country, suggesting
Free with trial A flat vector-style illustration of a light blue easel standing on a white background, featuring a whiteboard surface that displays a colorful pie chart, several circular data points, and two separate sets of vertical bar graphs, representing business presentation, data analysis, and educational planning. Separate data sets illustrations A colorful presentation easel display featuring various business charts and graphical data analytics. A flat vector-style illustration of a light blue easel standing on a white background, featuring a whiteboard surface that displays a colorful pie chart, several circular data points, and two separate sets of vertical bar graphs, representing business presentation, data analysis, and educational planning
Free with trial A flat vector-style illustration of a light blue easel standing on a white background, featuring a whiteboard surface that displays a colorful pie chart, several circular data points, and two separate sets of vertical bar graphs, representing business presentation, data analysis, and educational planning. Separate data sets illustrations A colorful presentation easel display featuring various business charts and graphical data analytics. A flat vector-style illustration of a light blue easel standing on a white background, featuring a whiteboard surface that displays a colorful pie chart, several circular data points, and two separate sets of vertical bar graphs, representing business presentation, data analysis, and educational planning
Free with trial Two separate groups of interconnected colored spheres representing distinct digital communities or data sets. Clean white background highlights sophisticated networking and structural concepts. Separate data sets vectors Dual cluster geometric network with green and turquoise gradient spheres on white. Two separate groups of interconnected colored spheres representing distinct digital communities or data sets. Clean white background highlights sophisticated networking and structural concepts
Free with trial A distinct vector illustration of a green briefcase, featuring a keyhole and a separate lock icon, emphasizing security and protection. This graphic is ideal for themes related to business confidentiality, digital security, or valuable asset management, providing a clear visual representation of safeguarded information or items, vector design Generative AI. Separate data sets vectors Green Briefcase with Key & Lock Security Icon, vector design Generative AI. A distinct vector illustration of a green briefcase, featuring a keyhole and a separate lock icon, emphasizing security and protection. This graphic is ideal for themes related to business confidentiality, digital security, or valuable asset management, providing a clear visual representation of safeguarded information or items, vector design Generative AI
Free with trial A striking, dark background with a vertical ribbed texture that transitions horizontally from a deep black on the left to a vibrant, intense blue on the right. Two separate vertical sets of three horizontal, glowing red light elements with a pronounced scan line or digital texture are positioned across this gradient. The duality of the red light patterns against the changing dark-to-blue background creates a highly digital, futuristic, and energetic visual, suggesting data transfer, sci-fi interface, or audio visualization. Separate data sets illustrations Dual Red Scan Lines on Dark Gradient Background. A striking, dark background with a vertical ribbed texture that transitions horizontally from a deep black on the left to a vibrant, intense blue on the right. Two separate vertical sets of three horizontal, glowing red light elements with a pronounced scan line or digital texture are positioned across this gradient. The duality of the red light patterns against the changing dark-to-blue background creates a highly digital, futuristic, and energetic visual, suggesting data transfer, sci-fi interface, or audio visualization.
Free with trial This stunning 3D visualization captures the essence of business expansion and financial upward trajectory using highly reflective metallic elements. Rendered by Ai. The dramatic composition features two separate sets of bar graphs connected by an ascending line chart culminating in sharp growth arrows against a soft gradient sky background. It perfectly symbolizes investment return strategic. Separate data sets illustrations Dynamic 3D growth charts rising toward success. This stunning 3D visualization captures the essence of business expansion and financial upward trajectory using highly reflective metallic elements. Rendered by Ai. The dramatic composition features two separate sets of bar graphs connected by an ascending line chart culminating in sharp growth arrows against a soft gradient sky background. It perfectly symbolizes investment return strategic
Free with trial This image showcases a striking 3D rendering featuring two sets of colorful bar graphs, one in shades of pink and the other in orange. These graphs are artfully embedded within wave-like, layered forms, creating a visually interesting contrast between the rigid geometry of the bars and the fluidity of the surrounding shapes. The graphs are positioned on separate, circular platforms, and a small, idyllic island with several evergreen trees sits between them, adding a touch of nature to the otherwise abstract composition. The overall aesthetic is minimalist and modern, suggesting a conceptual representation of financial growth within a natural context. Separate data sets illustrations Abstract 3D Render of Financial Growth Represented by Colorful Bar Graphs Nestled in Stylized Landscapes. This image showcases a striking 3D rendering featuring two sets of colorful bar graphs, one in shades of pink and the other in orange. These graphs are artfully embedded within wave-like, layered forms, creating a visually interesting contrast between the rigid geometry of the bars and the fluidity of the surrounding shapes. The graphs are positioned on separate, circular platforms, and a small, idyllic island with several evergreen trees sits between them, adding a touch of nature to the otherwise abstract composition. The overall aesthetic is minimalist and modern, suggesting a conceptual representation of financial growth within a natural context.
Free with trial A laptop displaying multiple blue and white graphs on its screen, including bar and line charts. The four separate graphs illustrate different data sets, depicting trends and comparisons. The laptop is set against a light blue, circular background. The charts feature grid lines and numerical axes, indicating various data points and measurements. The device is a modern design with a black keyboard and a slim silver bezel, symbolizing data analysis or business presentations. Separate data sets illustrations Generated image. A laptop displaying multiple blue and white graphs on its screen, including bar and line charts. The four separate graphs illustrate different data sets, depicting trends and comparisons. The laptop is set against a light blue, circular background. The charts feature grid lines and numerical axes, indicating various data points and measurements. The device is a modern design with a black keyboard and a slim silver bezel, symbolizing data analysis or business presentations.
Free with trial Multipurpose dark Venn diagram schema template with three circles green red and yellow circle sets with intersection, detailed descriptions and sample texts. Separate data sets vectors Multipurpose dark Venn diagram schema template with three circles
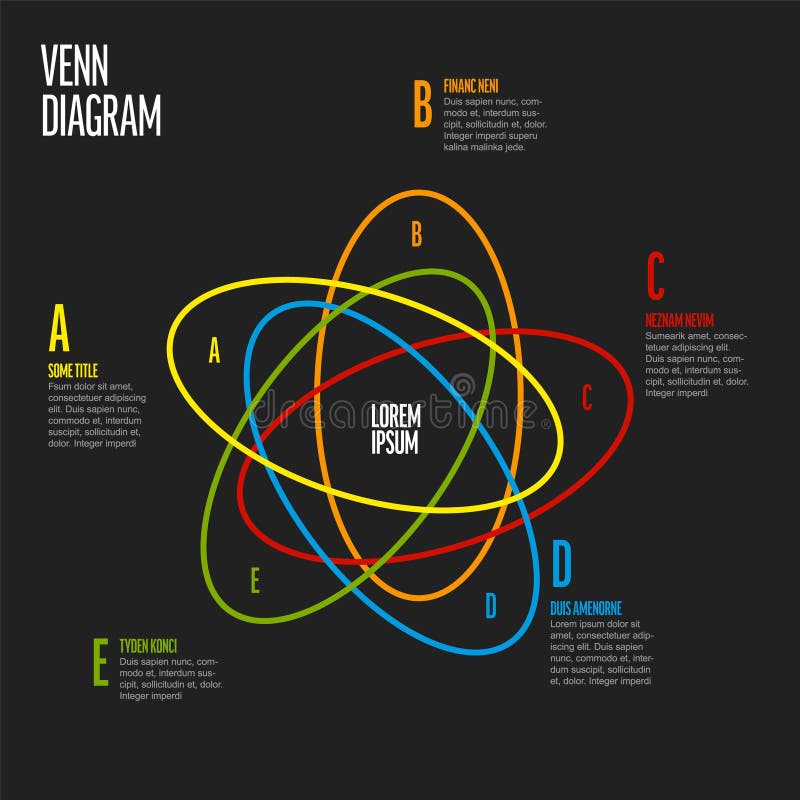
Free with trial Multipurpose Venn diagram schema template with five oval sets and their intersections, detailed descriptions and sample texts on dark gray background. Separate data sets vectors Multipurpose dark Venn diagram schema template with five elements. Multipurpose Venn diagram schema template with five oval sets and their intersections, detailed descriptions and sample texts on dark gray background
Free with trial Multipurpose Venn diagram schema template with five oval sets and their intersections, detailed descriptions and sample texts on dark gray background. Separate data sets vectors Multipurpose dark Venn diagram schema template with five elements. Multipurpose Venn diagram schema template with five oval sets and their intersections, detailed descriptions and sample texts on dark gray background
Free with trial Multipurpose Venn diagram schema template blue and red circle sets with purple intersection, detailed descriptions and sample texts. Separate data sets vectors Multipurpose Venn diagram schema template
Free with trial Multipurpose Venn diagram schema template with five oval sets and their intersections, detailed descriptions and sample texts. Separate data sets vectors Multipurpose Venn diagram schema template with five elements. Multipurpose Venn diagram schema template with five oval sets and their intersections, detailed descriptions and sample texts