Free with trial A 3D rendered graphic depicts a simplified bar chart with pastel colored bars in pink, yellow, and blue. A line graph with white lines and orange and yellow nodes crosses diagonally above the bars. The elements are set against a light blue background with a light tan border, all isolated on a white background. Set financial growth decrease vectors 3 D cartoon bar chart with line graph on blue background data. A 3D rendered graphic depicts a simplified bar chart with pastel colored bars in pink, yellow, and blue. A line graph with white lines and orange and yellow nodes crosses diagonally above the bars. The elements are set against a light blue background with a light tan border, all isolated on a white background
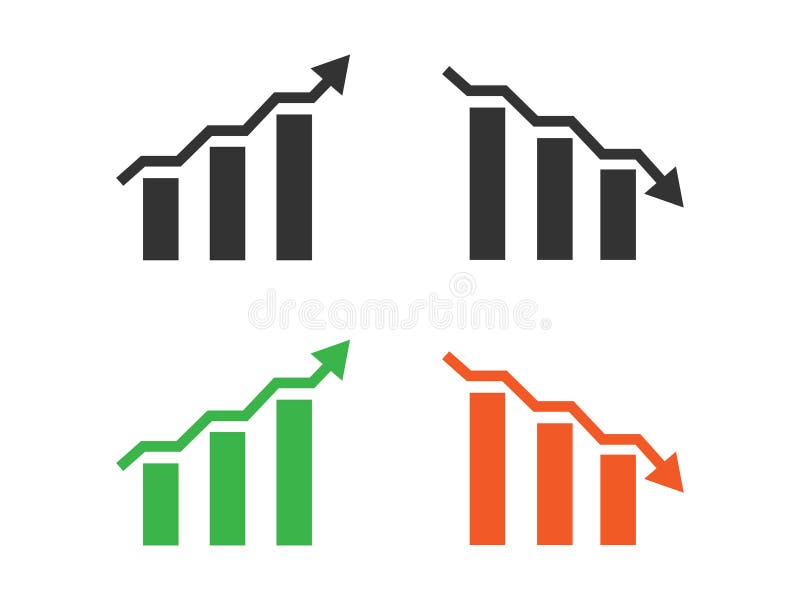
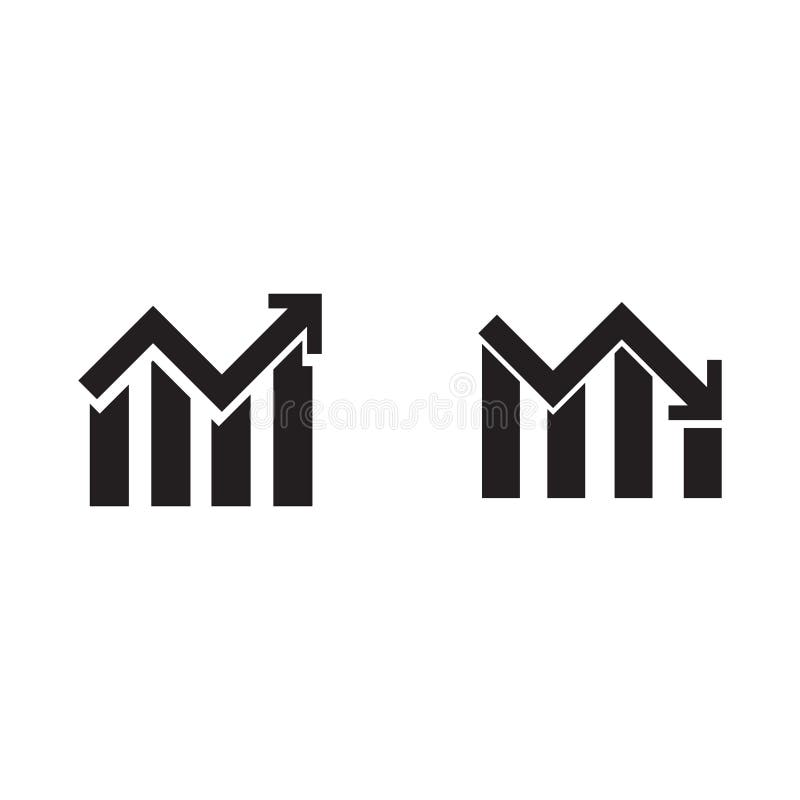
Free with trial Increasing graph and decreasing graph concept. Red progress arrow and blue recession arrow isolated on white background represent increase profit and recession business. Set financial growth decrease vectors Progress and recession. Increasing graph and decreasing graph concept. Red progress arrow and blue recession arrow isolated on white background represent increase profit and recession business.
Free with trial People and currency trading, white collar workers vector art. Set financial growth decrease vectors Business Man Showing Rising and Falling Sales Graphs. People and currency trading, white collar workers vector art
Free with trial A 3D rendered bar chart with bars in red, yellow, green, and blue, arranged in descending order of height. A thick black arrow curves downwards from the top left, crossing over the bars and pointing towards the bottom right, indicating a downward trend or decline. The image is set against a clean, white background. Set financial growth decrease illustrations Colorful Bar Chart Showing Downward Trend with Black Arrow on White Background graph. A 3D rendered bar chart with bars in red, yellow, green, and blue, arranged in descending order of height. A thick black arrow curves downwards from the top left, crossing over the bars and pointing towards the bottom right, indicating a downward trend or decline. The image is set against a clean, white background
Free with trial Up and down directional arrows in vector format for versatile use. Perfect for business infographics and data visualization. EPS 10. Set financial growth decrease vectors Up and down directional arrows in vector format for versatile use. Perfect for business infographics and data visualization. EPS 10
Free with trial Performance of business analysis icon, vector graphic artwork design element. Set financial growth decrease vectors Analysis result performance icon. Performance of business analysis icon, vector graphic artwork design element
Free with trial A bright blue easel holds a whiteboard displaying a bar chart with a clear downward trend. The bars transition in color from green to red, and a prominent red arrow points downwards, emphasizing the decline. The illustration is set against a clean white background. Set financial growth decrease illustrations Blue Easel Displaying a Downward Trend Bar Chart with Red Arrow graph decline. A bright blue easel holds a whiteboard displaying a bar chart with a clear downward trend. The bars transition in color from green to red, and a prominent red arrow points downwards, emphasizing the decline. The illustration is set against a clean white background
Free with trial Modern Finance Icon set Clean Line Style on white background, Created AI. Set financial growth decrease vectors Modern Finance Icons Clean Line Style, Upbeat Financial Mood. Modern Finance Icon set Clean Line Style on white background, Created AI
Free with trial A crisp, minimalist black percentage sign icon enclosed within a bold black circle, set against a clean white background. This flat vector illustration represents concepts such as discounts, sales, interest rates, statistics, and proportions. Its simple, modern design makes it highly versatile for various applications, including web and app interfaces, marketing materials, financial reports, e-commerce promotions, and infographics. Ideal for conveying numerical data, special offers, or mathematical concepts with clarity and impact. Set financial growth decrease illustrations Percentage Sign Icon in Circle. A crisp, minimalist black percentage sign icon enclosed within a bold black circle, set against a clean white background. This flat vector illustration represents concepts such as discounts, sales, interest rates, statistics, and proportions. Its simple, modern design makes it highly versatile for various applications, including web and app interfaces, marketing materials, financial reports, e-commerce promotions, and infographics. Ideal for conveying numerical data, special offers, or mathematical concepts with clarity and impact.
Free with trial Modern collection of business and finance elements. Contains data, charts,diagrams. Use it for presentation, report and infographic projects. Set financial growth decrease vectors Set of Business and Finance Infographic Elements on Transparent Background Vectors. Modern collection of business and finance elements. Contains data, charts,diagrams. Use it for presentation, report and infographic projects
Free with trial This image showcases a collection of finance and government icons, generated by AI, perfect for use in presentations, reports, or websites related to business, economics, or politics. The stylized monochrome design provides a professional and consistent aesthetic. Set financial growth decrease illustrations Finance and Government Icons
Free with trial Viewing Progress Icon Line Design Style Finance and Business Symbol Vector Illustrations. Set financial growth decrease vectors Viewing Progress Icon Line Design Style Finance and Business Symbol
Free with trial A 3D render of a white percentage symbol on a black circular button, set against a dark, minimalist background, representing discounts, sales, or financial interest. Set financial growth decrease illustrations Black circle white percentage symbol. A 3D render of a white percentage symbol on a black circular button, set against a dark, minimalist background, representing discounts, sales, or financial interest
Free with trial A clean and minimalist black percentage symbol (%) enclosed within a bold black circle, set against a pristine white background. This vector graphic is ideal for conveying concepts of discounts, sales, interest rates, statistics, or any proportional value. Its simple, high-contrast design ensures versatility for web icons, mobile apps, marketing materials, financial reports, and educational content, offering clear communication in various digital and print applications. Set financial growth decrease vectors Black Percentage Symbol in Circle Icon. A clean and minimalist black percentage symbol (%) enclosed within a bold black circle, set against a pristine white background. This vector graphic is ideal for conveying concepts of discounts, sales, interest rates, statistics, or any proportional value. Its simple, high-contrast design ensures versatility for web icons, mobile apps, marketing materials, financial reports, and educational content, offering clear communication in various digital and print applications.
Free with trial Four blue square icons with arrows indicating percentage changes, two with upward green arrows and two with downward red arrows. Set financial growth decrease illustrations Set of four icons showing percentage changes. Four blue square icons with arrows indicating percentage changes, two with upward green arrows and two with downward red arrows
Free with trial A 3D rendered image displays a collection of business charts on a document. A colorful pie chart with six segments sits to the left of a bar graph with five vertical bars of varying heights and colors. A line graph with multiple colored lines is visible on the document below. The composition is set against a white background. Set financial growth decrease illustrations 3D Rendered Pie Chart Bar Graph and Line Graph on a Document data statistics. A 3D rendered image displays a collection of business charts on a document. A colorful pie chart with six segments sits to the left of a bar graph with five vertical bars of varying heights and colors. A line graph with multiple colored lines is visible on the document below. The composition is set against a white background
Free with trial Set of twenty different business and finance icons, perfect for presentations, websites, and applications. These simple yet effective line icons represent key concepts in the business world. Set financial growth decrease vectors Collection of Business and Finance Line Icons. Set of twenty different business and finance icons, perfect for presentations, websites, and applications. These simple yet effective line icons represent key concepts in the business world.
Free with trial Increase money icon vector illustration. Set financial growth decrease vectors Increase money icon vector
Free with trial Stock market quotes graph chart. Set financial growth decrease illustrations Finance stock exchange background. Stock market quotes graph chart.
Free with trial A vibrant bar graph graphic with a gradient of colors, representing data visualization and statistical analysis. The bars vary in height, indicating different values or categories. The image is set against a clean white background, making it suitable for a variety of applications, including presentations, reports, and website design. The color palette adds visual interest and can be used to represent trends, comparisons, or performance metrics. Set financial growth decrease illustrations Colorful Bar Graph Illustrating Data and Statistics. A vibrant bar graph graphic with a gradient of colors, representing data visualization and statistical analysis. The bars vary in height, indicating different values or categories. The image is set against a clean white background, making it suitable for a variety of applications, including presentations, reports, and website design. The color palette adds visual interest and can be used to represent trends, comparisons, or performance metrics.
Free with trial Money creation, or money issuance, is the process by which the money supply of a country, or of an economic or monetary region,. Set financial growth decrease vectors Increase money icon vector. Money creation, or money issuance, is the process by which the money supply of a country, or of an economic or monetary region,
Free with trial Cost reduction icon linear logo mark set collection in black and white. Set financial growth decrease vectors Cost reduction icon linear logo isolated. Cost reduction icon linear logo mark set collection in black and white
Free with trial A 3D rendered bar chart displays a series of bars decreasing in height from left to right. The bars are colored with a gradient transitioning from blue to orange, set against a plain white background. The visual represents a downward trend or decline. Set financial growth decrease illustrations Downward Trending Bar Chart with Gradient Colors on a White Background graph statistics. A 3D rendered bar chart displays a series of bars decreasing in height from left to right. The bars are colored with a gradient transitioning from blue to orange, set against a plain white background. The visual represents a downward trend or decline
Free with trial Colorful bar graph chart depicted with crayons. Set against a rustic wooden background, implying decline or financial loss. Perfect for business, economics, and data visualization concepts. Set financial growth decrease illustrations Falling Bar Graph with Crayons Good Resolution Stock Photo. Colorful bar graph chart depicted with crayons. Set against a rustic wooden background, implying decline or financial loss. Perfect for business, economics, and data visualization concepts.
Free with trial Graph chart going up and down sign arrows flat design vector illustration on white background. Set financial growth decrease vectors Graph chart going up and down sign arrows flat design vector illustration
Free with trial Lower cost icon logo sign vector outline in black and white color. Set financial growth decrease vectors Lower cost icon logo set vector. Lower cost icon logo sign vector outline in black and white color
Free with trial Uptrend and downtrend arrow line icon illustration on black square. Set financial growth decrease vectors Uptrend and downtrend arrow line icon on black square. Uptrend and downtrend arrow line icon illustration on black square
Free with trial The image shows a set of colorful blocks stacked in descending height from purple to blue, accompanied by a red arrow that initially trends upward and then sharply downward, symbolizing a rise followed by a decline in performance or values. This visual metaphor is often used to represent business cycles, market trends, or financial fluctuations. Set financial growth decrease illustrations Colorful blocks and arrow illustrating fluctuating business or market trends. The image shows a set of colorful blocks stacked in descending height from purple to blue, accompanied by a red arrow that initially trends upward and then sharply downward, symbolizing a rise followed by a decline in performance or values. This visual metaphor is often used to represent business cycles, market trends, or financial fluctuations
Free with trial Uptrend and downtrend arrow line icon illustration on circle outline. Set financial growth decrease vectors Uptrend and downtrend arrow line icon on circle outline. Uptrend and downtrend arrow line icon illustration on circle outline
Free with trial Lower cost icon Vector symbol or sign set collection in black and white outline. Set financial growth decrease vectors Lower cost icon mark in filled style. Lower cost icon Vector symbol or sign set collection in black and white outline
Free with trial Uptrend and downtrend arrow icon on black square. Rise and fall sign symbol. Set financial growth decrease vectors Uptrend and downtrend arrow icon on black square
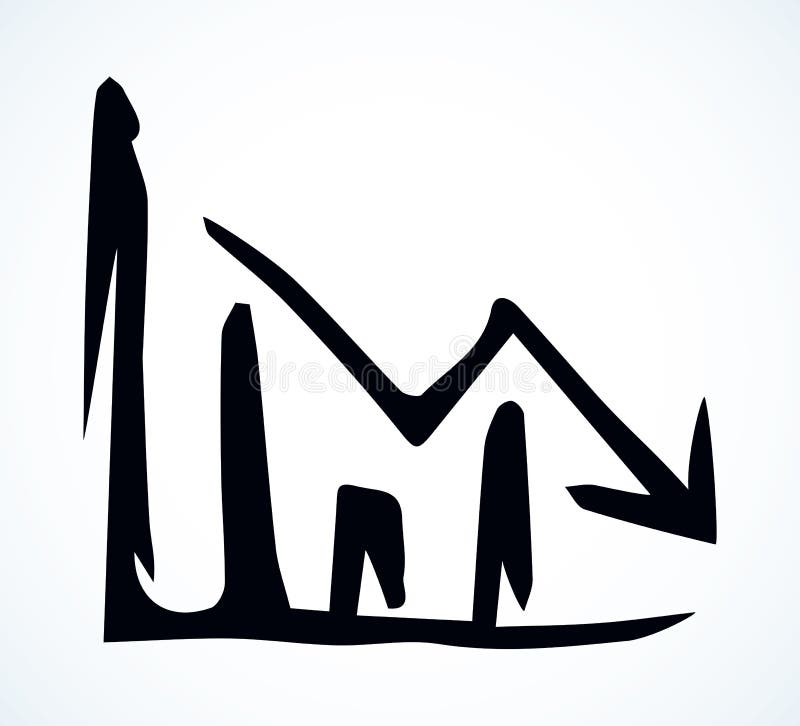
Free with trial Close up abstract view low curve go point simple account infochart draft project result set. Linear black pen hand drawn decrease info column logo. Outline art doodle note cartoon white paper style. Set financial growth decrease vectors Schematic graph. Vector drawing diagram. Close up abstract view low curve go point simple account infochart draft project result set. Linear black pen hand drawn decrease info column logo. Outline art doodle note cartoon white paper style
Free with trial This is an detailed set of clean line icons for infographic design, corporate data analysis, and finance. Set financial growth decrease vectors Clean infographic symbols for corporate data analysis and financial tracking applications. This is an detailed set of clean line icons for infographic design, corporate data analysis, and finance
Free with trial Upward and downward arrow icon on circle line. Up and down direction symbol. Set financial growth decrease vectors Upward and downward arrow icon on circle line
Free with trial Cost reduction icon logo sign vector outline in black and white color. Set financial growth decrease vectors Cost reduction logo sign set vector outline. Cost reduction icon logo sign vector outline in black and white color
Free with trial Cost reduction icon Black line art vector in black and white outline set collection sign. Set financial growth decrease vectors Cost reduction icon Black line art vector logo. Cost reduction icon Black line art vector in black and white outline set collection sign
Free with trial ?a high-quality 3d illustration of a miniature wooden house placed on the tallest block of a declining bar graph . set on a wooden table with soft natural sunlight from a window, this image conceptualizes debt reduction, mortgage payments, decreasing real estate prices, or strategic financial planning for home ownership. Set financial growth decrease illustrations Wooden house model on descending bar chart representing mortgage reduction or property market analysis. ?a high-quality 3d illustration of a miniature wooden house placed on the tallest block of a declining bar graph. set on a wooden table with soft natural sunlight from a window, this image conceptualizes debt reduction, mortgage payments, decreasing real estate prices, or strategic financial planning for home ownership.
Free with trial Finances statistics descending bars graphic outline icon in white and black colors. finances statistics descending bars graphic flat vector icon from business collection for web, mobile apps and ui. Set financial growth decrease vectors Finances statistics descending bars graphic outline icon in white and black colors. finances statistics descending bars graphic
Free with trial Interest icon or logo design isolated sign symbol vector illustration - high quality line style vector icon suitable for designers, web developers, displays and websites. Set financial growth decrease vectors Interest Icon
Free with trial 4 currency symbols euro pound dollar yen with green and red arrows. Set financial growth decrease illustrations Currency with Positive and Negative Arrow. 4 currency symbols euro pound dollar yen with green and red arrows
Free with trial Set of profit and losses icons. Set financial growth decrease vectors Profit and Losses Icons
Free with trial Dollar sign up and down arrow icon Vector symbol or sign set collection in black and white outline. Set financial growth decrease vectors Dollar sign up and down arrow icon mark in filled style. Dollar sign up and down arrow icon Vector symbol or sign set collection in black and white outline
Free with trial Uptrend and downtrend arrow line icon on black circle. Rising and falling arrows illustration concept. Set financial growth decrease vectors Uptrend and downtrend arrow line icon on black circle. Rising and falling arrows concept
Free with trial Up and down direction arrow icon with long shadow. Upward and downward sign symbol. Set financial growth decrease vectors Up and down direction arrow icon with long shadow
Free with trial Up and Down sign with green and red arrows isolated on a blue background vector illustration. Concept of sales bar chart symbol icon with arrow moving down and sales bar chart with arrow moving up. Set financial growth decrease vectors Up and Down sign with green and red arrows vector illustration. Concept of sales bar chart symbol icon with arrows. Up and Down sign with green and red arrows isolated on a blue background vector illustration. Concept of sales bar chart symbol icon with arrow moving down and sales bar chart with arrow moving up.
Free with trial Up and Down sign with green and red arrows vector illustration. Concept of sales bar chart symbol icon with arrow moving down and sales bar chart with arrow moving up. Set financial growth decrease vectors Up and Down sign with green and red arrows vector illustration. Concept of sales bar chart symbol icon with arrows. Up and Down sign with green and red arrows vector illustration. Concept of sales bar chart symbol icon with arrow moving down and sales bar chart with arrow moving up.
Free with trial Up and Down sign with green and red arrows vector illustration. Concept of sales bar chart symbol icon with arrow moving down and sales bar chart with arrow moving up. Set financial growth decrease vectors Up and Down sign with green and red arrows vector illustration. Concept of sales bar chart symbol icon with arrows. Up and Down sign with green and red arrows vector illustration. Concept of sales bar chart symbol icon with arrow moving down and sales bar chart with arrow moving up.
Free with trial Golden GDP letters are set against a dynamic stock market chart, illustrating complex economic analysis and fluctuating investment with both profit and loss. Set financial growth decrease illustrations Gross Domestic Product GDP concept featuring golden letters and a stock market chart with both upward and downward trends. Golden GDP letters are set against a dynamic stock market chart, illustrating complex economic analysis and fluctuating investment with both profit and loss
Free with trial Capital increase concept vector icon design, 48x48 pixel perfect and editable stroke. Set financial growth decrease vectors Capital increase icon. Capital increase concept vector icon design, 48x48 pixel perfect and editable stroke
Free with trial Two adjacent panels display a line graph icon with dual zigzagging lines and circular data points. On the left, the icon is black on a white background. On the right, it's white on a dark background. Both icons feature the line graph at a 45-degree angle, suggesting an increase in data points, with round nodes indicating specific values along the line. The simplistic design focuses on contrast and clarity, ideal for visual representation in data analysis or presentation templates. Set financial growth decrease vectors Increase Icon. Solid glyph series icon. Two adjacent panels display a line graph icon with dual zigzagging lines and circular data points. On the left, the icon is black on a white background. On the right, it's white on a dark background. Both icons feature the line graph at a 45-degree angle, suggesting an increase in data points, with round nodes indicating specific values along the line. The simplistic design focuses on contrast and clarity, ideal for visual representation in data analysis or presentation templates.
Free with trial Rise icon sign vector,Symbol, logo illustration for web and mobile. Set financial growth decrease vectors Rise vector icon sign symbol. Rise icon sign vector,Symbol, logo illustration for web and mobile
Free with trial Line Mosaic based on dollar up down icon. Mosaic vector dollar up down is composed with randomized line spots. Bonus icons are added. Set financial growth decrease illustrations Dash Mosaic Dollar up Down Icon. Line Mosaic based on dollar up down icon. Mosaic vector dollar up down is composed with randomized line spots. Bonus icons are added
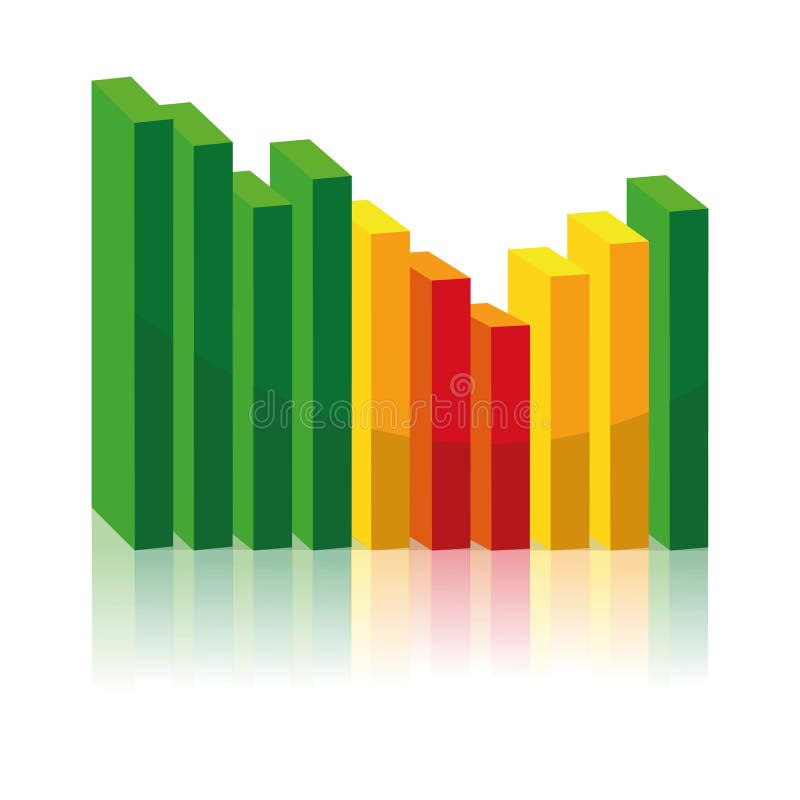
Free with trial Colorful bar charts illustrating positive and negative business trends from january to may provide a clear visual representation of performance. Set financial growth decrease vectors Colorful bar charts illustrating positive and negative business trends from january to may provide a clear visual
Free with trial Icon of the increase and fall rate of the Euro. Set of Euro rate linear arrows. Vector illustration. Business icons isolated. Set financial growth decrease illustrations Concept of increase and fall rate of the Euro. Icon of the increase and fall rate of the Euro. Set of Euro rate linear arrows. Vector illustration. Business icons isolated
Free with trial Dollar up down mosaic of small circles in various sizes and color hues, based on dollar up down icon. Vector small circles are combined into blue collage. Set financial growth decrease illustrations Dollar up Down Mosaic Icon of Circles. Dollar up down mosaic of small circles in various sizes and color hues, based on dollar up down icon. Vector small circles are combined into blue collage
Free with trial Colorful bar charts illustrating positive and negative business trends from january to may provide a clear visual representation of performance. Set financial growth decrease illustrations Colorful bar charts illustrating positive and negative business trends from january to may provide a clear visual
Free with trial Graph icon. With outline and glyph style. Best usage as user interface, infographic element, app icon, web icon, etc. Set financial growth decrease vectors Statistical data icon represented from charts and graphs. Graph icon. With outline and glyph style. Best usage as user interface, infographic element, app icon, web icon, etc.
Free with trial Rise icon in filled, thin line, outline and stroke style. Vector illustration of two colored and black rise vector icons designs can be used for mobile, ui, web. Set financial growth decrease vectors Rise icon in filled, thin line, outline and stroke style. Vector illustration of two colored and black rise vector icons designs
Free with trial Finance pack. Vector illustration. Web and Ui-UX Collection. Set financial growth decrease vectors Finance pack. Vector illustration. Web icon batch. Finance pack. Vector illustration. Web and Ui-UX Collection
Free with trial Vector isolated Flat picture presentation icons - Increase, decrease, left, right and slide show board on white background. Set financial growth decrease vectors Flat picture presentation icons
Free with trial Reduction chart icon. eps. Set financial growth decrease vectors Chart Icon Demonstrating Reduction in Data, Business Decline, and Statistical Analysis. Reduction chart icon.eps
Free with trial Icon of the increase and fall rate of the dollar. Set of dollar rate linear arrows. Vector illustration. Business icons isolated. Set financial growth decrease illustrations Concept of increase and fall rate of the dollar. Icon of the increase and fall rate of the dollar. Set of dollar rate linear arrows. Vector illustration. Business icons isolated
Free with trial Up and down arrow icon on square background. Upward and downward sign symbol illustration with long shadow. Set financial growth decrease vectors Up and down arrow icon on square background. Upward and downward sign symbol with long shadow
Free with trial The pink chart for business concept 3d rendering. Set financial growth decrease illustrations The pink chart for business concept 3d rendering
Free with trial Stock market chart arrows in red and green are seen as graphic elements and are seen in a 3-d illustration. Arrows indicate the upward and downward gains and losses on the Dow. Set financial growth decrease illustrations Stock market chart arrows in red and green are seen as graphic elements and are seen in a 3-d illustration
Free with trial The pink chart for business concept 3d rendering. Set financial growth decrease illustrations The pink chart for business concept 3d rendering
Free with trial Vector isolated linear picture presentation icons - Increase, decrease, left, right and slide show board on blue background. Set financial growth decrease vectors Picture presentation icons
Free with trial Up and Down sign with green and red arrows vector illustration. Concept of sales bar chart symbol icon with arrow moving down and sales bar chart with arrow moving up. Set financial growth decrease vectors Up and Down sign with green and red arrows vector illustration. Concept of sales bar chart symbol icon with arrows. Up and Down sign with green and red arrows vector illustration. Concept of sales bar chart symbol icon with arrow moving down and sales bar chart with arrow moving up.
Free with trial Simple linear up and down arrows. Upward, downward arrows in blue and red. Stock vector illustration isolated on white background. Set financial growth decrease illustrations Simple linear up and down arrows. Upward, downward arrows in blue and red. Stock vector illustration isolated on white background
Free with trial Uncertainty icon with long shadow. Simple vector logo. Set financial growth decrease illustrations Uncertainty icon with long shadow
Free with trial Declining graph icon, flat icon with long shadow. Simple vector logo. Set financial growth decrease vectors Declining graph icon, flat icon with long shadow
Free with trial Graph trending upwards and downwards, Vector illustration. Set financial growth decrease vectors Graph trending upwards and downwards, Vector illustration.
Free with trial Buy, Hold, sell on keyboard. and dollar coins vector. business. stock market dollars. Set financial growth decrease vectors Buy, Hold, sell on keyboard. and dollar coins vector
Free with trial Cost reduction icon web design logo set collection in flat vector. Set financial growth decrease vectors Cost Reduction Icon Illustrating Business Efficiency Strategies, Budget Management Solutions, and Expense Reduction Programs for. Cost reduction icon web design logo set collection in flat vector
Free with trial Down Arrow Icon Symbol Simple Line Style Vector Perfect Web and Mobile Illustration. Set financial growth decrease vectors Down Icon Simple Line Style Vector Perfect Web and Mobile Illustration. Down Arrow Icon Symbol Simple Line Style Vector Perfect Web and Mobile Illustration
Free with trial Chart falling and rising business concept vector illustration EPS10. Set financial growth decrease vectors Chart falling and rising business concept
Free with trial Green up arrow and red down arrow isolated on white background, 3d render illustration. Set financial growth decrease vectors Green up arrow and red down arrow