Free with trial Asia. Shaded relief map. Colored according to vegetation. Includes a clip path for the land area. Shaded area illustrations Asia, shaded relief map. Asia. Shaded relief map. Colored according to vegetation. Includes a clip path for the land area.
Free with trial North and Central America. Shaded relief map, with major urban areas. Colored according to vegetation. Includes a clip path for the land area. Shaded area illustrations North and Central America, shaded relief map. North and Central America. Shaded relief map, with major urban areas. Colored according to vegetation. Includes a clip path for the land area.
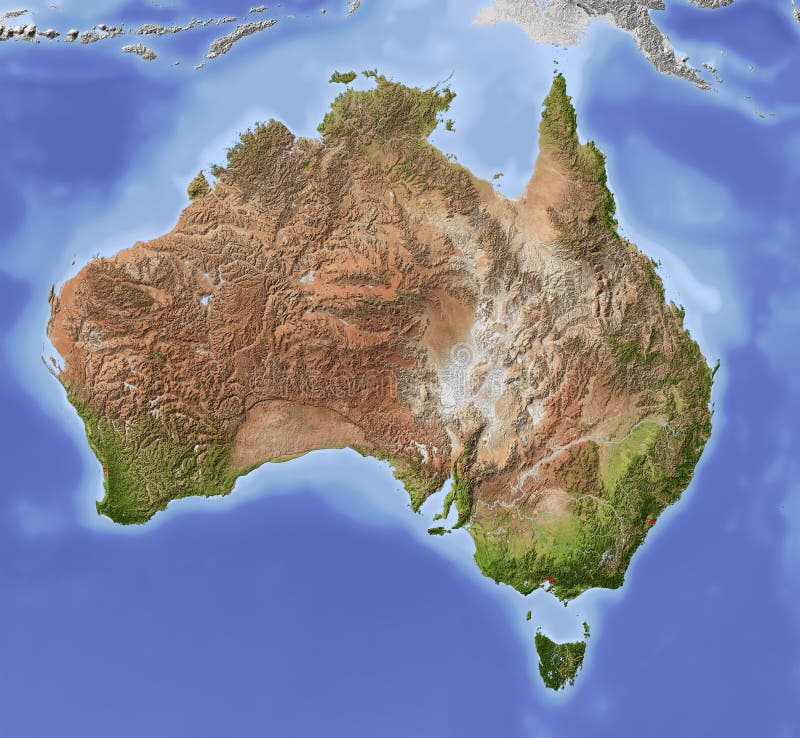
Free with trial Australia. Shaded relief map with major urban areas. Colored according to vegetation. Includes clip path for the state area. Shaded area illustrations Australia, shaded relief map. Australia. Shaded relief map with major urban areas. Colored according to vegetation. Includes clip path for the state area.
Free with trial USA. Shaded relief map of the conterminous USA. Surrounding territory greyed out. Colored according to elevation and dominant vegetation. Includes clip path for the state area. Shaded area illustrations USA, relief map. USA. Shaded relief map of the conterminous USA. Surrounding territory greyed out. Colored according to elevation and dominant vegetation. Includes clip path for the state area.
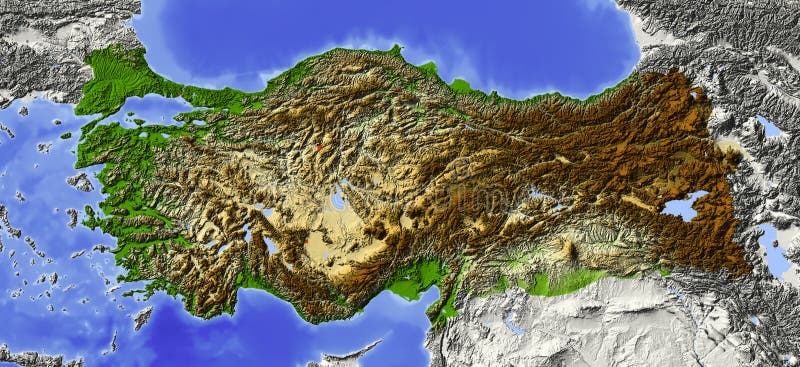
Free with trial Turkey. Shaded relief map, with major urban areas. Surrounding territory greyed out. Colored according to elevation. Includes clip path for the state area. Shaded area illustrations Turkey, relief map. Turkey. Shaded relief map, with major urban areas. Surrounding territory greyed out. Colored according to elevation. Includes clip path for the state area.
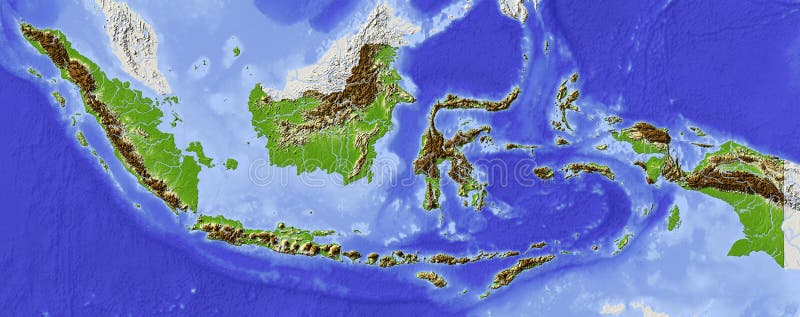
Free with trial Indonesia. Shaded relief map. Surrounding territory greyed out. Colored according to elevation. Includes clip path for the state area. Shaded area illustrations Indonesia, relief map. Indonesia. Shaded relief map. Surrounding territory greyed out. Colored according to elevation. Includes clip path for the state area.
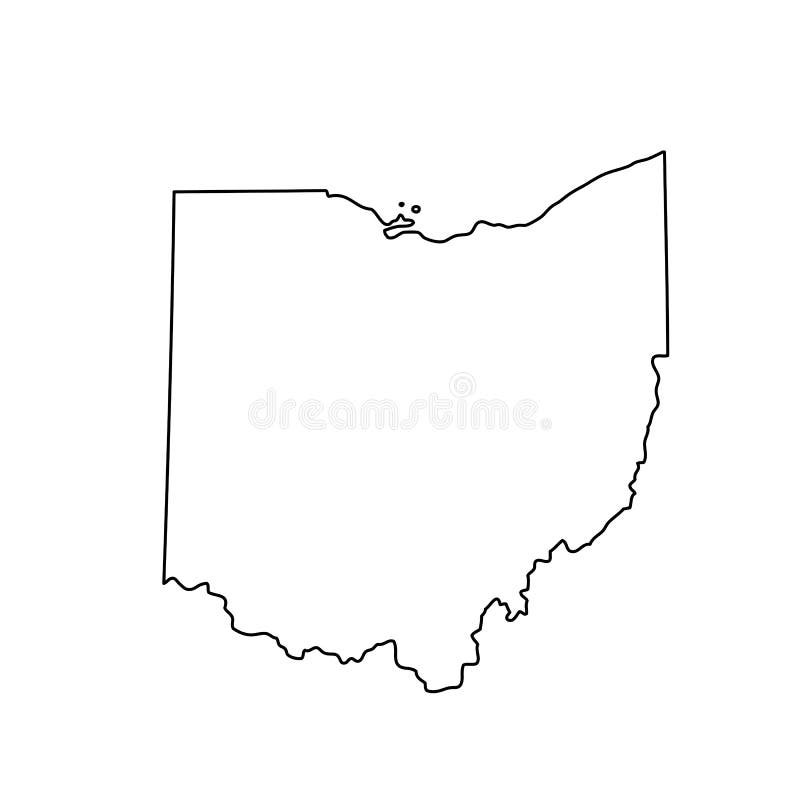
Free with trial Map of the U. S. state of Ohio. Vector illustration. Shaded area vectors Map of the U.S. state of Ohio
Free with trial Map of the U. S. state of Minnesota. Shaded area vectors Map of the U.S. state Minnesota
Free with trial Map of the U. S. state of Wisconsin. Shaded area vectors Map of the U.S. state Wisconsin
Free with trial Map of the U. S. state of Michigan. Shaded area vectors Map of the U.S. state Michigan
Free with trial Map of the U. S. state of Missouri. Shaded area vectors Map of the U.S. state Missouri
Free with trial European Union. Shaded relief map with major urban areas. Territory outside the euopean union greyed out. Colored according to vegetation. Includes two clip paths for the land area and the area of the european union. Shaded area illustrations European Union, shaded relief map. European Union. Shaded relief map with major urban areas. Territory outside the euopean union greyed out. Colored according to vegetation. Includes two clip paths for the land area and the area of the european union.
Free with trial Argentina. Shaded relief map with major urban areas. Surrounding territory greyed out. Colored according to vegetation. Includes clip path for the state area. Shaded area illustrations Argentina, shaded relief map. Argentina. Shaded relief map with major urban areas. Surrounding territory greyed out. Colored according to vegetation. Includes clip path for the state area.
Free with trial Israel, without West Bank. Shaded relief map with major urban areas. Surrounding territory greyed out. Colored according to elevation. Includes clip path for the state area. Data source: NASA. Shaded area illustrations Israel, shaded relief map. Israel, without West Bank. Shaded relief map with major urban areas. Surrounding territory greyed out. Colored according to elevation. Includes clip path for the state area. Data source: NASA
Free with trial Arizona. Shaded relief map, with major urban areas and rivers, surrounding territory greyed out. Colored according to elevation. Clipping path for the state area included. Projection: Standard Mercator Extents: -115. 5/-108. 5/30. 5/38 Data sources: US Census Bureau, NASA. Shaded area illustrations Arizona, shaded relief map. Arizona. Shaded relief map, with major urban areas and rivers, surrounding territory greyed out. Colored according to elevation. Clipping path for the state area included. Projection: Standard Mercator Extents: -115.5/-108.5/30.5/38 Data sources: US Census Bureau, NASA
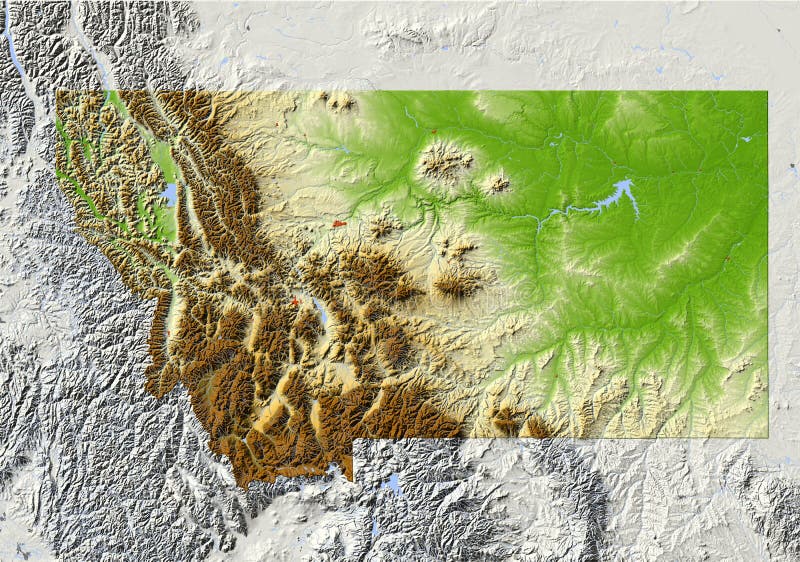
Free with trial Montana. Shaded relief map, with major urban areas and rivers, surrounding territory greyed out. Colored according to elevation. Clipping path for the state area included. Projection: Standard Mercator Extents: -117. 0/-103. 5/43. 5/50. 0 Data sources: US Census Bureau, NASA. Shaded area illustrations Montana, shaded relief map. Montana. Shaded relief map, with major urban areas and rivers, surrounding territory greyed out. Colored according to elevation. Clipping path for the state area included. Projection: Standard Mercator Extents: -117.0/-103.5/43.5/50.0 Data sources: US Census Bureau, NASA
Free with trial Angola. Shaded relief map. Surrounding territory greyed out. Colored according to vegetation. Includes clip path for the state area. Shaded area illustrations Angola, shaded relief map. Angola. Shaded relief map. Surrounding territory greyed out. Colored according to vegetation. Includes clip path for the state area.
Free with trial Saudi Arabia. Shaded relief map. Surrounding territory greyed out. Colored according to elevation. Includes clip path for the state area. Shaded area illustrations Saudi Arabia, relief map. Saudi Arabia. Shaded relief map. Surrounding territory greyed out. Colored according to elevation. Includes clip path for the state area.
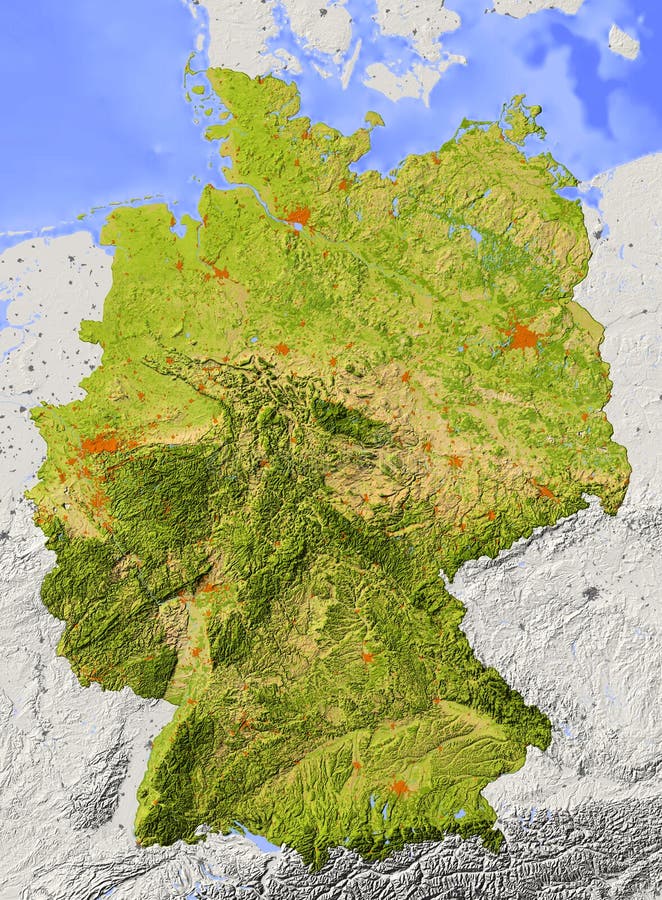
Free with trial Germany. Shaded relief map. Surrounding territory greyed out. Colored according to elevation and dominant vegetation. Includes clip path for the state area. Shaded area illustrations Germany, relief map. Germany. Shaded relief map. Surrounding territory greyed out. Colored according to elevation and dominant vegetation. Includes clip path for the state area.
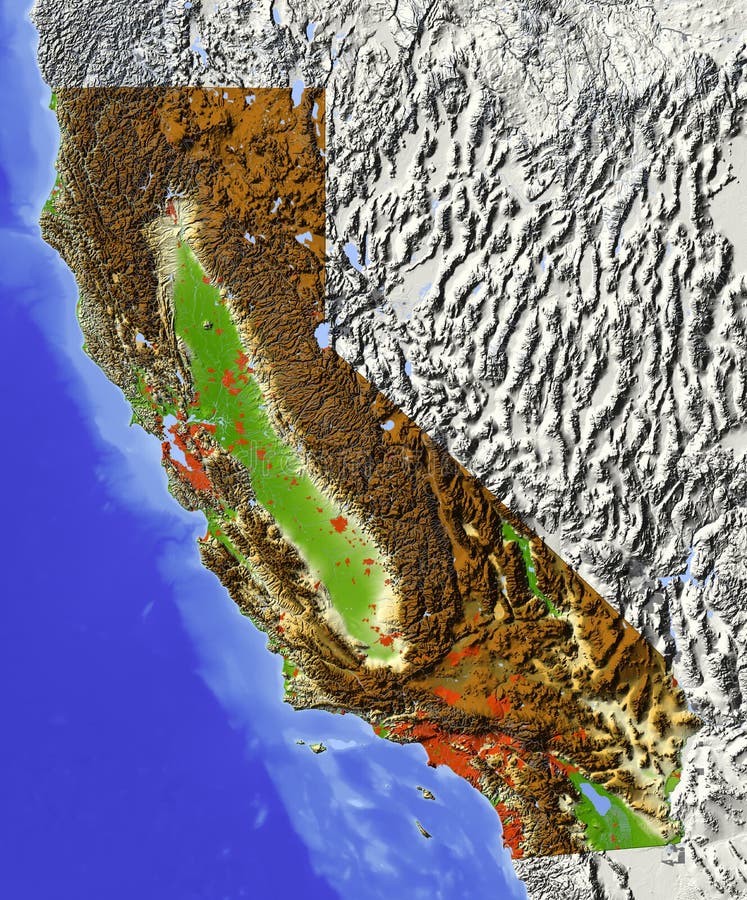
Free with trial California. Shaded relief map. Shows major urban areas and rivers, surrounding territory greyed out. Colored according to relative terrain height. Clipping path for the state area included. Data sources: US Census Bureau, NASA. Shaded area illustrations California, relief map. California. Shaded relief map. Shows major urban areas and rivers, surrounding territory greyed out. Colored according to relative terrain height. Clipping path for the state area included. Data sources: US Census Bureau, NASA
Free with trial Vietnam. Shaded relief map. Surrounding territory greyed out. Colored according to elevation and dominant vegetation. Includes clip path for the state area. Shaded area illustrations Vietnam, relief map. Vietnam. Shaded relief map. Surrounding territory greyed out. Colored according to elevation and dominant vegetation. Includes clip path for the state area.
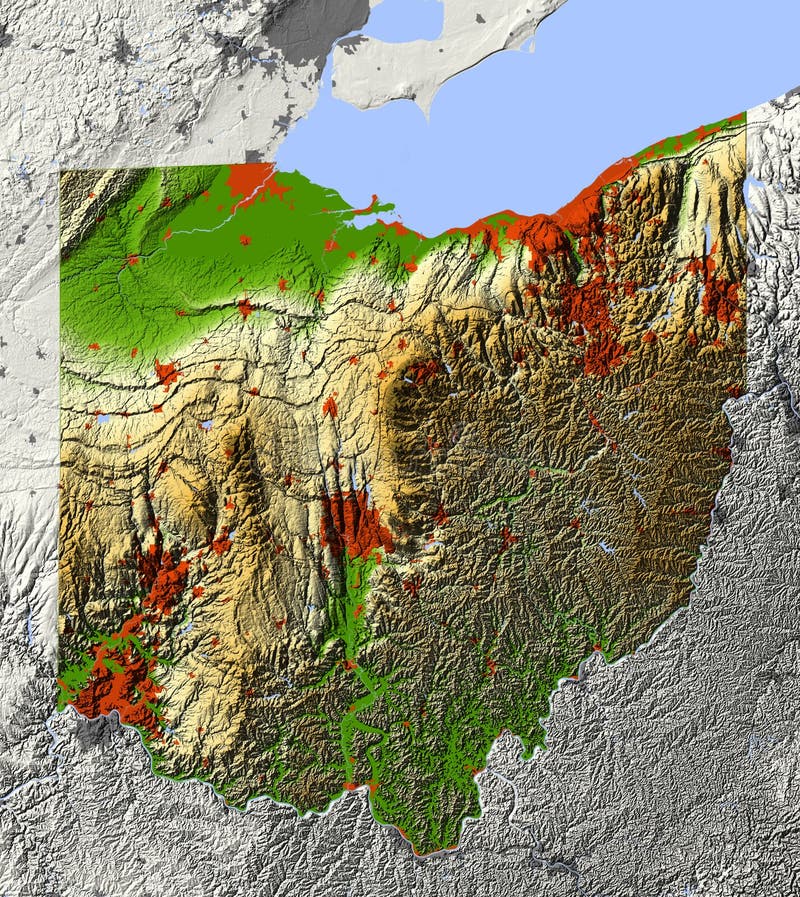
Free with trial Ohio. Shaded relief map. Shows major urban areas and rivers, surrounding territory greyed out. Colored according to relative terrain height. Clipping path for the state area included. Data sources: US Census Bureau, NASA. Shaded area illustrations Ohio, relief map. Ohio. Shaded relief map. Shows major urban areas and rivers, surrounding territory greyed out. Colored according to relative terrain height. Clipping path for the state area included. Data sources: US Census Bureau, NASA
Free with trial Norway. Shaded relief map, with major urban areas. Surrounding territory greyed out. Colored according to elevation. Includes clip path for the state area. Shaded area illustrations Norway, relief map. Norway. Shaded relief map, with major urban areas. Surrounding territory greyed out. Colored according to elevation. Includes clip path for the state area.
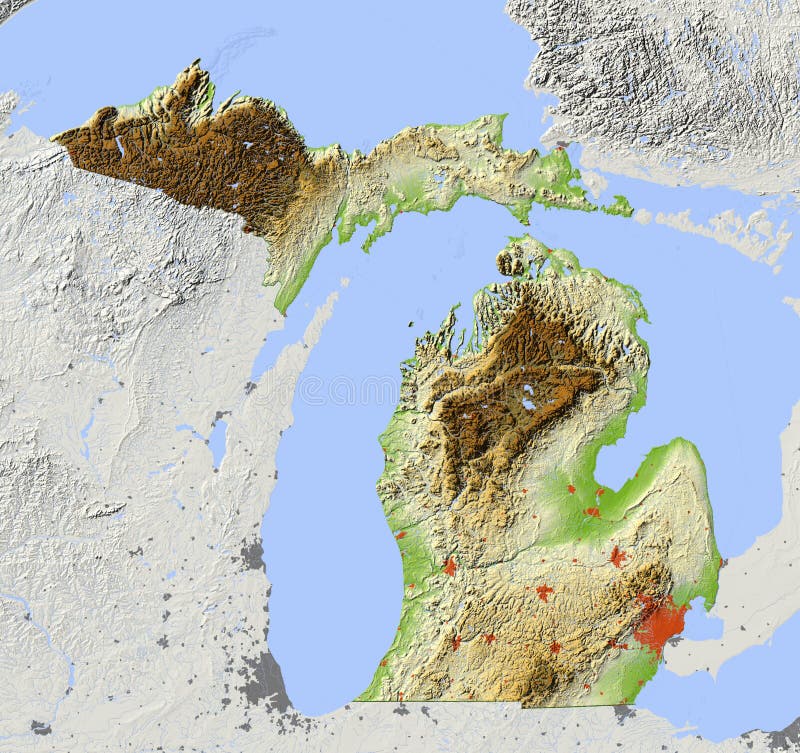
Free with trial Michigan. Shaded relief map. Shows major urban areas and rivers, surrounding territory greyed out. Colored according to relative terrain height. Clipping path for the state area included. Shaded area illustrations Michigan, relief map. Michigan. Shaded relief map. Shows major urban areas and rivers, surrounding territory greyed out. Colored according to relative terrain height. Clipping path for the state area included.
Free with trial Philippines. Shaded relief map. Surrounding territory greyed out. Colored according to elevation. Includes clip path for the state area. Shaded area illustrations Philippines, relief map. Philippines. Shaded relief map. Surrounding territory greyed out. Colored according to elevation. Includes clip path for the state area.
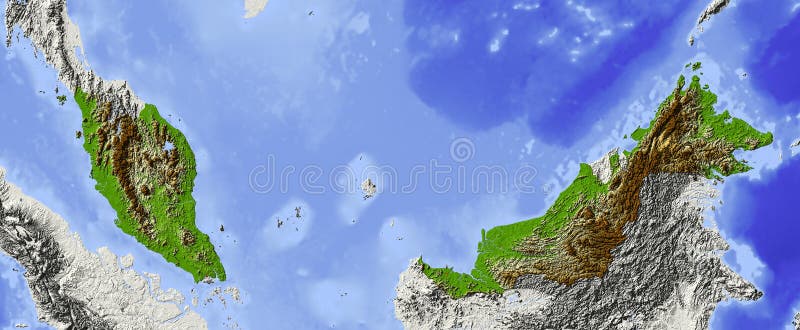
Free with trial Malaysia. Shaded relief map. Surrounding territory greyed out. Colored according to elevation. Includes clip path for the state area. Shaded area illustrations Malaysia, relief map. Malaysia. Shaded relief map. Surrounding territory greyed out. Colored according to elevation. Includes clip path for the state area.
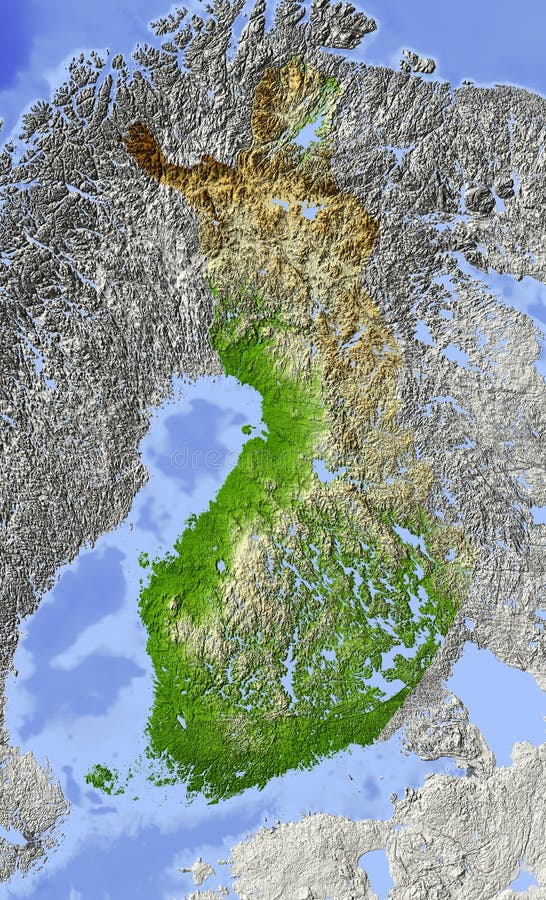
Free with trial Finland. Shaded relief map, with major urban areas. Surrounding territory greyed out. Colored according to elevation. Includes clip path for the state area. Shaded area illustrations Finland, relief map. Finland. Shaded relief map, with major urban areas. Surrounding territory greyed out. Colored according to elevation. Includes clip path for the state area.
Free with trial Map of the U. S. state of Illinois. Shaded area vectors Map of the U.S. state Illinois
Free with trial Map of the U. S. state of New Jersey. Shaded area vectors Map of the U.S. state New Jersey
Free with trial Map of the U. S. state Illinois. Vector illustration. Shaded area vectors Map of the U.S. state Illinois
Free with trial Map of the U. S. state Minnesota. Vector illustration. Shaded area vectors Map of the U.S. state Minnesota
Free with trial Map of the U. S. state of Tennessee. Shaded area vectors Map of the U.S. state Tennessee
Free with trial Map of the U. S. state of Virginia. Shaded area vectors Map of the U.S. state Virginia
Free with trial Map of the U. S. state of Oklahoma. Shaded area vectors Map of the U.S. state Oklahoma
Free with trial Map of the U. S. state of New Hampshire. Shaded area vectors Map of the U.S. state New Hampshire
Free with trial Map of the U. S. state of New Hampshire. Vector illustration. Shaded area vectors Map of the U.S. state of New Hampshire
Free with trial Map of the U. S. state of Tennessee. Vector illustration. Shaded area vectors Map of the U.S. state of Tennessee
Free with trial Map of the U. S. state of Kentucky on a white background. Shaded area vectors Map of the U.S. state of Kentucky
Free with trial Map of the U. S. state of Ohio on a white background. Shaded area vectors Map of the U.S. state of Ohio
Free with trial Map of the U. S. state of Minnesota. Vector. Shaded area vectors Map of the U.S. state of Minnesota. Vector
Free with trial Map of the U. S. state Georgia. Vector illustration. Shaded area vectors Map of the U.S. state Georgia
Free with trial Map of the U. S. state of Pennsylvania. Shaded area vectors Map of the U.S. state Pennsylvania
Free with trial Map of the U. S. state of California. Shaded area vectors Map of the U.S. state California
Free with trial Map of the U. S. state of Pennsylvania. Vector illustration. Shaded area vectors Map of the U.S. state of Pennsylvania
Free with trial Map of the U. S. state of California. Shaded area vectors Map of the U.S. state California
Free with trial Map of the U. S. state of Delaware. Shaded area vectors Map of the U.S. state Delaware
Free with trial New Mexico. Shaded relief map, with major urban areas and rivers, surrounding territory greyed out. Colored according to elevation. Clipping path for the state area included. Projection: Standard Mercator Extents: -110. 0/-102. 5/30. 5/38 Data sources: US Census Bureau, NASA. Shaded area illustrations New Mexico, shaded relief map. New Mexico. Shaded relief map, with major urban areas and rivers, surrounding territory greyed out. Colored according to elevation. Clipping path for the state area included. Projection: Standard Mercator Extents: -110.0/-102.5/30.5/38 Data sources: US Census Bureau, NASA
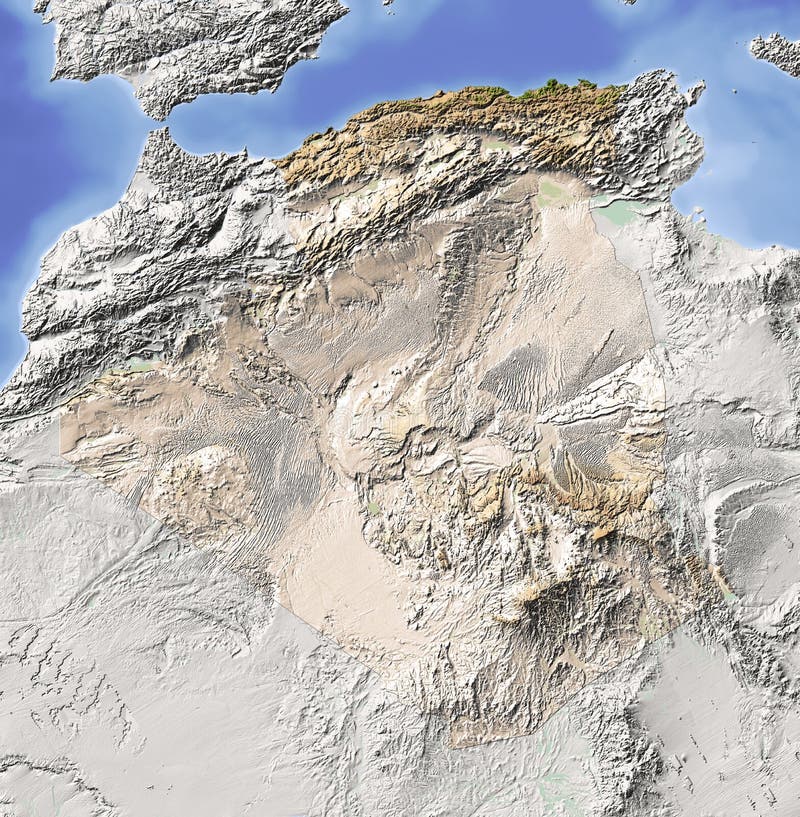
Free with trial Algeria. Shaded relief map. Surrounding territory greyed out. Colored according to vegetation. Includes clip path for the state area. Shaded area illustrations Algeria, shaded relief map. Algeria. Shaded relief map. Surrounding territory greyed out. Colored according to vegetation. Includes clip path for the state area.
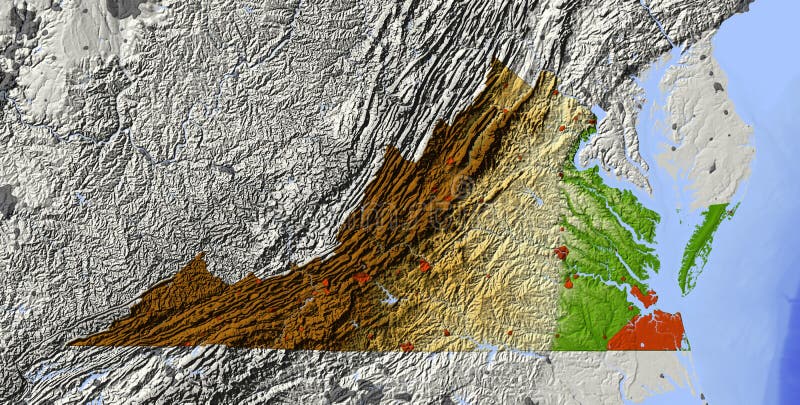
Free with trial Virginia. Shaded relief map. Shows major urban areas and water bodies, surrounding territory greyed out. Colored according to relative elevation. Includes clipping path for the state area. Data sources: US Census Bureau, NASA. Shaded area illustrations Virginia, shaded relief map. Virginia. Shaded relief map. Shows major urban areas and water bodies, surrounding territory greyed out. Colored according to relative elevation. Includes clipping path for the state area. Data sources: US Census Bureau, NASA
Free with trial Utah. Shaded relief map, with major urban areas and rivers, surrounding territory greyed out. Colored according to elevation. Clipping path for the state area included. Projection: Standard Mercator Extents: -115. 0/-108. 5/36. 0/43. 0 Data sources: US Census Bureau, NASA. Shaded area illustrations Utah, shaded relief map. Utah. Shaded relief map, with major urban areas and rivers, surrounding territory greyed out. Colored according to elevation. Clipping path for the state area included. Projection: Standard Mercator Extents: -115.0/-108.5/36.0/43.0 Data sources: US Census Bureau, NASA
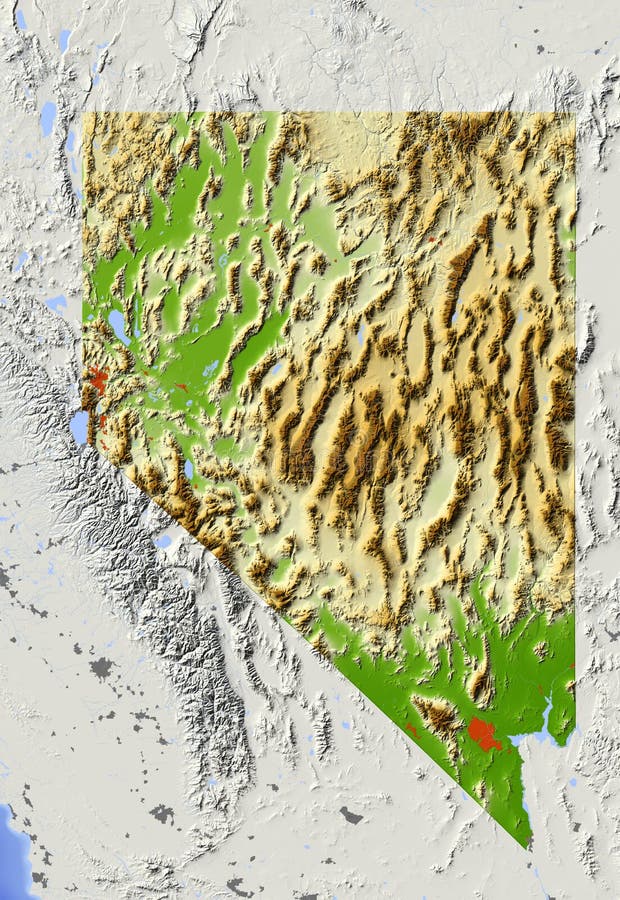
Free with trial Nevada. Shaded relief map, with major urban areas and rivers, surrounding territory greyed out. Colored according to elevation. Clipping path for the state area included. Projection: Standard Mercator Extents: -121. 0/-113. 5/34. 5/43. 0 Data sources: US Census Bureau, NASA. Shaded area illustrations Nevada, shaded relief map. Nevada. Shaded relief map, with major urban areas and rivers, surrounding territory greyed out. Colored according to elevation. Clipping path for the state area included. Projection: Standard Mercator Extents: -121. 0/-113. 5/34. 5/43. 0 Data sources: US Census Bureau, NASA
Free with trial Afghanistan. Shaded relief map. Surrounding territory greyed out. Colored according to vegetation. Includes clip path for the state area. Shaded area illustrations Afghanistan, shaded relief map. Afghanistan. Shaded relief map. Surrounding territory greyed out. Colored according to vegetation. Includes clip path for the state area.
Free with trial Arab Emirates. Shaded relief map. Surrounding territory greyed out. Colored according to elevation. Includes clip path for the state area. Shaded area illustrations Arab Emirates, shaded relief map. Arab Emirates. Shaded relief map. Surrounding territory greyed out. Colored according to elevation. Includes clip path for the state area.
Free with trial Bosnia and Herzegovina. Shaded relief map with major urban areas. Surrounding territory greyed out. Colored according to vegetation. Includes clip path for the state area. Shaded area illustrations Bosnia and Herzegovina, shaded relief map. Bosnia and Herzegovina. Shaded relief map with major urban areas. Surrounding territory greyed out. Colored according to vegetation. Includes clip path for the state area.
Free with trial Austria. Shaded relief map. Surrounding territory greyed out. Colored according to vegetation. Includes clip path for the state area. Shaded area illustrations Austria, shaded relief map. Austria. Shaded relief map. Surrounding territory greyed out. Colored according to vegetation. Includes clip path for the state area.
Free with trial Belgium. Shaded relief map. Surrounding territory greyed out. Colored according to vegetation. Includes clip path for the state area. Shaded area illustrations Belgium, shaded relief map. Belgium. Shaded relief map. Surrounding territory greyed out. Colored according to vegetation. Includes clip path for the state area.
Free with trial Albania. Shaded relief map with major urban areas. Surrounding territory greyed out. Colored according to vegetation. Includes clip path for the state area. Shaded area illustrations Albania, shaded relief map. Albania. Shaded relief map with major urban areas. Surrounding territory greyed out. Colored according to vegetation. Includes clip path for the state area.
Free with trial Bangladesh. Shaded relief map. Surrounding territory greyed out. Colored according to vegetation. Includes clip path for the state area. Shaded area illustrations Bangladesh, shaded relief map. Bangladesh. Shaded relief map. Surrounding territory greyed out. Colored according to vegetation. Includes clip path for the state area.
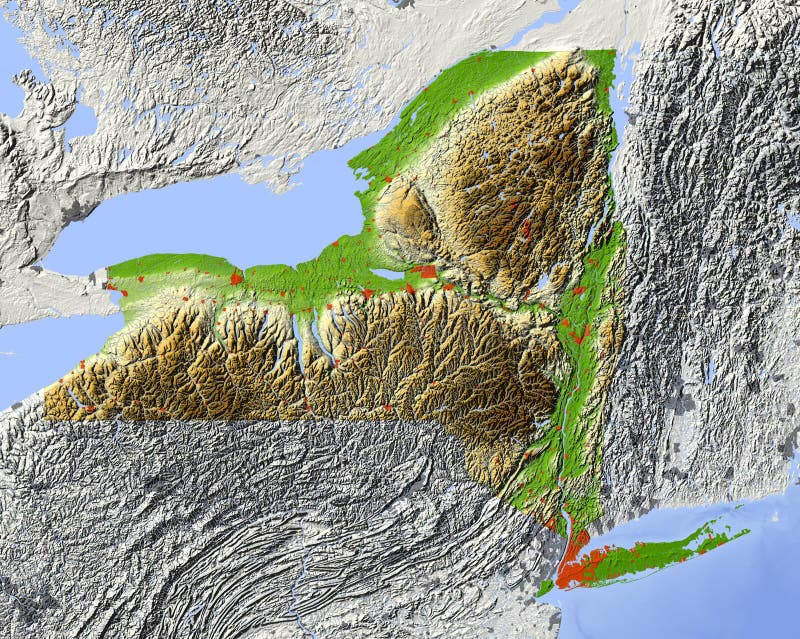
Free with trial State of New York. Shaded relief map. Shows major urban areas and rivers, surrounding territory greyed out. Colored according to relative terrain height. Clipping path for the state area included. Data sources: US Census Bureau, NASA. Shaded area illustrations New York, relief map of state. State of New York. Shaded relief map. Shows major urban areas and rivers, surrounding territory greyed out. Colored according to relative terrain height. Clipping path for the state area included. Data sources: US Census Bureau, NASA
Free with trial Oman. Shaded relief map. Surrounding territory greyed out. Colored according to elevation. Includes clip path for the state area. Shaded area illustrations Oman, relief map. Oman. Shaded relief map. Surrounding territory greyed out. Colored according to elevation. Includes clip path for the state area.
Free with trial Tennessee. Shaded relief map. Shows major urban areas and rivers, surrounding territory greyed out. Colored according to relative terrain height. Clipping path for the state area included. Data sources: US Census Bureau, NASA. Shaded area illustrations Tennessee, relief map. Tennessee. Shaded relief map. Shows major urban areas and rivers, surrounding territory greyed out. Colored according to relative terrain height. Clipping path for the state area included. Data sources: US Census Bureau, NASA
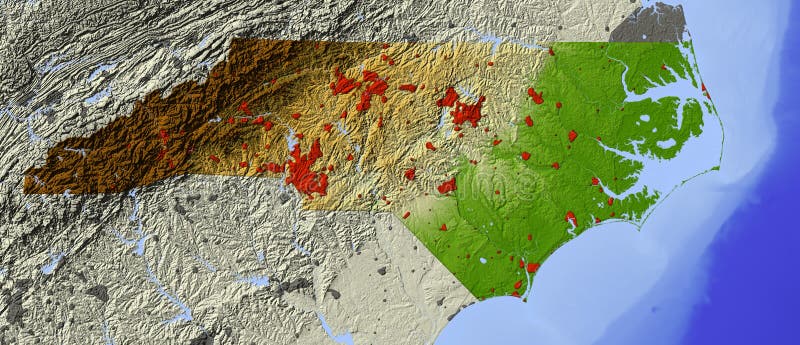
Free with trial North Carolina. Shaded relief map. Shows major urban areas and water bodies, surrounding territory greyed out. Colored according to relative elevation. Includes clipping path for the state area. Data sources: US Census Bureau, NASA. Shaded area illustrations North Carolina, relief map. North Carolina. Shaded relief map. Shows major urban areas and water bodies, surrounding territory greyed out. Colored according to relative elevation. Includes clipping path for the state area. Data sources: US Census Bureau, NASA
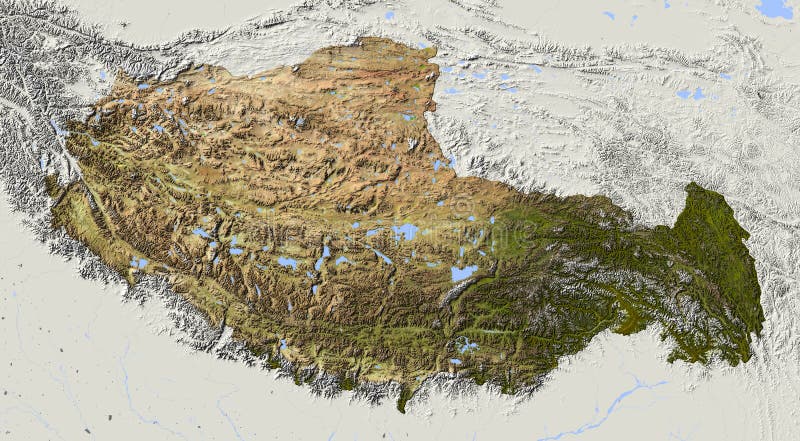
Free with trial Tibet. Shaded relief map. Surrounding territory greyed out. Colored according to elevation and dominant vegetation. Includes clip path for the state area. Shaded area illustrations Tibet, relief map. Tibet. Shaded relief map. Surrounding territory greyed out. Colored according to elevation and dominant vegetation. Includes clip path for the state area.
Free with trial Yemen. Shaded relief map. Surrounding territory greyed out. Colored according to elevation. Includes clip path for the state area. Shaded area illustrations Yemen, relief map. Yemen. Shaded relief map. Surrounding territory greyed out. Colored according to elevation. Includes clip path for the state area.
Free with trial Sweden. Shaded relief map, with major urban areas. Surrounding territory greyed out. Colored according to elevation. Includes clip path for the state area. Shaded area illustrations Sweden, relief map. Sweden. Shaded relief map, with major urban areas. Surrounding territory greyed out. Colored according to elevation. Includes clip path for the state area.
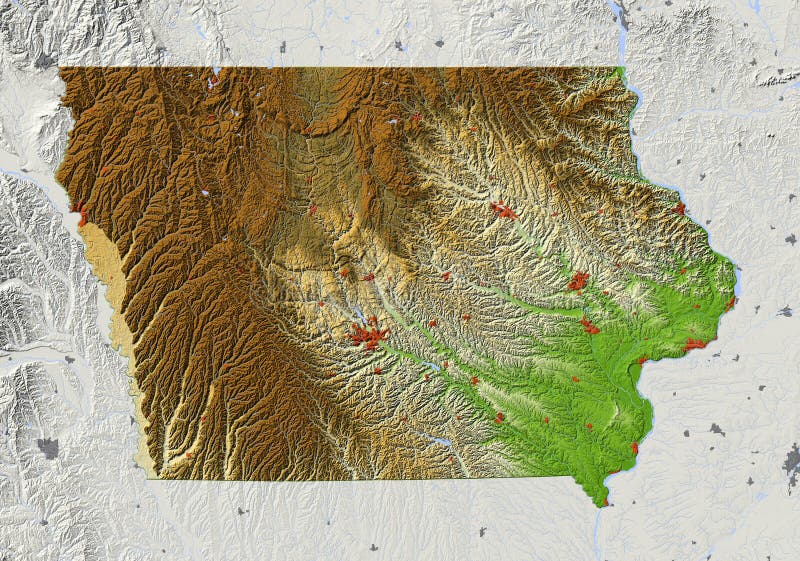
Free with trial Iowa. Shaded relief map. Shows major urban areas and rivers, surrounding territory greyed out. Colored according to relative terrain height. Map projection Mercator. Clipping path for the state area included. Shaded area illustrations Iowa, relief map. Iowa. Shaded relief map. Shows major urban areas and rivers, surrounding territory greyed out. Colored according to relative terrain height. Map projection Mercator. Clipping path for the state area included.
Free with trial Vietnam. Shaded relief map. Surrounding territory greyed out. Colored according to elevation. Includes clip path for the state area. Shaded area illustrations Vietnam, relief map. Vietnam. Shaded relief map. Surrounding territory greyed out. Colored according to elevation. Includes clip path for the state area.
Free with trial Maryland. Shaded relief map. Surrounding territory greyed out. Shows major urban areas and rivers. Colored according to relative elevation. Clipping path for state area included. Shaded area illustrations Maryland, relief map. Maryland. Shaded relief map. Surrounding territory greyed out. Shows major urban areas and rivers. Colored according to relative elevation. Clipping path for state area included.
Free with trial An illustration of some typical wooden garden furniture including cushions. With the vector file, they can be arranged in an order to suit your needs. E. P. S. 10 vector file included with image, isolated on white. Shaded area vectors Garden furniture and sun loungers. An illustration of some typical wooden garden furniture including cushions. With the vector file, they can be arranged in an order to suit your needs. E.P.S. 10 vector file included with image, isolated on white.
Free with trial Map of the U. S. state of Maryland. Shaded area vectors Map of the U.S. state Maryland
Free with trial Map of the U. S. state of North Carolina. Shaded area vectors Map of the U. S. state North Carolina