Free with trial A speedometer with needle racing past the necessary elements in a web traffic growth strategy, from content to links to S. E. O. to increased onilne readership. Speedometer online growth illustrations Web Traffic SEO Links Speedometer Online Growth. A speedometer with needle racing past the necessary elements in a web traffic growth strategy, from content to links to S.E.O. to increased onilne readership
Free with trial Optimize word in red 3d letters and speedometer to illustrate perfecting processes to improve or increase efficiency, productivity and search engine optimization. Speedometer online growth illustrations Optimize Speedometer Word Fast Perfecting Process Efficiency Pro. Optimize word in red 3d letters and speedometer to illustrate perfecting processes to improve or increase efficiency, productivity and search engine optimization
Free with trial Accelerate your online success conceptual illustration: go viral icon with speedometer and growth stats with positive performance. Speedometer online growth illustrations Go viral icon with speedometer and growth stats with positive pe
Free with trial Data chart analysis on dashboard of mobile app set. Tiny people control financial graph growth and diagram of marketing performance in online platform, analyzing reports cartoon vector illustration. Speedometer online growth vectors Data chart analysis on dashboard of mobile app set, tiny people control graph and diagram. Data chart analysis on dashboard of mobile app set. Tiny people control financial graph growth and diagram of marketing performance in online platform, analyzing reports cartoon vector illustration
Free with trial Boost web traffic speedometer. illustration design over a black background. Speedometer online growth illustrations Boost web traffic speedometer. illustration
Free with trial Credit Score. Man Increasing Credit Rating for Low Rates. Interest Rates Dropping. Client Decrease Percent. Concept of Credit Report, Banking Service, Mortgage Loan. Vector illustration for Web Design. Speedometer online growth vectors Credit Score. Man Increasing Credit Rating for Low Rates. Interest Rates Dropping. Client Decrease Percent. Concept of Credit
Free with trial Online shopping, business growth, retail performance, economic trends, analytics, productivity. Shopping basket with upward arrow, speedometer gauge. E-commerce growth and retail performance concept. Speedometer online growth vectors E-commerce Growth and Efficiency Concept with Shopping Basket and Speedometer Icons. Online shopping, business growth, retail performance, economic trends, analytics, productivity. Shopping basket with upward arrow, speedometer gauge. E-commerce growth and retail performance concept
Free with trial Woman examining speedometer as a metaphor for progress, near an online storefront and glowing lightbulb. Ideal for innovation, e-commerce, analytics, business growth, creativity, strategy, simple. Speedometer online growth vectors Woman Analyzing Speedometer with Online Storefront and Lightbulb for Innovation Concept. Woman examining speedometer as a metaphor for progress, near an online storefront and glowing lightbulb. Ideal for innovation, e-commerce, analytics, business growth, creativity, strategy, simple
Free with trial Business performance, growth analytics, user satisfaction, productivity tracking, data visualization, performance metrics. Dashboard with a colorful speedometer, user icon and upward chart. Business. Speedometer online growth illustrations Performance Dashboard with Speedometer Gauge, User Profile Icon, and Growth Chart. Business performance, growth analytics, user satisfaction, productivity tracking, data visualization, performance metrics. Dashboard with a colorful speedometer, user icon and upward chart. Business
Free with trial Scooter with package beside sales graph and speedometer. Ideal for e-commerce, logistics, growth strategy, shipping, business development, efficiency, progress. Simple flat metaphor. Speedometer online growth vectors E-commerce Growth Scooter Delivery Boosts Online Sales and Speed. Scooter with package beside sales graph and speedometer. Ideal for e-commerce, logistics, growth strategy, shipping, business development, efficiency, progress. Simple flat metaphor
Free with trial Speedometer represents performance, dollar sign indicates financial focus, and laptop suggests online tools. Ideal for business, finance, performance, online tools, goal setting, data. Speedometer online growth vectors Financial performance analysis with speedometer gauge and online data access. Speedometer represents performance, dollar sign indicates financial focus, and laptop suggests online tools. Ideal for business, finance, performance, online tools, goal setting, data
Free with trial Pack of icons about website analytics including speedometer, location, team, user, idea, cta, layout and growth. Digital strategy, seo and conversion symbols. Speedometer online growth vectors Website Analytics Icons Set Showing Speedometer, Location, Team, User, Idea, CTA, Layout and Growth. Pack of icons about website analytics including speedometer, location, team, user, idea, cta, layout and growth. Digital strategy, seo and conversion symbols
Free with trial Large cloud shape accompanied by a speedometer and bar chart reflects data storage, speed, performance tracking, digital growth, analytics, business strategy, IT optimization. Simple flat metaphor. Speedometer online growth vectors Cloud Computing Performance Metrics with Speed and Growth Indicators. Large cloud shape accompanied by a speedometer and bar chart reflects data storage, speed, performance tracking, digital growth, analytics, business strategy, IT optimization. Simple flat metaphor
Free with trial Gear symbolizing functionality, graph with shopping carts showing sales growth, and speedometer indicating performance. Ideal for efficiency, e-commerce, strategy, analytics, performance, process. Speedometer online growth vectors E-commerce Optimization with Analytics Graph, Gear, and Speedometer Design. Gear symbolizing functionality, graph with shopping carts showing sales growth, and speedometer indicating performance. Ideal for efficiency, e-commerce, strategy, analytics, performance, process
Free with trial Data analytics, performance tracking, productivity management, business growth, monitoring trends, efficiency analysis. Speedometer gauge and bar chart on a dashboard. Data analytics and performance. Speedometer online growth illustrations Dashboard with Speedometer Gauge and Bar Chart for Data Analytics and Performance Metrics. Data analytics, performance tracking, productivity management, business growth, monitoring trends, efficiency analysis. Speedometer gauge and bar chart on a dashboard. Data analytics and performance
Free with trial Traffic management, speed tracking, digital shopping, data analysis, economy, ecommerce. Traffic light, speedometer shopping basket coin wireless signal. Traffic management and ecommerce concept. Speedometer online growth vectors Traffic Light, Speedometer, and Shopping Basket Icons Monitoring, Speed, and Online Shopping Concepts. Traffic management, speed tracking, digital shopping, data analysis, economy, ecommerce. Traffic light, speedometer shopping basket coin wireless signal. Traffic management and ecommerce concept
Free with trial Financial growth, online retail, e-commerce insights, analytics, business trends, digital economy. Graphic icons include up arrows, shopping cart dollar sign speedometer. Financial growth. Speedometer online growth vectors Financial Growth and E-Commerce Analytics with Dollar Sign, Arrow Trends, Shopping Basket, Meter Icons. Financial growth, online retail, e-commerce insights. Financial growth, online retail, e-commerce insights, analytics, business trends, digital economy. Graphic icons include up arrows, shopping cart dollar sign speedometer. Financial growth
Free with trial Analytics interface with a rising line chart, shopping cart trends, and speedometer gauge. Ideal for performance metrics, business growth, ecommerce, marketing, progress, evaluation simple flat. Speedometer online growth vectors Data Analytics Dashboard with Graphs, Shopping Charts, and Speedometer Gauge. Analytics interface with a rising line chart, shopping cart trends, and speedometer gauge. Ideal for performance metrics, business growth, ecommerce, marketing, progress, evaluation simple flat
Free with trial Set Digital speed meter, Financial growth decrease, Browser window and Online shopping on screen icon. Vector. Speedometer online growth illustrations Set Digital speed meter, Financial growth decrease, Browser window and Online shopping on screen icon. Vector
Free with trial Woman pointing at a speedometer with a shopping bag and stacks of coins nearby. Ideal for finance growth shopping savings budgeting marketing. Speedometer online growth illustrations Woman Pointing at Speedometer with Shopping Bag and Coin Stacks in Background. Woman pointing at a speedometer with a shopping bag and stacks of coins nearby. Ideal for finance growth shopping savings budgeting marketing
Free with trial This image shows a conceptual speedometer indicating a high click through rate or CTR surrounded by a complex network of digital connections highlighting successful online advertising campaigns and effective digital marketing strategies for increasing traffic and engagement. Speedometer online growth illustrations High Click Through Rate Indicated by Futuristic Speedometer with Glowing Background Represents Successful Digital Marketing. This image shows a conceptual speedometer indicating a high click through rate or CTR surrounded by a complex network of digital connections highlighting successful online advertising campaigns and effective digital marketing strategies for increasing traffic and engagement
Free with trial A modern illustration depicting SEO optimization, website speed, and cloud hosting solutions. The graphic features a speedometer, gears, a magnifying glass, and charts, representing website performance and online growth. Speedometer online growth illustrations SEO Optimization, Website Speed, and Cloud Hosting Illustration. A modern illustration depicting SEO optimization, website speed, and cloud hosting solutions. The graphic features a speedometer, gears, a magnifying glass, and charts, representing website performance and online growth.
Free with trial Bar chart, pie chart, speedometer, and cloud graphic convey data analysis, performance tracking, and cloud computing. Ideal for reports, analytics, performance business metrics strategy simple. Speedometer online growth vectors Data Dashboard with Charts, Speedometer, and Cloud for Analytical Insights. Bar chart, pie chart, speedometer, and cloud graphic convey data analysis, performance tracking, and cloud computing. Ideal for reports, analytics, performance business metrics strategy simple
Free with trial Speedometer with pointer beside a green web interface dashboard, signifying speed, analytics, and performance. Ideal for business metrics, optimization, data tracking and simple flat metaphor. Speedometer online growth illustrations Speedometer and web dashboard representing performance monitoring and website optimization. Speedometer with pointer beside a green web interface dashboard, signifying speed, analytics, and performance. Ideal for business metrics, optimization, data tracking and simple flat metaphor
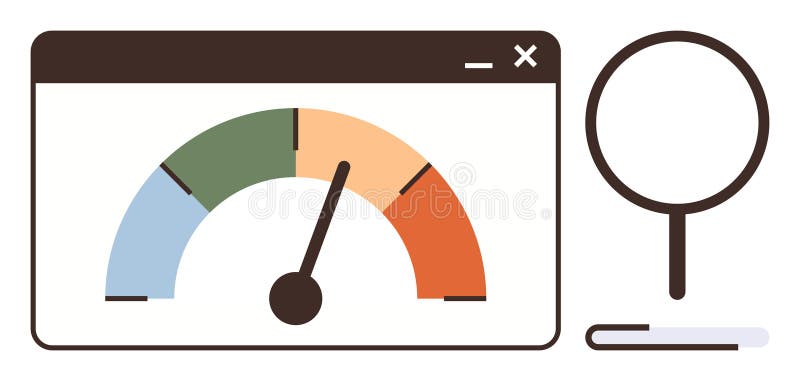
Free with trial Colorful speedometer gauge in a web window with magnifying glass nearby. Ideal for performance, analytics, optimization, efficiency, data evaluation, analysis, progress tracking. Simple flat metaphor. Speedometer online growth vectors Performance Analytics with Speedometer Gauge and Magnifying Glass for Data Insights. Colorful speedometer gauge in a web window with magnifying glass nearby. Ideal for performance, analytics, optimization, efficiency, data evaluation, analysis, progress tracking. Simple flat metaphor
Free with trial Illustration of a growing data processing speed with a stylized chip glowing brightly, a stream of fast-moving binary code, and a simple speedometer. Vector flat icon design on a white background for a computer performance illustration --chaos 30 --ar 16:9 --v 7 Job ID: cec70563-192d-491c-9d05-23ba41b1adb5. Speedometer online growth illustrations Digital Technology Microchip Processing Data with Binary Code and Speedometer. Illustration of a growing data processing speed with a stylized chip glowing brightly, a stream of fast-moving binary code, and a simple speedometer. Vector flat icon design on a white background for a computer performance illustration --chaos 30 --ar 16:9 --v 7 Job ID: cec70563-192d-491c-9d05-23ba41b1adb5
Free with trial Computer screen displaying data analytics charts alongside a speedometer gauge, framed by stylized cloud shapes. Ideal for digital analysis, performance, speed, cloud technology, metrics, efficiency. Speedometer online growth vectors Analytics Dashboard with Speedometer for Performance Monitoring and Cloud Data Integration. Computer screen displaying data analytics charts alongside a speedometer gauge, framed by stylized cloud shapes. Ideal for digital analysis, performance, speed, cloud technology, metrics, efficiency
Free with trial Customer service, business analytics, performance monitoring, data analysis, customer satisfaction, efficiency improvement. Man with headset, graphs and speedometer icons. Customer support. Speedometer online growth vectors Customer Support Agent with Headset, Analytics Dashboard and Speedometer Symbols for Business Efficiency. Customer service, business analytics, performance monitoring, data analysis, customer satisfaction, efficiency improvement. Man with headset, graphs and speedometer icons. Customer support
Free with trial Users are enhancing data transfer and online efficiency, monitoring network capacity using speed indicators on their devices. Speedometer online growth vectors Users improving data transfer and online productivity, measuring network capacity with speedometers on devices. Users are enhancing data transfer and online efficiency, monitoring network capacity using speed indicators on their devices
Free with trial Set line Secure your site with HTTPS SSL Browser window Cloud technology data transfer Online play video Photo retouching Financial growth decrease and Digital speed meter icon. Vector. Speedometer online growth illustrations Set line Secure your site with HTTPS, SSL, Browser window, Cloud technology data transfer, Online play video, Photo. Set line Secure your site with HTTPS SSL Browser window Cloud technology data transfer Online play video Photo retouching Financial growth decrease and Digital speed meter icon. Vector.
Free with trial Speedometer measuring progress, bar chart on screen with a cloud symbol in the background. Ideal for analytics, productivity, cloud computing, digital performance, data processing, technology. Speedometer online growth illustrations Data Analytics Dashboard with Speedometer and Cloud Storage Integration. Speedometer measuring progress, bar chart on screen with a cloud symbol in the background. Ideal for analytics, productivity, cloud computing, digital performance, data processing, technology
Free with trial Image of speedometer over falling icons. Cloud computing, digital interface and security concept digitally generated image. Speedometer online growth illustrations Image of speedometer over falling icons
Free with trial A graphic of a speedometer, stylized like a car's dashboard, with the needle pointing towards high speeds, representing 'Flash Discounts. ' This visual metaphor effectively communicates rapid sales or significant price reductions during a promotional period. Speedometer online growth illustrations Speedometer Indicating Flash Discounts and High Sales. A graphic of a speedometer, stylized like a car's dashboard, with the needle pointing towards high speeds, representing 'Flash Discounts.' This visual metaphor effectively communicates rapid sales or significant price reductions during a promotional period
Free with trial Speedometer graphic with green, yellow, orange, and red segments indicating "Boost Web Traffic" on a light blue background, representing website performance and SEO. Speedometer online growth illustrations Speedometer graphic with green, yellow, orange, and red segments indicating \'Boost Web. Speedometer graphic with green, yellow, orange, and red segments indicating "Boost Web Traffic" on a light blue background, representing website performance and SEO
Free with trial This illustration shows a man analyzing business performance with a tablet, with graphs and a speedometer indicating growth, success, and improvement in business strategy. Speedometer online growth illustrations Illustration of business performance analysis with a man holding a tablet. This illustration shows a man analyzing business performance with a tablet, with graphs and a speedometer indicating growth, success, and improvement in business strategy
Free with trial World Internet day wallpaper with speedometer and typography under it. Speedometer online growth illustrations World Internet day wallpaper with speedometer and typography under it
Free with trial Computer screen illustration featuring internet-related icons. Central globe symbolizes global connectivity. Surrounding icons include a magnifying glass for search, a speedometer indicating performance, a line graph showing growth, and a checklist. Blue and gray color scheme with "WWW" acronym in the foreground. Gear in the background suggests technical aspects. Overall theme reflects web browsing, performance analysis, and digital connections. Speedometer online growth vectors Illustration of Increasing Domain Authority in SEO: Backlink Strategy, Trust, and Search Visibility. Computer screen illustration featuring internet-related icons. Central globe symbolizes global connectivity. Surrounding icons include a magnifying glass for search, a speedometer indicating performance, a line graph showing growth, and a checklist. Blue and gray color scheme with "WWW" acronym in the foreground. Gear in the background suggests technical aspects. Overall theme reflects web browsing, performance analysis, and digital connections.
Free with trial This image represents financial growth, investment, and economic progress. It includes icons of money, charts, and digital tools, symbolizing wealth accumulation and success. Speedometer online growth vectors Vector art of financial growth and investment strategies, showcasing wealth accumulation and economic progress through digital. This image represents financial growth, investment, and economic progress. It includes icons of money, charts, and digital tools, symbolizing wealth accumulation and success
Free with trial A clean and modern infographic illustration showcasing cloud computing, data analysis, and business growth concepts. The image features a cloud icon connected to various data visualization elements such as bar graphs, line graphs, pie charts, and a speedometer. Binary code elements are incorporated, suggesting a digital and technological focus. The design is minimalist, using a cool color palette, and is suitable for presentations, reports, and website graphics related to technology, finance, and data science. Speedometer online growth illustrations Cloud Computing and Data Analysis Infographic. A clean and modern infographic illustration showcasing cloud computing, data analysis, and business growth concepts. The image features a cloud icon connected to various data visualization elements such as bar graphs, line graphs, pie charts, and a speedometer. Binary code elements are incorporated, suggesting a digital and technological focus. The design is minimalist, using a cool color palette, and is suitable for presentations, reports, and website graphics related to technology, finance, and data science.
Free with trial Generating maximum sales concept with green speedometer showing full, backdrop. Speedometer online growth illustrations Generating maximum sales concept with green speedometer showing full, backdrop
Free with trial Speedometer measuring website performance with a needle pointing in the effective area. Speedometer online growth vectors Speedometer showing website performance analytics data. Speedometer measuring website performance with a needle pointing in the effective area
Free with trial Red and White 3D Rocket Illustration with Speedometer. Image. Speedometer online growth illustrations Red and White 3D Rocket Illustration with Speedometer
Free with trial Graph line with connecting points, CCTV camera over cloud, and speedometer gauge highlight data analysis, security, and performance. Ideal for surveillance, analytics, monitoring, cloud technology. Speedometer online growth illustrations Data Monitoring and Security Concept with Graph, CCTV Camera, and Speedometer. Graph line with connecting points, CCTV camera over cloud, and speedometer gauge highlight data analysis, security, and performance. Ideal for surveillance, analytics, monitoring, cloud technology
Free with trial Woman pointing at a speedometer, indicating analysis or measure of performance. Nearby are a dollar sign symbol and a shopping cart. Ideal for finance, shopping, performance metrics, sales analysis. Speedometer online growth vectors Woman Pointing at Speedometer with Dollar Sign and Shopping Cart Next to Her. Woman pointing at a speedometer, indicating analysis or measure of performance. Nearby are a dollar sign symbol and a shopping cart. Ideal for finance, shopping, performance metrics, sales analysis
Free with trial Increasing engagement on social media concept representation with speedometer backdrop. Colorful, business, leads, response. Speedometer online growth illustrations Increasing engagement on social media concept representation with speedometer backdrop. Colorful, business, leads, response
Free with trial Image of speedometer over network of digital icons and statistical data processing. Global networking and business technology concept. Speedometer online growth illustrations Image of speedometer over network of digital icons and statistical data processing
Free with trial Set line Digital speed meter Mobile stock trading and Financial growth icon. Vector. Speedometer online growth illustrations Set line Digital speed meter, Mobile stock trading and Financial growth icon. Vector
Free with trial This image showcases a set of business and marketing icons, perfect for representing various aspects of strategy, communication, success, and growth in a modern style. Speedometer online growth vectors Vector art of business and marketing icons set, representing strategy, communication, success, and growth in a clean and modern. This image showcases a set of business and marketing icons, perfect for representing various aspects of strategy, communication, success, and growth in a modern style
Free with trial Computer monitor displaying "WWW" with a globe icon, suggesting internet or SEO relevance. Surrounding it are symbols: a checklist, magnifying glass, speedometer, and upward graph, representing factors like search optimization, trust, and performance metrics. The color scheme is blue and gray, conveying professionalism and technology focus. In the background, a gear icon suggests functional or technical aspects. The arrangement symbolizes strategies in enhancing domain authority and online visibility. Speedometer online growth vectors Illustration of Increasing Domain Authority in SEO: Backlink Strategy, Trust, and Search Visibility. Computer monitor displaying "WWW" with a globe icon, suggesting internet or SEO relevance. Surrounding it are symbols: a checklist, magnifying glass, speedometer, and upward graph, representing factors like search optimization, trust, and performance metrics. The color scheme is blue and gray, conveying professionalism and technology focus. In the background, a gear icon suggests functional or technical aspects. The arrangement symbolizes strategies in enhancing domain authority and online visibility.
Free with trial A collection of four 3D rendered icons representing business analytics, growth, performance metrics, and innovative ideas, isolated on a white background. Speedometer online growth illustrations 3D Rendered Icons for Business Analytics and Idea Generation. A collection of four 3D rendered icons representing business analytics, growth, performance metrics, and innovative ideas, isolated on a white background
Free with trial This set of clean, minimalist icons represents various aspects of logistics, delivery, and optimization. It includes elements like optimized paths, route planning with map pins, delivery trucks, package tracking, speedometers indicating efficiency, and growth charts. These icons are ideal for illustrating concepts related to supply chain management, shipping services, navigation apps, and business performance. Speedometer online growth illustrations Logistics and Delivery Icons Set. This set of clean, minimalist icons represents various aspects of logistics, delivery, and optimization. It includes elements like optimized paths, route planning with map pins, delivery trucks, package tracking, speedometers indicating efficiency, and growth charts. These icons are ideal for illustrating concepts related to supply chain management, shipping services, navigation apps, and business performance.
Free with trial Data analytics and velocity analysis line icon. Company strategy data presentation, finance statistic infographics or business database analytics linear vector symbol with car speedometer. Speedometer online growth vectors Data analytics and velocity analysis line icon
Free with trial SEO digital marketing and business web icons vector set for online strategy. Clean line art style on a gradient background, high resolution, with isolated elements. Ideal for websites, app design, presentations, banners, and infographic visuals. Speedometer online growth illustrations SEO Digital Marketing Business Web Line Icons Vector Set. SEO digital marketing and business web icons vector set for online strategy. Clean line art style on a gradient background, high resolution, with isolated elements. Ideal for websites, app design, presentations, banners, and infographic visuals.
Free with trial Person working on laptop computer while clicking wireless mouse on desk. virtual screen displaying performance speedometer. Speedometer online growth illustrations Professional worker hand using wireless mouse to click while working on computer in office. Person working on laptop computer while clicking wireless mouse on desk. virtual screen displaying performance speedometer
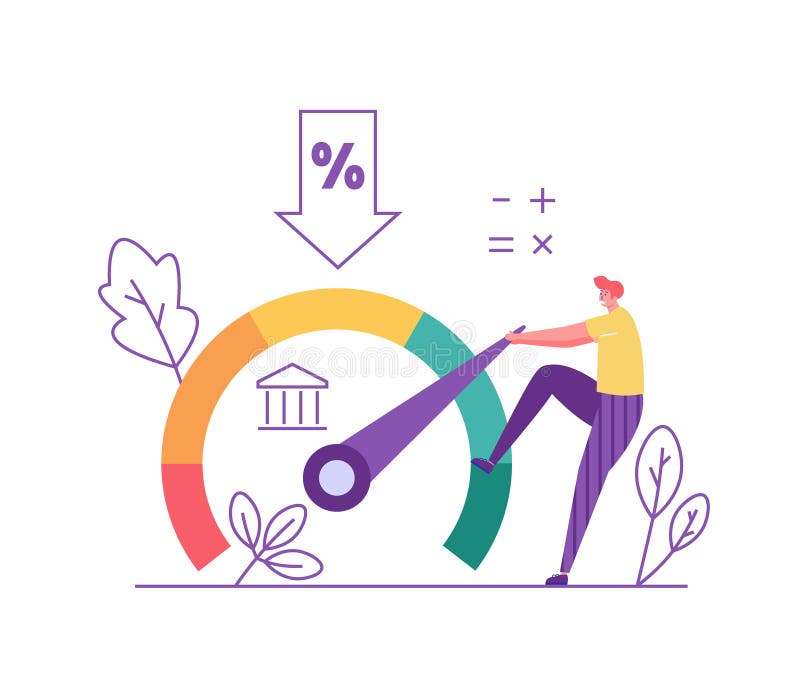
Free with trial A businessman in suit pushing a percent sign for your needs. Concept for online bank or your finance company. Special offer, sale, gift. Vector illustration. Speedometer online growth vectors A businessman in suit pushing a percent sign for your needs. Concept for online bank or your finance company. Special
Free with trial A businessman in suit pushing a percent sign for your needs. Concept for online bank or your finance company. Special offer, sale, gift. Vector illustration. Speedometer online growth vectors A businessman in suit pushing a percent sign for your needs. Concept for online bank or your finance company. Special
Free with trial Seo and online marketing icons High-Quality Vector Icons Collection with Editable Stroke. Ideal for Professional and Creative Projects. Speedometer online growth vectors Seo and online marketing icons High-Quality Vector Icons Collection with Editable Stroke. Ideal for Professional and
Free with trial A stylized rocket ship blasts off into a blue sky filled with clouds, trailing fire and smoke. Attached to the rocket is a prominent progress bar, visually indicating 75% completion, symbolizing speed, progress, and achievement. Perfect for concepts of growth and development. Speedometer online growth illustrations Rocket Ship Launching with Progress Bar Showing 75% Completion. A stylized rocket ship blasts off into a blue sky filled with clouds, trailing fire and smoke. Attached to the rocket is a prominent progress bar, visually indicating 75% completion, symbolizing speed, progress, and achievement. Perfect for concepts of growth and development
Free with trial A clean, flat design illustration representing a digital dashboard or analytics interface. The graphic features a stylized browser window with three circular control buttons at the top. Inside, a bar chart shows increasing data points in yellow, teal, and red. To the right, a gauge or speedometer-like element indicates a reading, suggesting performance or progress. This icon is ideal for representing data analysis, business intelligence, website performance, financial reporting, and digital metrics in a modern, accessible style. Speedometer online growth vectors Flat Design Business Analytics Dashboard Icon. A clean, flat design illustration representing a digital dashboard or analytics interface. The graphic features a stylized browser window with three circular control buttons at the top. Inside, a bar chart shows increasing data points in yellow, teal, and red. To the right, a gauge or speedometer-like element indicates a reading, suggesting performance or progress. This icon is ideal for representing data analysis, business intelligence, website performance, financial reporting, and digital metrics in a modern, accessible style.
Free with trial Boost website performance and loading speed with this 3d rocket and speedometer symbolizing optimization and fast web experience on a pastel background vector illustration. Speedometer online growth vectors 3D Website Speed Optimization Rocket Concept. Boost website performance and loading speed with this 3d rocket and speedometer symbolizing optimization and fast web experience on a pastel background vector illustration
Free with trial Time management, productivity tools, data analysis, business scheduling, remote work, goal tracking. Woman working with laptop near a calendar and speed monitoring display. Time management. Speedometer online growth vectors Businesswoman Using Laptop with Scheduler and Speed Measurement Display Concept. Time management, productivity tools, data analysis, business scheduling, remote work, goal tracking. Woman working with laptop near a calendar and speed monitoring display. Time management
Free with trial Illustration depicting business performance monitoring with a speedometer gauge in red, yellow, and green segments. A magnifying glass and two gears are positioned behind the gauge, symbolizing analysis and mechanical processes. A graph with an upward-trending red arrow is shown, indicating financial growth or success. The elements are set against a light blue background, emphasizing data analysis and performance evaluation themes. Speedometer online growth vectors Vector monitoring of business performance and financial success. Illustration depicting business performance monitoring with a speedometer gauge in red, yellow, and green segments. A magnifying glass and two gears are positioned behind the gauge, symbolizing analysis and mechanical processes. A graph with an upward-trending red arrow is shown, indicating financial growth or success. The elements are set against a light blue background, emphasizing data analysis and performance evaluation themes.
Free with trial Website analytics, dashboard concept, business presentations, marketing reports, interface chart, diagram, indicator meter. Speedometer online growth vectors Website analytics dashboard concept for business presentations and marketing reports. Website analytics, dashboard concept, business presentations, marketing reports, interface chart, diagram, indicator meter
Free with trial A comprehensive set of conceptual icons blending standard wireless signal bars with various industry metaphors including logistics, smart home, and environmental technology. Speedometer online growth vectors Wireless Connectivity Hybrid Signal Icons. A comprehensive set of conceptual icons blending standard wireless signal bars with various industry metaphors including logistics, smart home, and environmental technology.
Free with trial Maximum conversion rate in business concept background with node turning right, backdrop. Speedometer online growth illustrations Maximum conversion rate in business concept background with node turning right, backdrop
Free with trial Illustration depicting SEO concepts with three ascending pink bars labeled 1, 2, and 3, indicating ranking order. A magnifying glass hovers above, symbolizing search. Accompanying elements include a checklist with check marks and a speedometer gauge, represented in shades of blue, suggesting analysis and performance metrics. The background is a neutral gray, focusing attention on the thematic elements of search engine optimization. Speedometer online growth vectors Search engine ranking, Search engine analysis, SEO success concept. Illustration depicting SEO concepts with three ascending pink bars labeled 1, 2, and 3, indicating ranking order. A magnifying glass hovers above, symbolizing search. Accompanying elements include a checklist with check marks and a speedometer gauge, represented in shades of blue, suggesting analysis and performance metrics. The background is a neutral gray, focusing attention on the thematic elements of search engine optimization.
Free with trial Illustration featuring three ascending pink bars numbered 1, 2, and 3. A magnifying glass hovers over a blue rectangular area at the top. Additional elements include a line graph on the left and a speedometer-like gauge on the right. The background is a light beige color with blue and white circular accents, suggesting a concept of analysis and ranking. Speedometer online growth vectors Search engine ranking, Search engine analysis, SEO success concept. Illustration featuring three ascending pink bars numbered 1, 2, and 3. A magnifying glass hovers over a blue rectangular area at the top. Additional elements include a line graph on the left and a speedometer-like gauge on the right. The background is a light beige color with blue and white circular accents, suggesting a concept of analysis and ranking.
Free with trial A vibrant collection of 3D rendered app icons representing key aspects of productivity, goal setting, and achievement. The design features a dynamic arrangement of icons, including a speedometer, checklist, lightbulb, target, and various other symbols, suggesting progress, planning, and innovative ideas within a business or project management context. The bright, playful color palette and smooth,. Speedometer online growth vectors Colorful 3D App Icons Productivity, Goals, and Success, Business Concept. A vibrant collection of 3D rendered app icons representing key aspects of productivity, goal setting, and achievement. The design features a dynamic arrangement of icons, including a speedometer, checklist, lightbulb, target, and various other symbols, suggesting progress, planning, and innovative ideas within a business or project management context. The bright, playful color palette and smooth,
Free with trial The image features four icons related to technology and internet services. The top left icon depicts a hand with the index finger pointing upwards, as if clicking or selecting something. The top right icon shows a computer monitor displaying a graph with the numbers '0570' and '0410' on it. The bottom left icon represents a briefcase with an upward-pointing arrow, symbolizing growth or increase. Speedometer online growth vectors This is a icons related to technology and internet services. The image features four icons related to technology and internet services. The top left icon depicts a hand with the index finger pointing upwards, as if clicking or selecting something. The top right icon shows a computer monitor displaying a graph with the numbers '0570' and '0410' on it. The bottom left icon represents a briefcase with an upward-pointing arrow, symbolizing growth or increase.
Free with trial An icon representing the acceleration of modern commerce. Speedometer online growth vectors Ecommerce Performance and Sales Velocity Concept. An icon representing the acceleration of modern commerce
Free with trial A vibrant flat design illustration of a satisfaction or performance meter with the needle pointing to the excellent green zone. Cartoon characters celebrate on the gauge, holding positive icons like a happy emoji, a star, and a thumbs-up. This concept symbolizes high customer satisfaction, excellent service, positive user feedback, quality rating, and achieving business goals. It's a perfect visual for presentations, websites, and marketing materials related to reviews, KPIs, and user experience (UX). Speedometer online growth illustrations Customer Satisfaction Meter and Positive Feedback Concept. A vibrant flat design illustration of a satisfaction or performance meter with the needle pointing to the excellent green zone. Cartoon characters celebrate on the gauge, holding positive icons like a happy emoji, a star, and a thumbs-up. This concept symbolizes high customer satisfaction, excellent service, positive user feedback, quality rating, and achieving business goals. It's a perfect visual for presentations, websites, and marketing materials related to reviews, KPIs, and user experience (UX).
Free with trial Illustration in flat style depicting a computer monitor with various elements symbolizing website performance analysis. Includes a magnifying glass, a speedometer, a gear, a chart, and a code icon. The color scheme uses teal and cream, representing digital analysis and optimization concepts. The arrangement suggests tools for assessing website loading speed and SEO features. Speedometer online growth vectors Website performance analysis, SEO tools, Website loading speed test, illustration in flat style. Illustration in flat style depicting a computer monitor with various elements symbolizing website performance analysis. Includes a magnifying glass, a speedometer, a gear, a chart, and a code icon. The color scheme uses teal and cream, representing digital analysis and optimization concepts. The arrangement suggests tools for assessing website loading speed and SEO features.
Free with trial Digital illustration depicting a web page with search engine interface elements. Graphical icons include a speedometer, magnifying glass, and a ranked column chart labeled 1, 2, 3 in ascending order. Soft blue and pink color scheme highlights elements signifying analysis and ranking. The layout suggests concepts related to search engine optimization (SEO) and performance evaluation, emphasizing progress and success in digital visibility. Speedometer online growth vectors Search engine ranking, Search engine analysis, SEO success concept. Digital illustration depicting a web page with search engine interface elements. Graphical icons include a speedometer, magnifying glass, and a ranked column chart labeled 1, 2, 3 in ascending order. Soft blue and pink color scheme highlights elements signifying analysis and ranking. The layout suggests concepts related to search engine optimization (SEO) and performance evaluation, emphasizing progress and success in digital visibility.
Free with trial This vibrant illustration depicts a stylized meter, transitioning from red to green, symbolizing a spectrum of customer satisfaction. Four diverse individuals are actively engaged on the meter's arc. One holds a smiling emoji, another a golden star, a third works on a laptop, and the fourth proudly displays a 'thumbs up' icon. The scene conveys positive feedback, customer success, and the pursuit of excellent service or product quality. Speedometer online growth illustrations Customer Satisfaction Meter with Happy People and Positive Feedback Icons. This vibrant illustration depicts a stylized meter, transitioning from red to green, symbolizing a spectrum of customer satisfaction. Four diverse individuals are actively engaged on the meter's arc. One holds a smiling emoji, another a golden star, a third works on a laptop, and the fourth proudly displays a 'thumbs up' icon. The scene conveys positive feedback, customer success, and the pursuit of excellent service or product quality.
Free with trial Interface design for a loan management system featuring financial icons. Central screen displays a dollar symbol, lines for text, and a bar graph. Surrounding icons include a money bag, document, speedometer, percentage, cloud, shield, clock, and check mark, each within a glowing turquoise circle. The layout suggests various key features and services related to loan management. Dark background enhances the illuminated elements, creating a modern, digital aesthetic. Speedometer online growth illustrations Loan management system interface with financial icons representing key features and services. Interface design for a loan management system featuring financial icons. Central screen displays a dollar symbol, lines for text, and a bar graph. Surrounding icons include a money bag, document, speedometer, percentage, cloud, shield, clock, and check mark, each within a glowing turquoise circle. The layout suggests various key features and services related to loan management. Dark background enhances the illuminated elements, creating a modern, digital aesthetic.
Free with trial Savingsicons High-Quality Vector Icons Collection with Editable Stroke. Ideal for Professional and Creative Projects. Speedometer online growth vectors Savingsicons High-Quality Vector Icons Collection with Editable Stroke. Ideal for Professional and Creative Projects.
Free with trial High-Quality Vector Icons Collection with Editable Stroke. Ideal for Professional and Creative Projects. Speedometer online growth vectors Seo and online marketing icons High-Quality Vector Icons Collection with Editable Stroke. Ideal for Professional and. High-Quality Vector Icons Collection with Editable Stroke. Ideal for Professional and Creative Projects.