Free with trial Road infographic. Curved road timeline with red pins checkpoint. Strategy journey highway with milestones vector concept. Starting point timeline vectors Road infographic. Curved road timeline with red pins checkpoint. Strategy journey highway with milestones concept
Free with trial Roadmap infographic with steps process. Infographic for presentation. Vector illustration. Starting point timeline vectors Roadmap infographic with steps process
Free with trial Vector illustration infographic using image of a winding road with steps needed along the way to finish task, project, or goal. Starting point timeline vectors Vector illustration infographic of winding road with steps. vector illustration infographic using image of a winding road with steps needed along the way to finish task, project, or goal
Free with trial Roadmap Infographic With Six Sequential Steps Starting Point And Goal Destination Arrow Path Vector Illustration. Starting point timeline vectors Roadmap Infographic With Six Sequential Steps Starting Point And Goal Destination Arrow Path Vector Design
Free with trial A conceptual infographic design illustrating a business process with colorful bars representing steps from a starting point through negative phases to a successful final ending point. Created AI. Starting point timeline illustrations Abstract business progress chart showing steps from starting to ending point. A conceptual infographic design illustrating a business process with colorful bars representing steps from a starting point through negative phases to a successful final ending point.Created AI
Free with trial Manager stands at strategic roadmap start point, goal glows ahead amid supportive 3D team scene. Starting point timeline illustrations Strategic Roadmap with Manager at Starting Point and Glowing Goal Surrounded by Team Encouragement in 3D Digital Setting. Manager stands at strategic roadmap start point, goal glows ahead amid supportive 3D team scene
Free with trial Image features two flowcharts on white backgrounds a circular process diagram with labeled steps and another chart with five steps flowing towards a Start point. Starting point timeline vectors Two White Background Flowcharts One Circular Process Diagram, Another with Steps Towards Start Point. Image features two flowcharts on white backgrounds a circular process diagram with labeled steps and another chart with five steps flowing towards a Start point
Free with trial An abstract illustration of a growth process, starting from a single point and branching through various stages. Starting point timeline vectors Strategic Development Path Diagram. An abstract illustration of a growth process, starting from a single point and branching through various stages
Free with trial This image illustrates a winding road labeled 'Timeline Road,' representing a project timeline with key milestones marked along the way. Each milestone is indicated by a red pin with a distinct icon and a small description box that likely contains details about specific tasks, phases, or achievements. The road curves through various stages, showing a progression from the starting point to the end. Starting point timeline illustrations Visual representation of a project timeline roadmap with key milestones isolated on white background. This image illustrates a winding road labeled 'Timeline Road,' representing a project timeline with key milestones marked along the way. Each milestone is indicated by a red pin with a distinct icon and a small description box that likely contains details about specific tasks, phases, or achievements. The road curves through various stages, showing a progression from the starting point to the end
Free with trial This image illustrates a winding road labeled 'Timeline Road,' representing a project timeline with key milestones marked along the way. Each milestone is indicated by a red pin with a distinct icon and a small description box that likely contains details about specific tasks, phases, or achievements. The road curves through various stages, showing a progression from the starting point to the end. Starting point timeline illustrations Visual representation of a project timeline roadmap with key milestones isolated on white background. This image illustrates a winding road labeled 'Timeline Road,' representing a project timeline with key milestones marked along the way. Each milestone is indicated by a red pin with a distinct icon and a small description box that likely contains details about specific tasks, phases, or achievements. The road curves through various stages, showing a progression from the starting point to the end
Free with trial An abstract illustration representing the complex and often winding path of a medical treatment journey. The path begins at a starting point and progresses through twists and turns, ultimately leading to a star, symbolizing successful recovery, healing, and achieving a health goal. Starting point timeline illustrations Winding Path of a Patients Treatment Journey. An abstract illustration representing the complex and often winding path of a medical treatment journey. The path begins at a starting point and progresses through twists and turns, ultimately leading to a star, symbolizing successful recovery, healing, and achieving a health goal
Free with trial An open book lays bare a simple yet profound story of transformation. The left page, marked Before, represents a starting point, while the right page, After, signifies progress, change, and results. This minimalist composition is a powerful metaphor for growth, development, and the impact of change over time. Starting point timeline illustrations Open Book Showing Before and After Transformation. An open book lays bare a simple yet profound story of transformation. The left page, marked Before, represents a starting point, while the right page, After, signifies progress, change, and results. This minimalist composition is a powerful metaphor for growth, development, and the impact of change over time
Free with trial Roadmap infographic with steps process infographic world map background. Infographic for presentation. Vector illustration. Starting point timeline vectors Roadmap infographic with steps process infographic world map background
Free with trial A simple, clean graphic depicting a dotted red line representing a journey, with a black dollar sign pin at the starting point and a red pin at the destination. Starting point timeline vectors Geolocation with dollar currency symbols dashed line arrow route path location pin. A simple, clean graphic depicting a dotted red line representing a journey, with a black dollar sign pin at the starting point and a red pin at the destination.
Free with trial A clean, minimalist graphic featuring a series of horizontal lines with circular endpoints, arranged vertically. The top line has a numerical indicator '1/0' next to its starting point. The lines vary. Starting point timeline vectors Minimalist Graph Lines with Progress Indicator. A clean, minimalist graphic featuring a series of horizontal lines with circular endpoints, arranged vertically. The top line has a numerical indicator '1/0' next to its starting point. The lines vary
Free with trial Minimalist vector graphic of a strategic route. A curved line with an arrow shows direction, starting from a point and navigating past obstacles marked by crosses. Starting point timeline vectors Strategic path icon illustrating a planned route with a start and finish. Minimalist vector graphic of a strategic route. A curved line with an arrow shows direction, starting from a point and navigating past obstacles marked by crosses
Free with trial A hand is carefully stacking three wooden blocks, clearly displaying the numbers 1, 2, and 3 in ascending order. This symbolizes concepts like sequence, step-by-step processes, priority setting, or a foundational beginning. Starting point timeline illustrations Hand Stacking Wooden Blocks 1 2 3 - Sequence, Priority, Steps, Order Concept. A hand is carefully stacking three wooden blocks, clearly displaying the numbers 1, 2, and 3 in ascending order. This symbolizes concepts like sequence, step-by-step processes, priority setting, or a foundational beginning
Free with trial A close-up, low-angle shot features the metallic, silver numbers "2026" standing on a deep blue base, prominently placed on a highly polished, dark wood conference table. The glossy surface strongly reflects the numbers, creating an inverted, blurred image below. To the left, a spiral-bound notepad rests, slightly out of focus. The background is an executive boardroom setting, rendered in a soft. Starting point timeline illustrations 2026 Year Planning on a Corporate Boardroom Table. A close-up, low-angle shot features the metallic, silver numbers "2026" standing on a deep blue base, prominently placed on a highly polished, dark wood conference table. The glossy surface strongly reflects the numbers, creating an inverted, blurred image below. To the left, a spiral-bound notepad rests, slightly out of focus. The background is an executive boardroom setting, rendered in a soft
Free with trial Road map infographic elements and space for data. Concept of successive steps of company process. Vector illustration. Starting point timeline vectors Road map infographic elements and space for data
Free with trial A visual representation of a business journey, illustrated as a winding road from a starting point in the mountains to a final goal. This infographic template uses icons and connection points to showcase milestones, strategy, and progress, ideal for presentations on project management or corporate development. Starting point timeline illustrations Strategic Path to Success Infographic Roadmap. A visual representation of a business journey, illustrated as a winding road from a starting point in the mountains to a final goal. This infographic template uses icons and connection points to showcase milestones, strategy, and progress, ideal for presentations on project management or corporate development
Free with trial A close-up, low-angle shot of a bright yellow line painted on dark asphalt pavement. Black numbers, including "0, 1, 2, 3, 4, 5," are stenciled sequentially along the line, creating a sense of progression or measurement. The asphalt shows visible cracks and small pebbles, indicating wear and age, with subtle tire marks in the background. This image evokes concepts of a starting point, a journey, data, or urban infrastructure. It's suitable for themes related to progress, road markings, construction, or sequential processes. Starting point timeline illustrations Numbered Yellow Line on Cracked Asphalt Pavement. A close-up, low-angle shot of a bright yellow line painted on dark asphalt pavement. Black numbers, including "0, 1, 2, 3, 4, 5," are stenciled sequentially along the line, creating a sense of progression or measurement. The asphalt shows visible cracks and small pebbles, indicating wear and age, with subtle tire marks in the background. This image evokes concepts of a starting point, a journey, data, or urban infrastructure. It's suitable for themes related to progress, road markings, construction, or sequential processes.
Free with trial A close-up, shallow depth of field shot captures the silver, three-dimensional numerals "2026" resting on a prominent blue base plate, positioned on a rich, dark wooden conference table. The foreground objects, including a laptop screen and stacks of paper visible to the left, are slightly out of focus, emphasizing the year marker. The background is dramatically blurred with a warm, golden bokeh. Starting point timeline illustrations Year 2026 3D Numbers on Office Desk Bokeh Background. A close-up, shallow depth of field shot captures the silver, three-dimensional numerals "2026" resting on a prominent blue base plate, positioned on a rich, dark wooden conference table. The foreground objects, including a laptop screen and stacks of paper visible to the left, are slightly out of focus, emphasizing the year marker. The background is dramatically blurred with a warm, golden bokeh
Free with trial Business growth and financial history concept photo. Hand placing wooden blocks showing the year 2007 with small green seedlings. Growing in soil on a table. Starting point timeline illustrations Business growth and financial history concept photo. Hand placing wooden blocks showing the year 2007 with small green seedlings. Growing in soil on a table
Free with trial Business growth and financial history concept photo. Hand placing wooden blocks showing the year 2007 with small green seedlings growing in soil on a table. Starting point timeline illustrations Business growth and financial history concept photo. Hand placing wooden blocks showing the year 2007 with small green seedlings
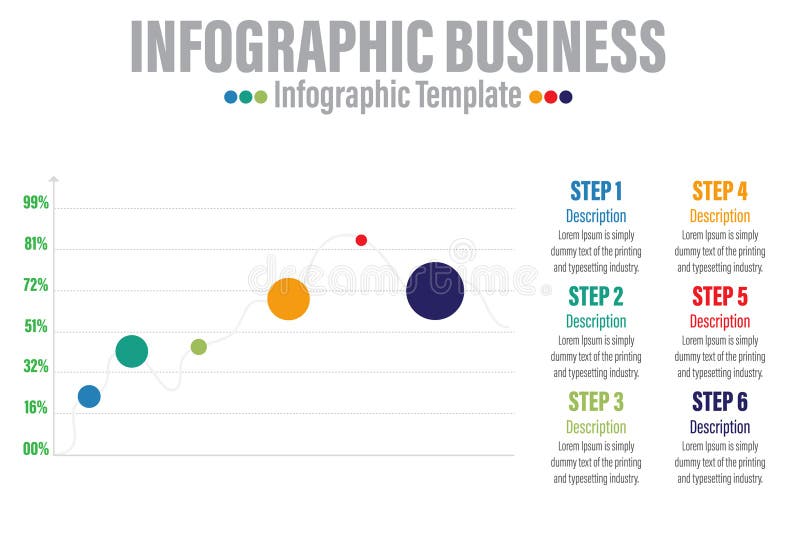
Free with trial Timeline infographic template with 6 steps, 6 option 6 dot steps and starting point. Growth curve chart with sample text. Grey colors and multicolored points. Vector illustration. Starting point timeline vectors Timeline infographic template with 6 steps, 6 option 6 dot steps and starting point. Growth curve chart with sample text . Grey
Free with trial Timeline infographic template with 6 steps, 6 option 6 dot steps and starting point. Growth curve chart with sample text. Grey colors and multicolored points. Vector illustration. Starting point timeline vectors Timeline infographic template with 6 steps, 6 option 6 dot steps and starting point. Growth curve chart with sample text . Grey
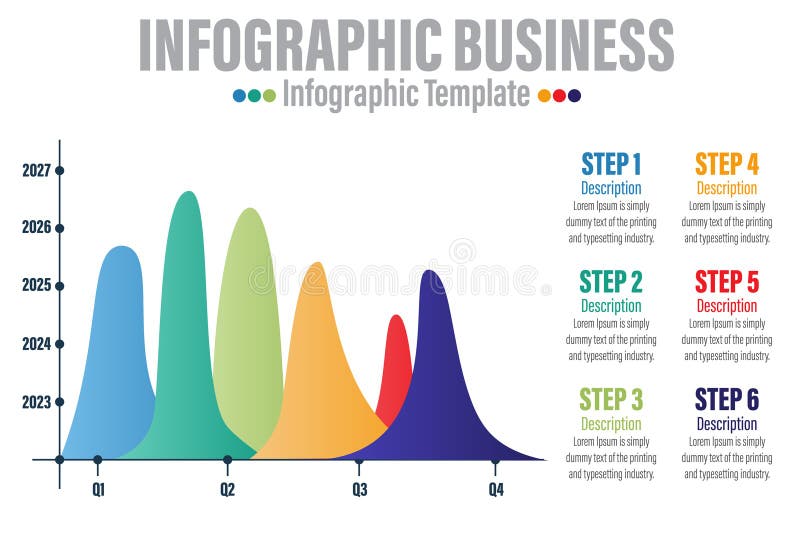
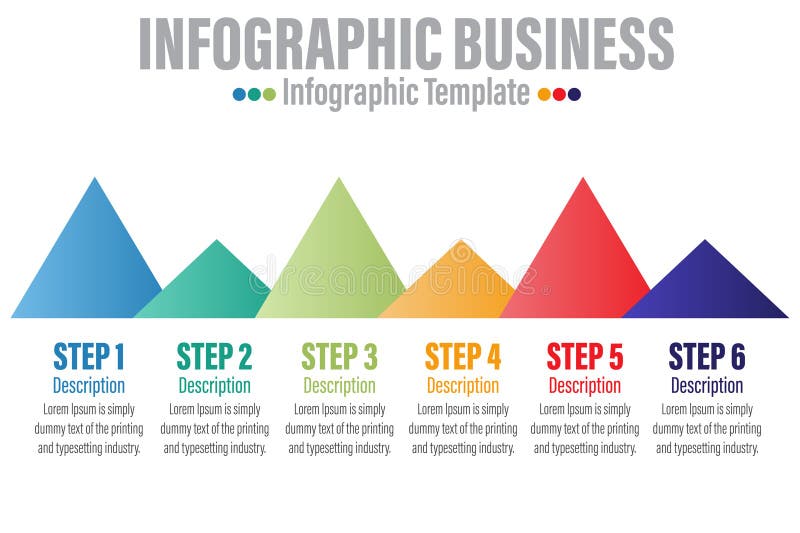
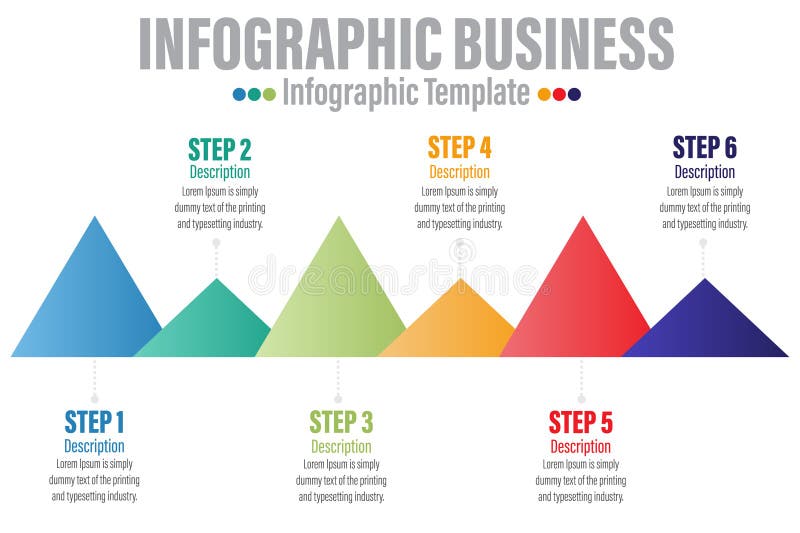
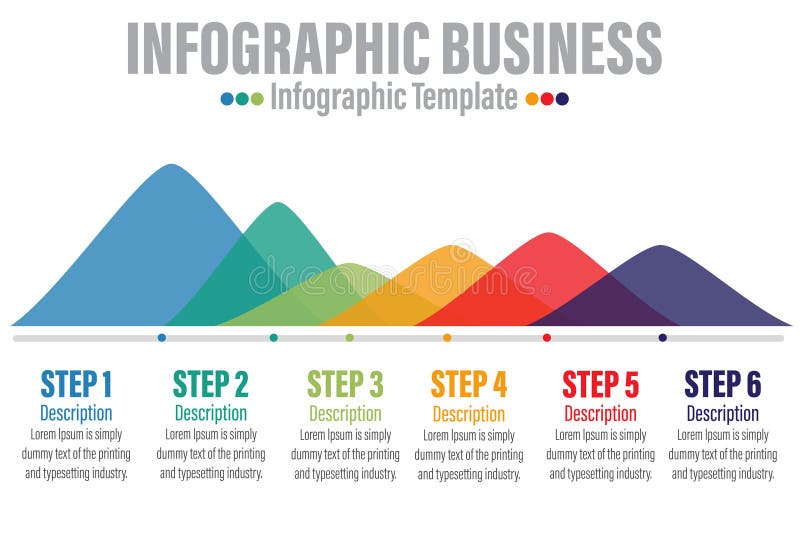
Free with trial Timeline infographic template with 6 steps, 6 option 6 dot steps and starting point. Growth curve chart with sample text. Colorful and multicolored points. Vector illustration. Starting point timeline vectors Timeline infographic template with 6 steps, 6 option 6 dot steps and starting point. Growth curve chart with sample text .
Free with trial Timeline infographic template with 6 steps, 6 option 6 dot steps and starting point. Growth curve chart with sample text. Colorful and multicolored points. Vector illustration. Starting point timeline vectors Timeline infographic template with 6 steps, 6 option 6 dot steps and starting point. Growth curve chart with sample text .
Free with trial Timeline infographic template with 6 steps, 6 option 6 dot steps and starting point. Growth curve chart with sample text. Colorful and multicolored points. Vector illustration. Starting point timeline vectors Timeline infographic template with 6 steps, 6 option 6 dot steps and starting point. Growth curve chart with sample text .
Free with trial Timeline infographic template with 6 steps, 6 option 6 dot steps and starting point. Growth curve chart with sample text. Colorful and multicolored points. Vector illustration. Starting point timeline vectors Timeline infographic template with 6 steps, 6 option 6 dot steps and starting point. Growth curve chart with sample text .
Free with trial Timeline infographic template with 6 steps, 6 option 6 dot steps and starting point. Growth curve chart with sample text. Colorful and multicolored points. Vector illustration. Starting point timeline vectors Timeline infographic template with 6 steps, 6 option 6 dot steps and starting point. Growth curve chart with sample text .
Free with trial Pixel infographic design for commercial success necessitates four processes and elements. Create a timeline infographic design template. Diagrams, flowcharts, and business-starting activities. Starting point timeline vectors Business infographic in 4-step pixel style for operations planning. Pixel infographic design for commercial success necessitates four processes and elements. Create a timeline infographic design template. Diagrams, flowcharts, and business-starting activities.
Free with trial Route Icon or Logo Vector Illustration Isolated Sign Symbol - High Quality Black Style Vector Icon. Starting point timeline vectors Route Icon Vector Symbol Design Illustration. Route Icon or Logo Vector Illustration Isolated Sign Symbol - High Quality Black Style Vector Icon