Free with trial Analytics scanning data visualization screen illustration dashboard metrics, interface display, graph chplot analytics scanning data visualization screen. Summary analytics illustrations Analytics scanning data visualization screen
Free with trial Close-up of a phone held in hand displaying an advanced analytics dashboard with colorful metrics, charts, and KPIs. Summary analytics illustrations Hand holding phone with analytics dashboard. Close-up of a phone held in hand displaying an advanced analytics dashboard with colorful metrics, charts, and KPIs
Free with trial This vibrant infographic showcases comprehensive football statistics and analytics through a variety of data visualization elements. It features bar charts, pie charts, donut charts, and hexagonal diagrams displaying percentages related to offensive efficiency, defensive strength, and other key performance indicators. The clean, modern design with a blue, green, and yellow color scheme makes it ideal for illustrating sports performance, game analysis, and strategic insights. Perfect for presentations, reports, articles, and digital content focused on football analytics, coaching, or sports business. Summary analytics vectors Football Statistics and Analytics Infographic. This vibrant infographic showcases comprehensive football statistics and analytics through a variety of data visualization elements. It features bar charts, pie charts, donut charts, and hexagonal diagrams displaying percentages related to offensive efficiency, defensive strength, and other key performance indicators. The clean, modern design with a blue, green, and yellow color scheme makes it ideal for illustrating sports performance, game analysis, and strategic insights. Perfect for presentations, reports, articles, and digital content focused on football analytics, coaching, or sports business.
Free with trial This black and white vector illustration features a comprehensive collection of essential business and data analytics icons, neatly arranged within a circular frame. The set includes various bar charts representing growth and statistics, a pie chart for data distribution, a document icon symbolizing reports or financial statements, and a folder icon possibly indicating file management, security, or project organization. Ideal for illustrating concepts related to finance, strategy, performance, information management, and data visualization in presentations, websites, or applications. Summary analytics vectors Business Data Analytics and Reporting Icons Set. This black and white vector illustration features a comprehensive collection of essential business and data analytics icons, neatly arranged within a circular frame. The set includes various bar charts representing growth and statistics, a pie chart for data distribution, a document icon symbolizing reports or financial statements, and a folder icon possibly indicating file management, security, or project organization. Ideal for illustrating concepts related to finance, strategy, performance, information management, and data visualization in presentations, websites, or applications.
Free with trial AI improves data dashboard and analytics system by optimizing data, analytics, and business intelligence for accurate real-time performance insight Vouch. Summary analytics illustrations AI-assisted data dashboard and analytics for intelligent monitoring Vouch. AI improves data dashboard and analytics system by optimizing data, analytics, and business intelligence for accurate real-time performance insight Vouch
Free with trial Elevate your projects with modern analytics and insights illustrations set. Clean, scalable vectors for dashboards, apps, and presentations. Summary analytics vectors A flat style illustration depicting summary report. Elevate your projects with modern analytics and insights illustrations set. Clean, scalable vectors for. Elevate your projects with modern analytics and insights illustrations set. Clean, scalable vectors for dashboards, apps, and presentations.
Free with trial A modern silver laptop sits on a clean white desk, prominently displaying a comprehensive e-commerce analytics dashboard. The screen features a dark mode interface with various data visualizations, including dynamic pie charts showing percentages like 51. 5% and 91. 5%, trending line graphs, and insightful bar charts illustrating performance. This image effectively represents business intelligence, online sales tracking, digital marketing analysis, and financial growth. It's ideal for themes related to technology, data analysis, modern business operations, and remote work environments, set against a bright, blurred background. Summary analytics illustrations E-commerce Analytics Dashboard on Laptop Screen. A modern silver laptop sits on a clean white desk, prominently displaying a comprehensive e-commerce analytics dashboard. The screen features a dark mode interface with various data visualizations, including dynamic pie charts showing percentages like 51.5% and 91.5%, trending line graphs, and insightful bar charts illustrating performance. This image effectively represents business intelligence, online sales tracking, digital marketing analysis, and financial growth. It's ideal for themes related to technology, data analysis, modern business operations, and remote work environments, set against a bright, blurred background.
Free with trial A high-tech digital dashboard displaying various data analytics and graphs. Summary analytics illustrations Futuristic Digital Dashboard with Data Analytics. A high-tech digital dashboard displaying various data analytics and graphs
Free with trial AI improves data dashboard and analytics system by optimizing data, analytics, and business intelligence for accurate real-time performance insight Vouch. Summary analytics illustrations AI-assisted data dashboard and analytics for intelligent monitoring Vouch. AI improves data dashboard and analytics system by optimizing data, analytics, and business intelligence for accurate real-time performance insight Vouch
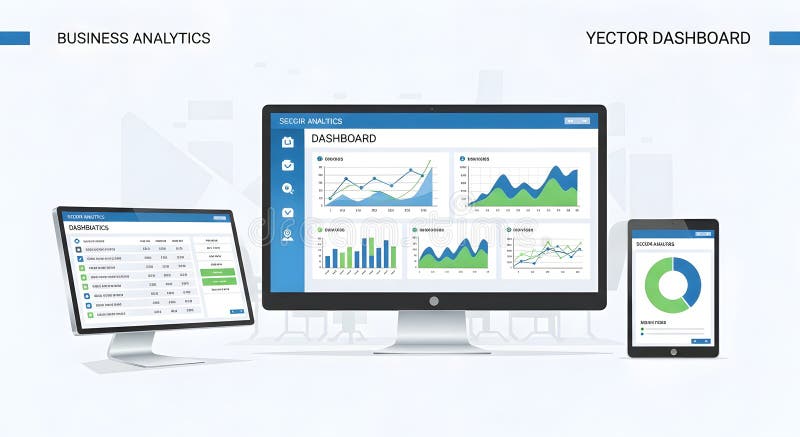
Free with trial A comprehensive illustration showcasing business analytics dashboards displayed across various digital devices: a desktop monitor, a tablet, and a smartphone. The screens feature diverse data visualizations including line graphs, bar charts, area charts, detailed tables, and a donut chart, all presented in a clean, modern, and responsive design. This image effectively conveys the concept of multi-device access to critical business intelligence, financial data, and performance metrics, ideal for technology, finance, and marketing contexts. Summary analytics illustrations Business Analytics Dashboards on Multiple Devices. A comprehensive illustration showcasing business analytics dashboards displayed across various digital devices: a desktop monitor, a tablet, and a smartphone. The screens feature diverse data visualizations including line graphs, bar charts, area charts, detailed tables, and a donut chart, all presented in a clean, modern, and responsive design. This image effectively conveys the concept of multi-device access to critical business intelligence, financial data, and performance metrics, ideal for technology, finance, and marketing contexts.
Free with trial A professional data science visualization displaying a Shapley value summary plot, used for interpreting complex machine learning models by showing individual feature contributions to model predictions. Created AI. Summary analytics illustrations Shapley value summary plot for machine learning feature importance analysis. A professional data science visualization displaying a Shapley value summary plot, used for interpreting complex machine learning models by showing individual feature contributions to model predictions.Created AI
Free with trial A high-tech Page displaying various data analytics and graphs in blue hue Page. Summary analytics illustrations Futuristic Data Page with Blue Analytics Dashboard. A high-tech Page displaying various data analytics and graphs in blue hue Page
Free with trial A clean, modern icon illustrating data analytics and business intelligence. The central graphic features a prominent line graph with data points, overlaid on a bar chart background. Four smaller charts, including additional bar graphs and a pie chart, are displayed in rectangular frames around the main visualization. Rendered in a flat design style with a clear blue and grey color palette, outlined in black on a white background. This versatile vector is ideal for representing data analysis, financial reporting, market trends, statistical information, and performance metrics in websites, applications, presentations, and infographics. Summary analytics illustrations Data Analytics Dashboard Icon with Multiple Charts. A clean, modern icon illustrating data analytics and business intelligence. The central graphic features a prominent line graph with data points, overlaid on a bar chart background. Four smaller charts, including additional bar graphs and a pie chart, are displayed in rectangular frames around the main visualization. Rendered in a flat design style with a clear blue and grey color palette, outlined in black on a white background. This versatile vector is ideal for representing data analysis, financial reporting, market trends, statistical information, and performance metrics in websites, applications, presentations, and infographics.
Free with trial A comprehensive financial data analytics dashboard displaying various charts and graphs for stock performance, quantity, and asset allocation. Summary analytics illustrations Detailed financial data analytics dashboard display. A comprehensive financial data analytics dashboard displaying various charts and graphs for stock performance, quantity, and asset allocation
Free with trial Vector line icons for business intelligence: dashboards, insight tree, report, data summary. icons. Summary analytics illustrations Vector line icons for business intelligence: dashboards, insight tree, report, data summary
Free with trial An informative Shapley value summary plot displaying positive and negative feature contributions, used for interpreting complex machine learning model outcomes and predictive data analysis in professional reports. Created AI. Summary analytics illustrations Shapley value summary plot for machine learning data analysis and visualization. An informative Shapley value summary plot displaying positive and negative feature contributions, used for interpreting complex machine learning model outcomes and predictive data analysis in professional reports.Created AI
Free with trial This image showcases minimalist vector graphics designed for data visualization and analytics. It features clean lines and vibrant colors that illustrate various data patterns and trends through simple charts, graphs, and symbols. This modern design serves well for business reports and presentations, effectively summarizing complex information into an easily digestible format. Created with AI. Summary analytics vectors Minimalist Vectors for Data Visualization and Analytics. This image showcases minimalist vector graphics designed for data visualization and analytics. It features clean lines and vibrant colors that illustrate various data patterns and trends through simple charts, graphs, and symbols. This modern design serves well for business reports and presentations, effectively summarizing complex information into an easily digestible format. Created with AI.
Free with trial A sleek, modern laptop is open and positioned on a clean white surface. The screen prominently displays a vibrant blue business analytics dashboard filled with various charts and graphs, including bar charts, line graphs, and pie charts. This visual represents data analysis, financial reporting, business intelligence, and digital strategy, making it ideal for concepts related to technology, finance, and corporate decision-making. Summary analytics illustrations Modern Laptop Displaying Business Analytics Dashboard. A sleek, modern laptop is open and positioned on a clean white surface. The screen prominently displays a vibrant blue business analytics dashboard filled with various charts and graphs, including bar charts, line graphs, and pie charts. This visual represents data analysis, financial reporting, business intelligence, and digital strategy, making it ideal for concepts related to technology, finance, and corporate decision-making.
Free with trial A clean and modern 3D rendering of a business data analytics dashboard, showcasing various charts and graphs in a minimalist style. It features bar charts, line graphs, and a donut chart, along with other data elements, all presented in a soft pastel color palette of light blue and peach. This digital interface concept is ideal for illustrating business intelligence, financial reporting, market analysis, and strategic planning. Perfect for technology, finance, and marketing presentations, websites, or reports. Summary analytics illustrations Minimalist 3D Data Analytics Dashboard with Pastel Charts. A clean and modern 3D rendering of a business data analytics dashboard, showcasing various charts and graphs in a minimalist style. It features bar charts, line graphs, and a donut chart, along with other data elements, all presented in a soft pastel color palette of light blue and peach. This digital interface concept is ideal for illustrating business intelligence, financial reporting, market analysis, and strategic planning. Perfect for technology, finance, and marketing presentations, websites, or reports.
Free with trial Close-up of a hand interacting with data visualizations on a laptop showing summary reports and graphs, crucial for informed business decision making and performance tracking. Impute. Summary analytics illustrations Business Analysis with Interactive Summary Report and Data Visualization on Laptop Screen for Financial Decision Making. Close-up of a hand interacting with data visualizations on a laptop showing summary reports and graphs, crucial for informed business decision making and performance tracking. Impute
Free with trial A modern monitor displaying colorful data visualizations and analytics. Summary analytics illustrations A modern monitor displaying colorful data visualizations and analytics
Free with trial Data Analytics in Real Estate & Construction Word Cloud. Composition of Words Related to Property Investment, Market Analysis, and Decision-Making Process. Summary analytics illustrations Data Analytics in Real Estate & Construction Word Cloud
Free with trial This flat design depicts a financial report with charts and a calculator, symbolizing accounting, analytics, and business strategies in a modern style. Summary analytics vectors Financial Report with Calculator Icon Depicting Analytics and Accounting Concepts for Business. This flat design depicts a financial report with charts and a calculator, symbolizing accounting, analytics, and business strategies in a modern style.
Free with trial Collection of isometric icons and charts illustrating business analytics and digital marketing metrics for growth. Summary analytics illustrations Isometric Business Data Analytics Dashboard Icons and Charts. Collection of isometric icons and charts illustrating business analytics and digital marketing metrics for growth
Free with trial Data analytics dashboard with charts, indicators, and performance metrics, reveals trends, data analytics drives growth, supports insight, and data analytics improves decisions. Marrow. Summary analytics illustrations Data Analytics Dashboard for Business and Financial Insight Marrow. Data analytics dashboard with charts, indicators, and performance metrics, reveals trends, data analytics drives growth, supports insight, and data analytics improves decisions. Marrow
Free with trial This image features a clean, minimal analytics interface with a white background. It highlights various data visualizations, perfect for modern business presentations. Summary analytics illustrations Clean Minimal Analytics Interface Design in White Background. This image features a clean, minimal analytics interface with a white background. It highlights various data visualizations, perfect for modern business presentations
Free with trial Health analytics and reporting outline icon set featuring medical dashboards performance metrics statistics visualization and healthcare insights. Summary analytics vectors Health analytics reporting outline icons for medical dashboards. Health analytics and reporting outline icon set featuring medical dashboards performance metrics statistics visualization and healthcare insights
Free with trial Health analytics and reporting solid icon set representing healthcare intelligence outcome measurement financial tracking and operational efficiency. Summary analytics vectors Health analytics reporting solid icons for performance tracking. Health analytics and reporting solid icon set representing healthcare intelligence outcome measurement financial tracking and operational efficiency
Free with trial Data dashboard and analytics system supports business, analytics, and data insights through centralized charts, statistics, and monitoring interface Vouch. Summary analytics illustrations Data dashboard and analytics system for business intelligence Vouch. Data dashboard and analytics system supports business, analytics, and data insights through centralized charts, statistics, and monitoring interface Vouch
Free with trial A 3D rendered scene depicting business analytics concepts, featuring an arrangement of colorful bar graphs, a pie. Summary analytics illustrations Business Analytics Data Charts and Graphs. A 3D rendered scene depicting business analytics concepts, featuring an arrangement of colorful bar graphs, a pie.
Free with trial Health analytics and reporting outline icon collection illustrating big data trends predictive analysis hospital reporting and strategic planning. Summary analytics vectors Health analytics reporting outline icons for predictive planning. Health analytics and reporting outline icon collection illustrating big data trends predictive analysis hospital reporting and strategic planning
Free with trial Analytics data stream from the open house event infographic clear illustration real time, metrics dashboard, flow audience analytics data stream from the open house event infographic clear. Summary analytics illustrations Analytics data stream from the open house event infographic clear
Free with trial A modern workspace featuring a computer displaying data analytics and charts. Summary analytics illustrations A modern workspace featuring a computer displaying data analytics and charts
Free with trial Businessman sitting at a desk reviews document status on his laptop with an interactive virtual interface displaying quality review and approval summary. Summary analytics illustrations Businessman reviewing document status on a laptop with quality review and approval summary. Businessman sitting at a desk reviews document status on his laptop with an interactive virtual interface displaying quality review and approval summary.
Free with trial A flat vector illustration depicting a web browser or application interface featuring a business analytics dashboard. The screen displays user profile cards on the left, indicating user management or segmentation, alongside a dynamic bar chart and line graph on the right, symbolizing data trends, growth, and performance metrics. Decorative green and orange leaves frame the bottom, adding a touch of organic design. Ideal for concepts related to digital marketing, data analysis, online reporting, and business intelligence. Summary analytics illustrations Business Analytics Dashboard with User Profiles and Growth Chart. A flat vector illustration depicting a web browser or application interface featuring a business analytics dashboard. The screen displays user profile cards on the left, indicating user management or segmentation, alongside a dynamic bar chart and line graph on the right, symbolizing data trends, growth, and performance metrics. Decorative green and orange leaves frame the bottom, adding a touch of organic design. Ideal for concepts related to digital marketing, data analysis, online reporting, and business intelligence.
Free with trial A comprehensive heatmap analytics dashboard providing data visualization for business insights, featuring various charts and graphs to analyze trends and patterns. Summary analytics illustrations Heatmap Analytics Dashboard - Data Visualization for Business Insights. A comprehensive heatmap analytics dashboard providing data visualization for business insights, featuring various charts and graphs to analyze trends and patterns
Free with trial Health analytics and reporting solid icon collection highlighting medical research charts data evaluation and performance optimization tools. Summary analytics vectors Health analytics reporting solid icons for research evaluation tools. Health analytics and reporting solid icon collection highlighting medical research charts data evaluation and performance optimization tools
Free with trial A blurry image of a marketing growth analytics dashboard featuring multiple charts and graphs. Summary analytics illustrations Marketing growth analytics dashboard with various charts and graphs. A blurry image of a marketing growth analytics dashboard featuring multiple charts and graphs
Free with trial A businessman in a suit points to a virtual screen with a business intelligence dashboard. He is accessing a summary of financial data, charts, and graphs, representing concepts of modern technology, data analysis, and digital transformation. Summary analytics illustrations Businessman touching a futuristic virtual interface for a data summary. A businessman in a suit points to a virtual screen with a business intelligence dashboard. He is accessing a summary of financial data, charts, and graphs, representing concepts of modern technology, data analysis, and digital transformation
Free with trial The image depicts a clipboard with various types of graphical data representations, including bar charts, a line graph, a pie chart, and a table. These visual elements are commonly used in business and data analytics to illustrate performance metrics, trends, financial reports, and statistical summaries. The clipboard symbolizes organization, planning, and the presentation of key information in a. Summary analytics illustrations Clipboard showcasing data analytics and business performance metrics. The image depicts a clipboard with various types of graphical data representations, including bar charts, a line graph, a pie chart, and a table. These visual elements are commonly used in business and data analytics to illustrate performance metrics, trends, financial reports, and statistical summaries. The clipboard symbolizes organization, planning, and the presentation of key information in a
Free with trial Dynamic data visualization pie chart on digital background with glowing lines. Close-up analytics dashboard showing trends and statistics. Business intelligence, finance or tech concept. Summary analytics illustrations Dynamic data visualization pie chart on digital background with glowing lines. Close-up analytics dashboard showing trends and
Free with trial A person's hand touching a virtual screen with a summary button. This concept represents business intelligence, data analysis, information review, and technology for creating executive summaries and reports. The background is a cityscape at night. Summary analytics illustrations Business technology concept with a summary button on a virtual interface. A person's hand touching a virtual screen with a summary button. This concept represents business intelligence, data analysis, information review, and technology for creating executive summaries and reports. The background is a cityscape at night
Free with trial A sleek smartphone displaying detailed business analytics, showcasing financial insights through graphs and charts on a modern user interface for effective decision-making. Summary analytics illustrations Modern Smartphone Displaying Business Analytics and Financial Insights. A sleek smartphone displaying detailed business analytics, showcasing financial insights through graphs and charts on a modern user interface for effective decision-making
Free with trial Data analytics dashboard with charts, indicators, and performance metrics, reveals trends, data analytics drives growth, supports insight, and data analytics improves decisions. Vouch. Summary analytics illustrations Data Analytics Dashboard for Business and Financial Insight Vouch. Data analytics dashboard with charts, indicators, and performance metrics, reveals trends, data analytics drives growth, supports insight, and data analytics improves decisions. Vouch
Free with trial Clean analytics dashboard with colorful charts on monitor. AI-generated. Summary analytics illustrations Clean analytics dashboard with colorful charts on monitor. AI-generated
Free with trial Futuristic Data Analytics Dashboard Hologram Interface 3D Render Tech. Summary analytics illustrations Futuristic Data Analytics Dashboard Hologram Interface 3D Render Tech
Free with trial Data Analytics Word Cloud. Compilation of Words Related to Data Analysis, Machine Learning, and Visualization Concepts. Perfect for Learning Materials. Summary analytics illustrations Data Analytics Word Cloud
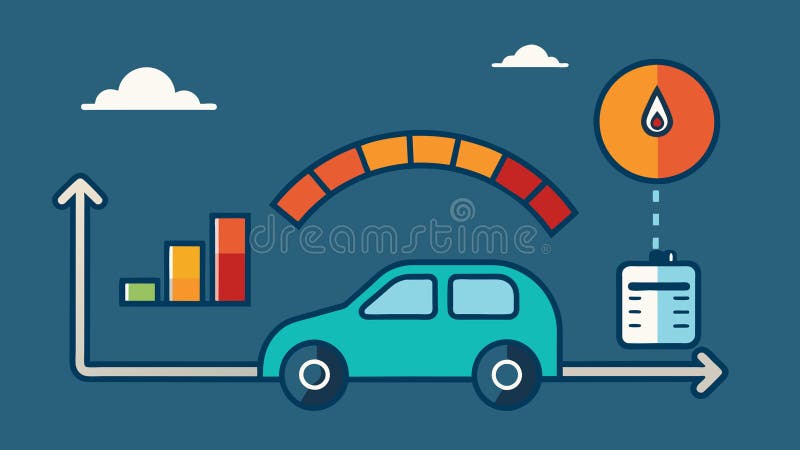
Free with trial A summary of the distance traveled and average fuel consumption over a certain period of time.. Vector illustration. Summary analytics illustrations A summary of the distance traveled and average fuel consumption over a certain period of time.. Vector illustration.
Free with trial A modern tablet computer is prominently displayed on a clean, minimalist light grey surface, showcasing a vibrant array of blue digital charts, graphs, and data visualizations on its screen. This image powerfully conveys concepts of business intelligence, financial analysis, market trends, and technological innovation. It's ideal for themes related to data analytics, corporate strategy, digital finance, performance reporting, and future technology solutions. Summary analytics illustrations Digital Tablet Displaying Business Data Analytics and Financial Charts. A modern tablet computer is prominently displayed on a clean, minimalist light grey surface, showcasing a vibrant array of blue digital charts, graphs, and data visualizations on its screen. This image powerfully conveys concepts of business intelligence, financial analysis, market trends, and technological innovation. It's ideal for themes related to data analytics, corporate strategy, digital finance, performance reporting, and future technology solutions.
Free with trial Presentation showing 3d dashboard interface with world map and analytics charts keywords: dashboard, interface, analytics, data, charts, graphs. Summary analytics illustrations 3D Dashboard Interface with World Map and Analytics Charts Keywords: dashboard, interface, analytics, data, charts
Free with trial A sleek digital tablet on a reflective surface projects multiple holographic screens into the air. These translucent displays showcase a futuristic user interface with various business analytics dashboards, including charts, graphs, project summaries, and task lists. This concept image represents cutting-edge technology like augmented reality, data visualization, business intelligence, and the future of project management. It's ideal for illustrating themes of innovation, digital transformation, corporate strategy, and modern workflow. Summary analytics illustrations Futuristic Business Analytics and Project Management on a Digital Tablet. A sleek digital tablet on a reflective surface projects multiple holographic screens into the air. These translucent displays showcase a futuristic user interface with various business analytics dashboards, including charts, graphs, project summaries, and task lists. This concept image represents cutting-edge technology like augmented reality, data visualization, business intelligence, and the future of project management. It's ideal for illustrating themes of innovation, digital transformation, corporate strategy, and modern workflow.
Free with trial The image displays a 3D illustration of a business analytics dashboard. It features various data visualization elements such as a bar graph with an upward trend, a pie chart divided into different colored segments, and a set of horizontal lines resembling a menu or data list. The background is a light blue color, and the entire illustration is presented on a slightly darker blue rectangular base. Summary analytics illustrations 3d illustration of a business analytics dashboard with charts and graphs. The image displays a 3D illustration of a business analytics dashboard. It features various data visualization elements such as a bar graph with an upward trend, a pie chart divided into different colored segments, and a set of horizontal lines resembling a menu or data list. The background is a light blue color, and the entire illustration is presented on a slightly darker blue rectangular base
Free with trial Colorful pie chart. Data visualization vector. Statistical graph representation. Business analytics diagram. EPS 10. Summary analytics vectors Colorful pie chart. Data visualization vector. Statistical graph representation. Business analytics diagram.
Free with trial Laptop screen displays data dashboard for analytics digital dashboard presents complex data and business metrics ,Generative ai. Summary analytics illustrations Laptop screen displays data dashboard for analytics digital dashboard presents complex data and business metrics
Free with trial Illustration of a data analytics dashboard with various charts, graphs, and progress bars, representing business data and statistics. Summary analytics vectors Data visualization and analytics dashboard with charts and graphs for business. Illustration of a data analytics dashboard with various charts, graphs, and progress bars, representing business data and statistics
Free with trial Modern smartphone lies on a white marble table, displaying a detailed digital data analytics dashboard with various charts and graphs. Summary analytics illustrations Modern Smartphone Displaying Digital Data Analytics Dashboard on Marble. Modern smartphone lies on a white marble table, displaying a detailed digital data analytics dashboard with various charts and graphs
Free with trial Futuristic interface displays container flow summary and fare class restructuring over a world map with shipping routes. Summary analytics illustrations Global logistics network visualization with container shipping and data analytics. Futuristic interface displays container flow summary and fare class restructuring over a world map with shipping routes
Free with trial A laptop screen displaying a comprehensive business analytics dashboard with multiple types of charts and graphs, including bar charts, line graphs, and a pie chart, illustrating data analysis and financial reporting. Summary analytics illustrations Business Analytics Dashboard on Laptop Screen with Various Charts and Graphs. A laptop screen displaying a comprehensive business analytics dashboard with multiple types of charts and graphs, including bar charts, line graphs, and a pie chart, illustrating data analysis and financial reporting
Free with trial Business recap button highlighted on virtual dashboard for performance summary. Summary analytics illustrations Business recap button highlighted on virtual dashboard for performance summary
Free with trial The image shows a digital dashboard interface with various charts and graphs illustrating key performance indicators. The dashboard includes a bar graph for revenue trends, a line chart for user engagement, and a pie chart for expense distribution. There are also summary cards showing specific metrics like total revenue, profit, and user count. The interface appears to be designed for monitoring. Summary analytics illustrations Dashboard displaying analytics and performance metrics for business operations. The image shows a digital dashboard interface with various charts and graphs illustrating key performance indicators. The dashboard includes a bar graph for revenue trends, a line chart for user engagement, and a pie chart for expense distribution. There are also summary cards showing specific metrics like total revenue, profit, and user count. The interface appears to be designed for monitoring
Free with trial A colorful bar chart, dashboard, data visualization, analytics, modern interface, cheerful. Summary analytics illustrations Colorful bar chart, dashboard, data visualization, analytics, modern interface, cheerful
Free with trial This image shows a collection of business analytics graphs and charts on a clean white background. The charts include traffic over time, revenue by product, user distribution, and server performance. The image is a great representation of business data visualization and can be used for presentations, reports, or websites related to business, finance, and technology. Summary analytics vectors A collection of business analytics graphs and charts on a clean white background
Free with trial A comprehensive dashboard interface showcasing data visualization, charts, graphs, and key performance indicators KPIs for business analytics and reporting. Summary analytics vectors Modern Dashboard Interface Displaying Data Visualization and Business Analytics. A comprehensive dashboard interface showcasing data visualization, charts, graphs, and key performance indicators KPIs for business analytics and reporting
Free with trial A 3D render of a business summary report with a bar chart, pie chart, magnifying glass, and an upward trending arrow. Summary analytics illustrations 3D Business Summary Report with Bar Chart, Pie Chart, Magnifying Glass and Arrow finance. A 3D render of a business summary report with a bar chart, pie chart, magnifying glass, and an upward trending arrow
Free with trial An analytics dashboard sits next to a red notebook, coffee cup, and bright flowers on a table. Summary analytics illustrations Analytics dashboard printout laid next to a notebook, coffee, and flowers on a table. An analytics dashboard sits next to a red notebook, coffee cup, and bright flowers on a table
Free with trial The image shows a tablet screen with a detailed dashboard titled 'Battery Analytics'. It presents various charts and graphs, including bar graphs for usage patterns, line graphs for battery health over time, and a summary of battery status with percentage, health, and cycle count. The interface also includes a performance efficiency meter and a breakdown of usage by different applications or. Summary analytics illustrations Smart dashboard displaying battery performance analytics and efficiency metrics. The image shows a tablet screen with a detailed dashboard titled 'Battery Analytics'. It presents various charts and graphs, including bar graphs for usage patterns, line graphs for battery health over time, and a summary of battery status with percentage, health, and cycle count. The interface also includes a performance efficiency meter and a breakdown of usage by different applications or
Free with trial High-resolution close-up of a modern business analytics report featuring colorful charts, graphs, and financial performance data. Ideal for concepts such as business intelligence, KPI reporting, corporate strategy, marketing analysis, financial forecasting, startup growth, data visualization, accounting, and professional presentation design. Summary analytics illustrations Colorful Business Performance Report with Data Charts and Modern Analytics Layout. High-resolution close-up of a modern business analytics report featuring colorful charts, graphs, and financial performance data. Ideal for concepts such as business intelligence, KPI reporting, corporate strategy, marketing analysis, financial forecasting, startup growth, data visualization, accounting, and professional presentation design.
Free with trial Business infographic with a chart in contrasting red and blue on a clean white background, perfect for data analytics and presenting a graph. Summary analytics illustrations Data analytics represented by a clear business chart and graph in bold red and blue on a crisp white background, ideal for an. Business infographic with a chart in contrasting red and blue on a clean white background, perfect for data analytics and presenting a graph
Free with trial Vibrant Business Growth Chart Showing Data Trends and Analytics in Corporate Environment. Generative AI. Summary analytics illustrations Vibrant Business Growth Chart Showing Data Trends and Analytics in Corporate Environment
Free with trial High-resolution close-up of a modern analytics dashboard featuring vibrant rainbow gradient charts, KPI widgets, and circular infographic elements on a clean digital interface. Perfect for business intelligence, data visualization, marketing metrics, fintech reporting, startup performance tracking, SaaS platforms, digital strategy, UI design, and corporate technology presentations. Summary analytics illustrations Rainbow Gradient Analytics Dashboard Display with Modern Data Visualization Charts. High-resolution close-up of a modern analytics dashboard featuring vibrant rainbow gradient charts, KPI widgets, and circular infographic elements on a clean digital interface. Perfect for business intelligence, data visualization, marketing metrics, fintech reporting, startup performance tracking, SaaS platforms, digital strategy, UI design, and corporate technology presentations.
Free with trial A sleek laptop showcases intricate data visualizations, reflecting the power of technology in dissecting complex datasets. Ideal for illustrating business analytics, market trends, or financial performance in a modern, professional context. Summary analytics illustrations Sophisticated laptop display presenting complex data visualizations and analytics. A sleek laptop showcases intricate data visualizations, reflecting the power of technology in dissecting complex datasets. Ideal for illustrating business analytics, market trends, or financial performance in a modern, professional context
Free with trial Real-time customer data shown in 3D with dynamic visualization panels and interactive feedback analytics. Summary analytics illustrations 3D data interface showcasing real-time customer insights with dynamic panels and interactive analytics feedback. Real-time customer data shown in 3D with dynamic visualization panels and interactive feedback analytics
Free with trial An angled close-up of a business report or graph, illustrating financial analytics, investment trends, and economic performance metrics, offering insights for strategic planning and corporate growth. Generative AI. Summary analytics illustrations Financial analytics data graph presentation with business performance metrics chart. An angled close-up of a business report or graph, illustrating financial analytics, investment trends, and economic performance metrics, offering insights for strategic planning and corporate growth. Generative AI
Free with trial A detailed business analytics dashboard showcasing various data visualizations, including charts and graphs, for comprehensive data analysis and insights. Summary analytics vectors Business Analytics Dashboard Displaying Data Visualization and Charts for Analysis. A detailed business analytics dashboard showcasing various data visualizations, including charts and graphs, for comprehensive data analysis and insights
Free with trial A digital interface showcasing multiple panels of interconnected financial graphs and data analytics charts. Summary analytics illustrations Interactive data dashboard UI interface panels with dashboard interface analytics financial statistics. A digital interface showcasing multiple panels of interconnected financial graphs and data analytics charts
Free with trial Medical office scene featuring a wood surface on which a stethoscope and pen rest atop a patient diagnostic summary form. Digital holographic displays present vital signs (heart rate, blood pressure, oxygen saturation), lab analysis charts, and a 3D image of lungs. The background includes soft focus elements of an office setting, suggesting a modern healthcare environment, possibly indicating advanced medical technology or telemedicine. Summary analytics illustrations Digital Health Monitoring Dashboard with Patient Diagnostic Summary and Stethoscope. Medical office scene featuring a wood surface on which a stethoscope and pen rest atop a patient diagnostic summary form. Digital holographic displays present vital signs (heart rate, blood pressure, oxygen saturation), lab analysis charts, and a 3D image of lungs. The background includes soft focus elements of an office setting, suggesting a modern healthcare environment, possibly indicating advanced medical technology or telemedicine.
Free with trial Business report data analytics bar chart document infographic growth finance orange black, Generative AI. Summary analytics illustrations Business report data analytics bar chart document infographic growth finance orange black
Free with trial This aerial view showcases a vibrant data analytics dashboard, meticulously crafted for businesses operating in the dynamic realm of finance and business. The vibrant color palette isn't just aesthetically pleasing it's designed to intuitively communicate key performance indicators (KPIs) and insightful trends. From real-time market fluctuations to detailed financial forecasts, the dashboard. Summary analytics illustrations Strategic Insights Unveiled A Colorful Data Analytics Dashboard for Business and Finance. This aerial view showcases a vibrant data analytics dashboard, meticulously crafted for businesses operating in the dynamic realm of finance and business. The vibrant color palette isn't just aesthetically pleasing it's designed to intuitively communicate key performance indicators (KPIs) and insightful trends. From real-time market fluctuations to detailed financial forecasts, the dashboard