Free with trial Uptrend trend definition flat icon - bullish chart pattern figure technical analysis. Vector stock and cryptocurrency exchange graph, forex analytics, trading market price. Technical analysis pattern vectors Uptrend trend definition flat icon - bullish chart pattern figure technical analysis. Vector stock and exchange graph. Uptrend trend definition flat icon - bullish chart pattern figure technical analysis. Vector stock and cryptocurrency exchange graph, forex analytics, trading market price
Free with trial Financial candlestick chart on a dark background technical analysis chart pattern. The graphic displays a bullish breakout point from a symmetrical triangle formation. Technical analysis pattern vectors Financial candlestick chart on dark background technical analysis chart pattern. The graphic displays a bullish breakout point. Financial candlestick chart on a. Financial candlestick chart on a dark background technical analysis chart pattern. The graphic displays a bullish breakout point from a symmetrical triangle formation
Free with trial An abstract scribble market technical analysis chart pattern. Technical analysis pattern illustrations Abstract Japanese Candlesticks. An abstract scribble market technical analysis chart pattern
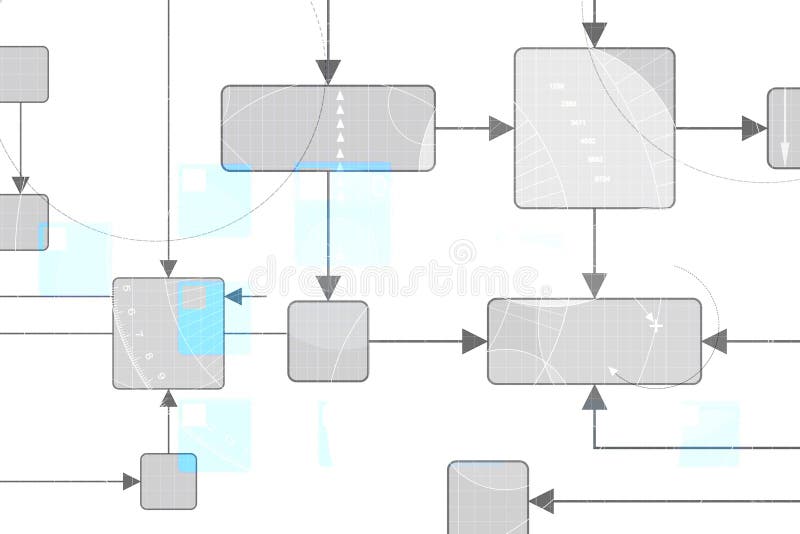
Free with trial Technical background with flow chart design in gray, white and some blue markings. Technical analysis pattern illustrations Technical Background
Free with trial Analysis under research illustration design over white. Technical analysis pattern illustrations Analysis under research
Free with trial Professional financial infographic descending channel continuation pattern. upper and lower bands, and technical analysis labels on a dark digital grid background. Technical analysis pattern illustrations Professional financial infographic descending channel continuation pattern upper and lower bands, and technical analysis labels. professional financial infographic descending channel continuation pattern. upper and lower bands, and technical analysis labels on a dark digital grid background
Free with trial The image depicts a pattern with technical explanation of the japanese candlesticks of the financial charts. Technical analysis pattern vectors Chart with technical explanation of the japanese candlesticks of financial charts. The image depicts a pattern with technical explanation of the japanese candlesticks of the financial charts
Free with trial Analysis magnify text illustration design over a white background. Technical analysis pattern illustrations Analysis magnify text illustration design
Free with trial Math vector seamless pattern with handwritten multicolored formulas, calculations, equations. You can use any color of background. Technical analysis pattern vectors Math vector seamless pattern with handwritten multicolored formulas, calculations, equations
Free with trial Technical stock chart analysis before buy entry decision, investor reviewing bullish candlestick pattern and upward trend arrow on laptop for strategic trading. Technical analysis pattern illustrations Technical stock chart analysis before buy entry decision, investor reviewing bullish candlestick pattern
Free with trial Abstract polygonal background with connected lines and dots. Minimalistic geometric pattern. Molecule structure and communication. Graphic plexus background. Science, medicine, technology concept. Technical analysis pattern vectors Abstract polygonal background with connected lines and dots. Minimalistic geometric pattern. Molecule structure and
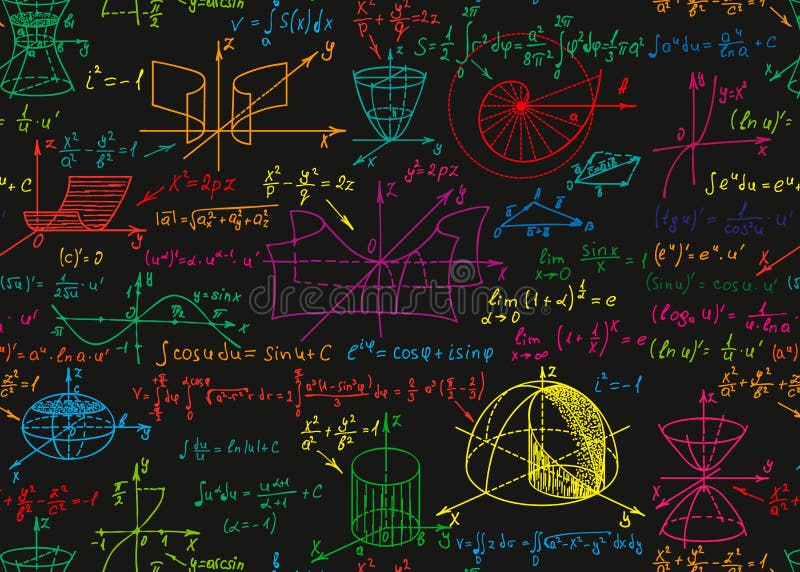
Free with trial Mathematical vector seamless pattern with handwritten math formulas, calculations, equations. You can use any color of background. Technical analysis pattern vectors Mathematical vector seamless pattern with handwritten math formulas, calculations, equations
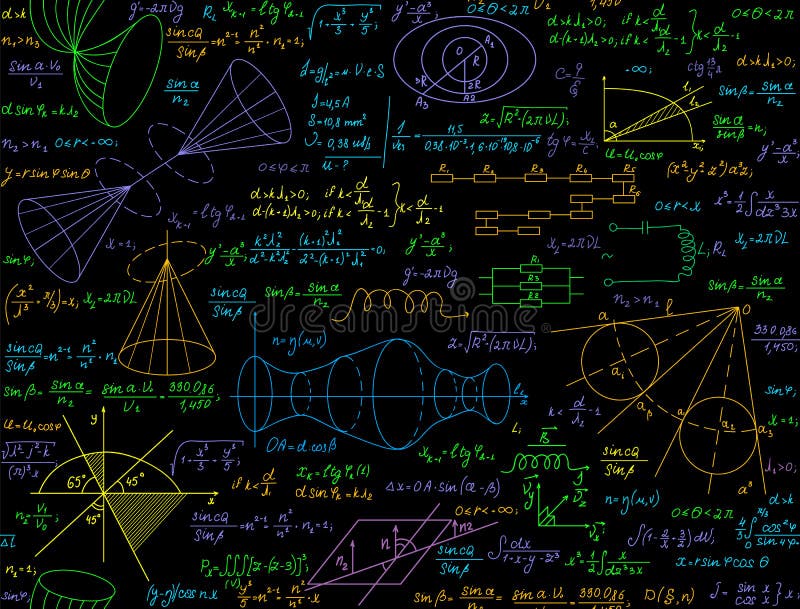
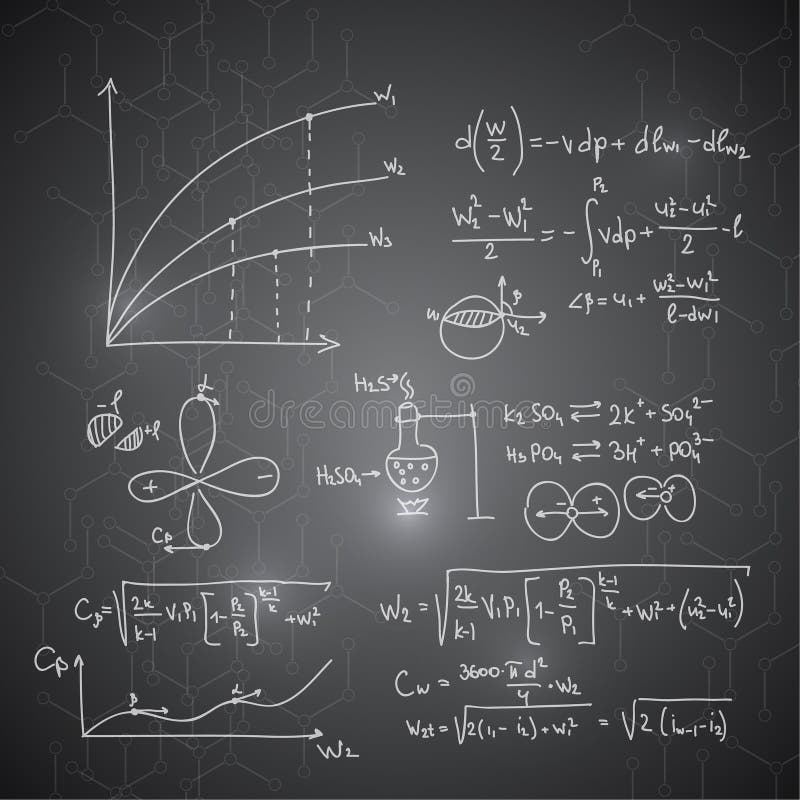
Free with trial Math science vector seamless pattern with handwritten formulas on the black chalkboard for the background. Technical analysis pattern vectors Math science vector seamless pattern with handwritten formulas on the black chalkboard for the background.
Free with trial Technical stock chart analysis before buy entry decision, investor reviewing bullish candlestick pattern and upward trend arrow on laptop for strategic trading. Technical analysis pattern illustrations Technical stock chart analysis before buy entry decision, investor reviewing bullish candlestick pattern
Free with trial Illustration of an ECG or EKG trace. Technical analysis pattern illustrations Red ECG Trace. Illustration of an ECG or EKG trace.
Free with trial Six colorful science icons isolated on a black background. Technical analysis pattern vectors Colorful science icons
Free with trial Vector illustration of medical background with life line. Technical analysis pattern vectors Medical Background
Free with trial CAD - Computer Aided Design word cloud, business concept background. Technical analysis pattern illustrations CAD - Computer Aided Design word cloud
Free with trial Vector illustration of life line coming out of computer screen. Technical analysis pattern vectors Vector Life Line from Computer Screen. Vector illustration of life line coming out of computer screen
Free with trial Abstract molecules medical background. illustration. Technical analysis pattern vectors Medical background
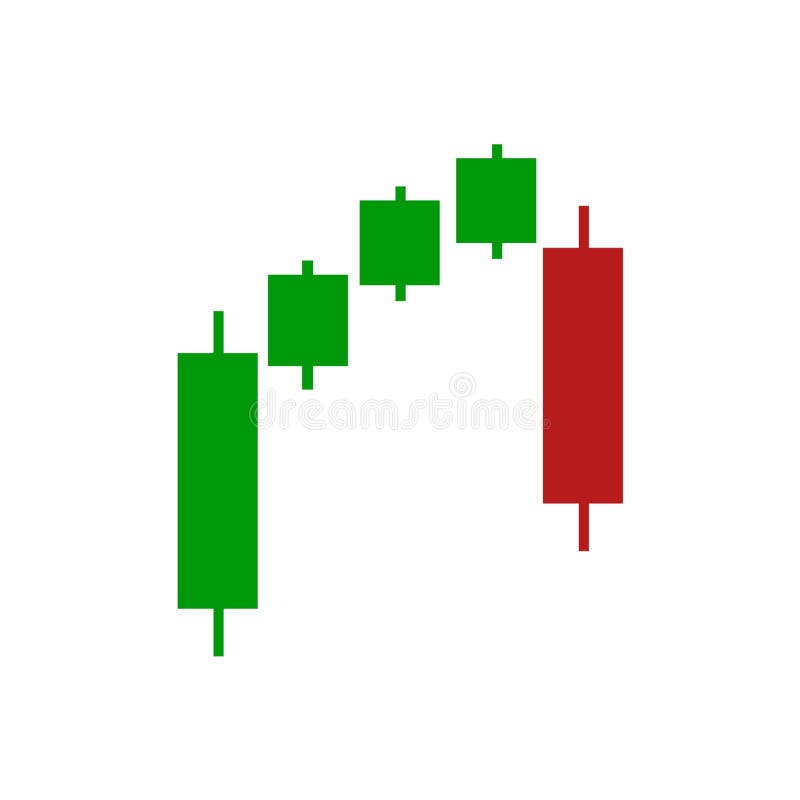
Free with trial Minimal monochrome candlestick pattern arranged diagonally on white background, suitable for trading analysis, finance education, and technical chart concepts. Technical analysis pattern illustrations Minimal monochrome candlestick pattern arranged diagonally on white background, suitable for trading analysis, finance education
Free with trial Candlestick graph chart with digital data, uptrend or down trend of price of stock market or stock exchange trading, investment and financial concept. Technical analysis pattern illustrations Candlestick graph chart with digital data, uptrend or down trend of price of stock market or stock exchange trading, investment
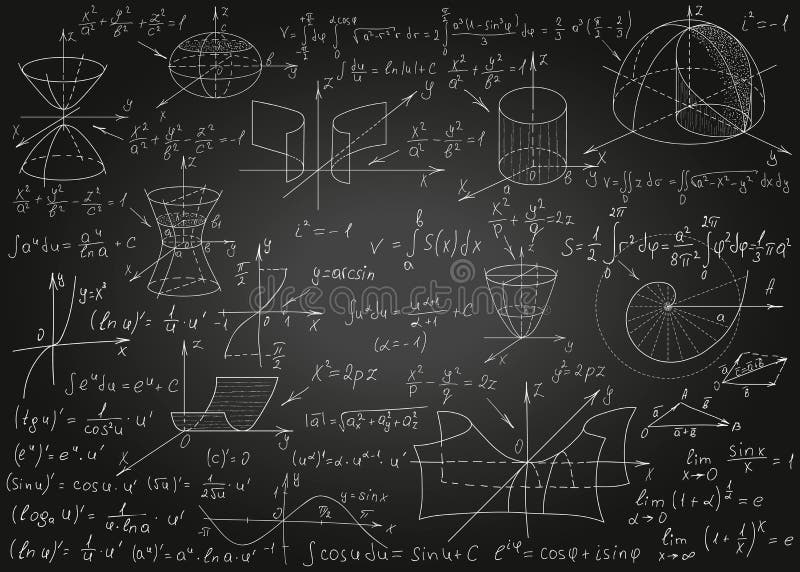
Free with trial Abstract Background with geometric figure, points and lines, mathematical formulas, calculations, graphs, proof, molecule structure and scientific research. genetic and chemical compounds. Surface for chalk boards. Technical analysis pattern vectors Abstract Blurred Background. Abstract Background with geometric figure, points and lines, mathematical formulas, calculations, graphs, proof, molecule structure and scientific research. genetic and chemical compounds. Surface for chalk boards
Free with trial Wave of red particles. Abstract fire background with a dynamic wave. 3d rendering. Technical analysis pattern illustrations Wave of red particles. Abstract fire background with a dynamic wave. 3d rendering
Free with trial A computer monitor displays a PSF starburst pattern alongside visual quality analysis panels. The teal-framed interface shows a multicolor contour plot (red to blue), a simulated starburst image, and two green line charts, creating a technical analytical mood. Technical analysis pattern illustrations Optical PSF Starburst Pattern Display. A computer monitor displays a PSF starburst pattern alongside visual quality analysis panels. The teal-framed interface shows a multicolor contour plot (red to blue), a simulated starburst image, and two green line charts, creating a technical analytical mood.
Free with trial Scientific molecule background for medicine, science, technology, chemistry. Wallpaper or banner with a DNA molecules. Vector geometric dynamic illustration. Technical analysis pattern vectors Scientific molecule background for medicine, science, technology, chemistry. Wallpaper or banner with a DNA molecules
Free with trial Stock market or forex trading business graph chart for financial investment concept. Business presentation for your design and text. Economy trends, business idea and technology innovation design. Technical analysis pattern vectors Stock market or forex trading business graph chart for financial investment concept. Business presentation for your
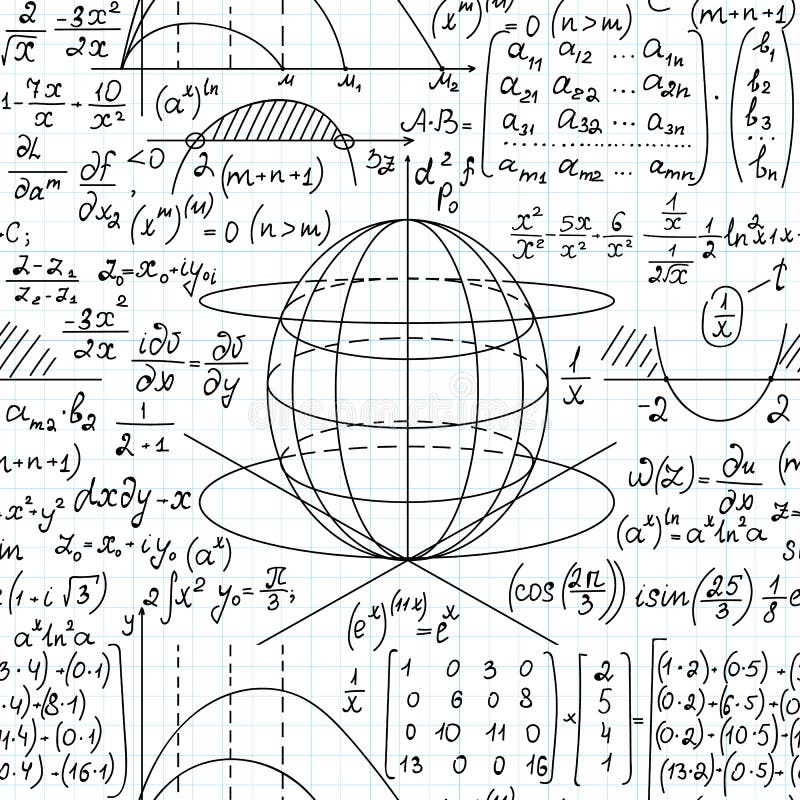
Free with trial Math scientific vector seamless background with mathematical formulas, plots and equations handwritten on grid copybook paper. Technical analysis pattern vectors Math scientific vector seamless background with mathematical formulas, plots and equations
Free with trial Trading candlestick pattern. For stock, crypto, forex investment trading analysis. Vector illustration. Technical analysis pattern vectors Trading candlestick pattern. For stock, crypto, forex investment trading analysis. Vector illustration
Free with trial Abstract background with DNA strand molecule structure. genetic and chemical compounds. Blurry gradient background. Technical analysis pattern vectors Abstract Blurred Background. Abstract background with DNA strand molecule structure. genetic and chemical compounds. Blurry gradient background.
Free with trial Abstract molecules medical background. illustration. Technical analysis pattern vectors Medical background
Free with trial Abstract Background with mathematical formulas, calculations, graphs, proof, DNA molecule structure and scientific research. genetic and chemical compounds. Surface for chalk boards. Technical analysis pattern vectors Abstract Blurred Background. Abstract Background with mathematical formulas, calculations, graphs, proof, DNA molecule structure and scientific research. genetic and chemical compounds. Surface for chalk boards
Free with trial Trading candlestick pattern. For stock, crypto, forex investment trading analysis. Vector illustration. Technical analysis pattern vectors Trading candlestick pattern. For stock, crypto, forex investment trading analysis. Vector illustration
Free with trial Abstract Background with mathematical formulas, calculations, graphs, proof, DNA molecule structure and scientific research.. genetic and chemical compounds. Technical analysis pattern vectors Abstract Blurred Background. Abstract Background with mathematical formulas, calculations, graphs, proof, DNA molecule structure and scientific research.. genetic and chemical compounds
Free with trial Stock market or forex trading business graph chart for financial investment concept. Business presentation for your design and text. Economy trends, business idea and technology innovation design. Technical analysis pattern vectors Stock market or forex trading business graph chart for financial investment concept. Business presentation for your
Free with trial Structure molecule and communication. Dna, atom, neurons. Scientific molecule background for medicine, science technology chemistry. Vector illustration. Technical analysis pattern vectors Structure molecule and communication. Dna, atom, neurons. Scientific molecule background for medicine, science
Free with trial Trading candlestick pattern. For stock, crypto, forex investment trading analysis. Vector illustration. Technical analysis pattern vectors Trading candlestick pattern. For stock, crypto, forex investment trading analysis. Vector illustration
Free with trial Business candle stick graph chart of stock market investment trading on blue background design. Vector illustration. Technical analysis pattern vectors Business candle stick graph chart of stock market investment trading on blue background design. Trend of graph. Vector. Business candle stick graph chart of stock market investment trading on blue background design. Vector illustration
Free with trial Mathematical formulas drawn by hand on a black chalkboard for the background. Vector illustration. Technical analysis pattern vectors Mathematical formulas drawn by hand on a black chalkboard for the background. Vector illustration.
Free with trial Business candle stick graph chart of stock market investment trading on blue background design. Trend of graph. Vector illustration. Technical analysis pattern vectors Business candle stick graph chart of stock market investment trading on blue background design. Trend of graph. Vector
Free with trial Trading candlestick pattern. For stock, crypto, forex investment trading analysis. Vector illustration. Technical analysis pattern vectors Trading candlestick pattern. For stock, crypto, forex investment trading analysis. Vector illustration
Free with trial Financial graph with up trend line candlestick chart in stock market. Technical analysis pattern. Technical analysis pattern illustrations Financial graph with up trend line candlestick chart in stock market . Technical analysis pattern
Free with trial Financial graph with up trend line candlestick chart in stock market. Technical analysis pattern. Technical analysis pattern illustrations Financial graph with up trend line candlestick chart in stock market . Technical analysis pattern
Free with trial ATR Average True Range acronym text on board. Hand with marker writes volatility indicator. Technical analysis tool used to measure market volatility by decomposing the entire range. Technical analysis pattern illustrations ATR Average True Range acronym text on board. Hand with marker writes volatility indicator. Technical analysis tool used to
Free with trial Financial graph with up trend line candlestick chart in stock market. Technical analysis pattern. Technical analysis pattern illustrations Financial graph with up trend line candlestick chart in stock market . Technical analysis pattern
Free with trial Financial graph with up trend line candlestick chart in stock market. Technical analysis pattern. Technical analysis pattern illustrations Financial graph with up trend line candlestick chart in stock market . Technical analysis pattern
Free with trial Financial graph with up trend line candlestick chart in stock market. Technical analysis pattern. Technical analysis pattern illustrations Financial graph with up trend line candlestick chart in stock market . Technical analysis pattern
Free with trial Radar circle Vector. Dash line pattern. Abstract technical graph. Minimalist sonar display. Manual vector only. No autotrace used. EPS 10. Technical analysis pattern vectors Radar circle Vector. Dash line pattern. Abstract technical graph. Minimalist sonar display. Manual vector only. No autotrace used.
Free with trial Financial graph with up trend line candlestick chart in stock market. Technical analysis pattern. Technical analysis pattern illustrations Financial graph with up trend line candlestick chart in stock market . Technical analysis pattern
Free with trial Financial graph with up trend line candlestick chart in stock market. Technical analysis pattern. Technical analysis pattern illustrations Financial graph with up trend line candlestick chart in stock market . Technical analysis pattern
Free with trial Financial graph with up trend line candlestick chart in stock market. Technical analysis pattern. Technical analysis pattern illustrations Financial graph with up trend line candlestick chart in stock market . Technical analysis pattern
Free with trial Anomaly Detection Word Cloud. A technical visual summary of outlier analysis, statistical baselines, machine learning models, and behavioral monitoring for IT security and compliance. Technical analysis pattern illustrations Anomaly Detection Word Cloud. A technical visual summary of outlier analysis, statistical baselines, machine learning models, and
Free with trial Financial graph with up trend line candlestick chart in stock market. Technical analysis pattern. Technical analysis pattern illustrations Financial graph with up trend line candlestick chart in stock market . Technical analysis pattern
Free with trial Financial graph with up trend line candlestick chart in stock market. Technical analysis pattern. Technical analysis pattern illustrations Financial graph with up trend line candlestick chart in stock market . Technical analysis pattern
Free with trial Financial graph with up trend line candlestick chart in stock market. Technical analysis pattern. Technical analysis pattern illustrations Financial graph with up trend line candlestick chart in stock market . Technical analysis pattern
Free with trial Financial graph with up trend line candlestick chart in stock market. Technical analysis pattern. Technical analysis pattern illustrations Financial graph with up trend line candlestick chart in stock market . Technical analysis pattern
Free with trial Financial graph with up trend line candlestick chart in stock market. Technical analysis pattern. Technical analysis pattern illustrations Financial graph with up trend line candlestick chart in stock market . Technical analysis pattern
Free with trial Financial graph with up trend line candlestick chart in stock market. Technical analysis pattern. Technical analysis pattern illustrations Financial graph with up trend line candlestick chart in stock market . Technical analysis pattern
Free with trial Financial graph with up trend line candlestick chart in stock market. Technical analysis pattern. Technical analysis pattern illustrations Financial graph with up trend line candlestick chart in stock market . Technical analysis pattern
Free with trial Financial graph with up trend line candlestick chart in stock market. Technical analysis pattern. Technical analysis pattern illustrations Financial graph with up trend line candlestick chart in stock market . Technical analysis pattern
Free with trial Financial graph with up trend line candlestick chart in stock market. Technical analysis pattern. Technical analysis pattern illustrations Financial graph with up trend line candlestick chart in stock market . Technical analysis pattern
Free with trial Financial graph with up trend line candlestick chart in stock market. Technical analysis pattern. Technical analysis pattern illustrations Financial graph with up trend line candlestick chart in stock market . Technical analysis pattern
Free with trial Financial graph with up trend line candlestick chart in stock market. Technical analysis pattern. Technical analysis pattern illustrations Financial graph with up trend line candlestick chart in stock market . Technical analysis pattern
Free with trial Financial graph with up trend line candlestick chart in stock market. Technical analysis pattern. Technical analysis pattern illustrations Financial graph with up trend line candlestick chart in stock market . Technical analysis pattern
Free with trial A detailed illustration of a candle stick chart pattern, showcasing a series of green and red candles against a white background. The chart is used for technical analysis in finance and trading, providing insights into market trends and price movements. Technical analysis pattern vectors Candle Stick Chart Pattern
Free with trial Financial graph with up trend line candlestick chart in stock market. Technical analysis pattern. Technical analysis pattern illustrations Financial graph with up trend line candlestick chart in stock market . Technical analysis pattern
Free with trial Financial graph with up trend line candlestick chart in stock market. Technical analysis pattern. Technical analysis pattern illustrations Financial graph with up trend line candlestick chart in stock market . Technical analysis pattern
Free with trial Financial graph with up trend line candlestick chart in stock market. Technical analysis pattern. Technical analysis pattern illustrations Financial graph with up trend line candlestick chart in stock market . Technical analysis pattern
Free with trial This image is created by Artificial Intelligence. A sound wave pattern displayed on a screen in a dark anechoic chamber with acoustic foam on the walls. The waveform is white on a black background with grid lines. The mood is technical and professional. The image can be used for audio engineering or sound analysis. The atmosphere is calm and focused. Technical analysis pattern illustrations Sound wave pattern on screen in anechoic chamber with acoustic foam. This image is created by Artificial Intelligence. A sound wave pattern displayed on a screen in a dark anechoic chamber with acoustic foam on the walls. The waveform is white on a black background with grid lines. The mood is technical and professional. The image can be used for audio engineering or sound analysis. The atmosphere is calm and focused
Free with trial Financial graph with up trend line candlestick chart in stock market. Technical analysis pattern. Technical analysis pattern illustrations Financial graph with up trend line candlestick chart in stock market . Technical analysis pattern
Free with trial Financial graph with up trend line candlestick chart in stock market. Technical analysis pattern. Technical analysis pattern illustrations Financial graph with up trend line candlestick chart in stock market . Technical analysis pattern
Free with trial Financial graph with up trend line candlestick chart in stock market. Technical analysis pattern. Technical analysis pattern illustrations Financial graph with up trend line candlestick chart in stock market . Technical analysis pattern
Free with trial Stock market candlestick chart on digital screen with blue backlight, technical analysis, trading volatility, price dynamics. Technical analysis pattern illustrations Stock market candlestick chart on digital screen with blue backlight, technical analysis, trading volatility, price dynamics
Free with trial Financial graph with up trend line candlestick chart in stock market. Technical analysis pattern. Technical analysis pattern illustrations Financial graph with up trend line candlestick chart in stock market . Technical analysis pattern
Free with trial Financial graph with up trend line candlestick chart in stock market. Technical analysis pattern. Technical analysis pattern illustrations Financial graph with up trend line candlestick chart in stock market . Technical analysis pattern
Free with trial Financial graph with up trend line candlestick chart in stock market. Technical analysis pattern. Technical analysis pattern illustrations Financial graph with up trend line candlestick chart in stock market . Technical analysis pattern