Free with trial Business marketing infographic template. Vector illustration. Can be used for workflow layout, banner, diagram, number options, web design, timeline elements. Timeline dots vectors Business marketing infographic template.
Free with trial Business timeline info graphic template. Vector illustration. Can be used for workflow layout, banner, diagram, number options, web design. Timeline dots vectors Business timeline info graphic template. Vector illustration.
Free with trial Abstract, 6 point timeline infographic vector made of colorful dots in a horizontal wave in the centre of the page with space for text on a subtle gradient background made in illustrator. Timeline dots vectors Abstract 6 Point Colorful Flat Horizontal Timeline. Abstract, 6 point timeline infographic vector made of colorful dots in a horizontal wave in the centre of the page with space for text on a subtle gradient background made in illustrator.
Free with trial Infograph 6 steps element, diagram process with centre circle. Graphic chart diagram, business timeline graphic design in rainbow color with icons, dots world map. Copy space. Vector illustration. Timeline dots vectors Infograph 6 steps element, diagram process with centre circle. Graphic chart diagram, business timeline graphic design
Free with trial Business marketing infographic template. Vector illustration. Can be used for workflow layout, banner, diagram, number options, web design, timeline elements. Timeline dots vectors Business marketing infographic template.
Free with trial Business timeline info graphic template. Vector illustration. Can be used for workflow layout, banner, diagram, number options, web design. Timeline dots vectors Business timeline info graphic template. Vector illustration.
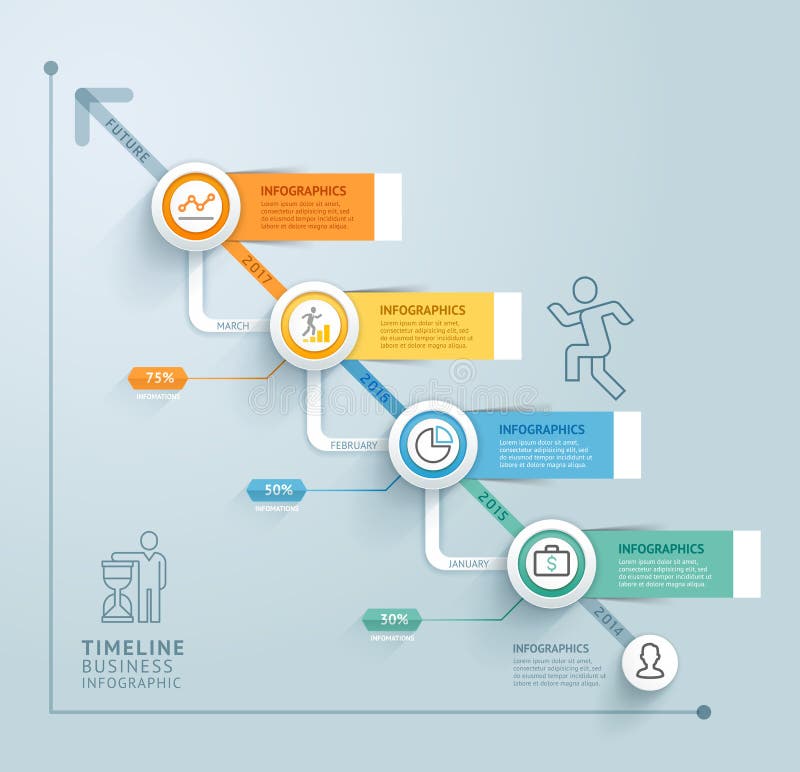
Free with trial Business timeline infographic template. Vector illustration. Can be used for workflow layout, banner, diagram, number options, web design. Timeline dots vectors Business timeline infographic template.
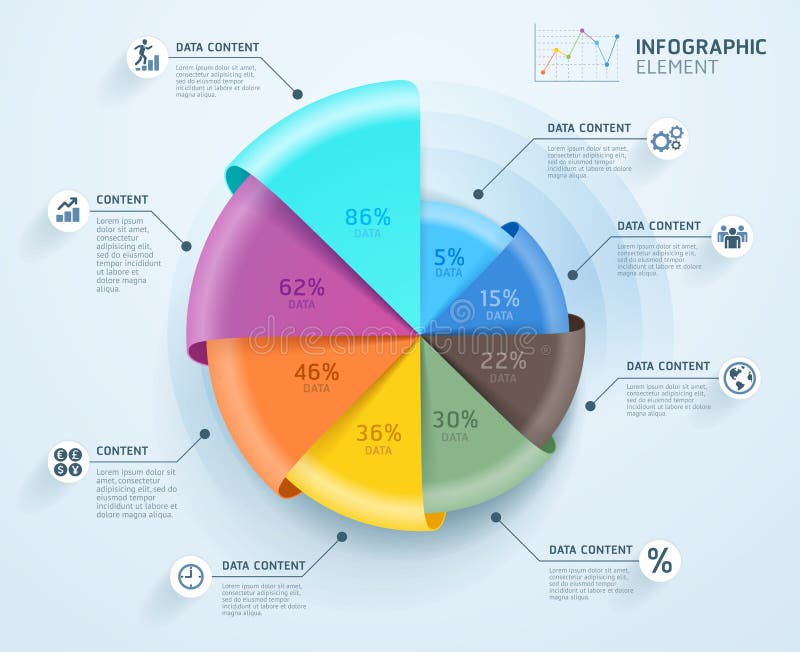
Free with trial Business infographics elements template. Vector illustrations. Can be used for workflow layout, banner, diagram, number options, web design, timeline template. Timeline dots vectors Business infographics elements template.
Free with trial Business Infographics design template. Vector illustration. Can be used for workflow layout, diagram, number options, start-up options, web design. Timeline dots vectors Business Infographics design template.
Free with trial Business Infographics design template. Vector illustration. Can be used for workflow layout, diagram, number options, start-up options, web designs. Timeline dots vectors Business Infographics design template. Vector illustrations. Business Infographics design template. Vector illustration. Can be used for workflow layout, diagram, number options, start-up options, web designs.
Free with trial Business infographics design template. Vector illustration. Can be used for workflow layout, diagram, number options, start-up options, web design. Timeline dots vectors Business infographics design template. Vector illustration. Can be used for workflow layout, diagram, number options, start-up
Free with trial Manga set storyboard layout template for rapidly create the comic book style. A4 design of paper ratio is fit for print out. Vector isolated frame handmade sketch style. Timeline dots vectors Manga set storyboard layout template for rapidly create the comic book style. A4 design of paper ratio is fit for print out
Free with trial Business infographics design template. Vector illustration. Can be used for workflow layout, diagram, number options, start-up options, web design. Timeline dots vectors Business infographics design template. Vector illustration. Can be used for workflow layout, diagram, number options, start-up
Free with trial Everything's Connected and Joined to the Cloud - Blue Cloud Computing and Network Connections Concept Design with Connected Icons Representing Various Cloud Services - Illustration in Editable Vector Format. Timeline dots vectors Cloud Computing and Networks. Everything's Connected and Joined to the Cloud - Blue Cloud Computing and Network Connections Concept Design with Connected Icons Representing Various Cloud Services - Illustration in Editable Vector Format
Free with trial Abstract, 3 point timeline infographic vector made of colorful dots in a horizontal wave in the centre of the page with space for text on a subtle gradient background made in illustrator. Timeline dots vectors Abstract 3 Point Colorful Flat Horizontal Timeline. Abstract, 3 point timeline infographic vector made of colorful dots in a horizontal wave in the centre of the page with space for text on a subtle gradient background made in illustrator.
Free with trial Abstract, 5 point timeline infographic vector made of colorful dots in a horizontal wave in the centre of the page with space for text on a subtle gradient background made in illustrator. Timeline dots vectors Abstract 5 Point Colorful Flat Horizontal Timeline. Abstract, 5 point timeline infographic vector made of colorful dots in a horizontal wave in the centre of the page with space for text on a subtle gradient background made in illustrator.
Free with trial Set of 8 assorted Halloween theme Facebook timeline covers isolated on a white background. These have been sized to fit your page seamlessly & can be easily customized by adding your own text. Timeline dots illustrations Set of 8 Halloween Theme Facebook Timeline Covers Isolated on White. Set of 8 assorted Halloween theme Facebook timeline covers isolated on a white background. These have been sized to fit your page seamlessly & can be easily customized by adding your own text.
Free with trial Business timeline infographic template. Vector illustration. Can be used for workflow layout, banner, diagram, number options, web design. Timeline dots vectors Business timeline infographic template.
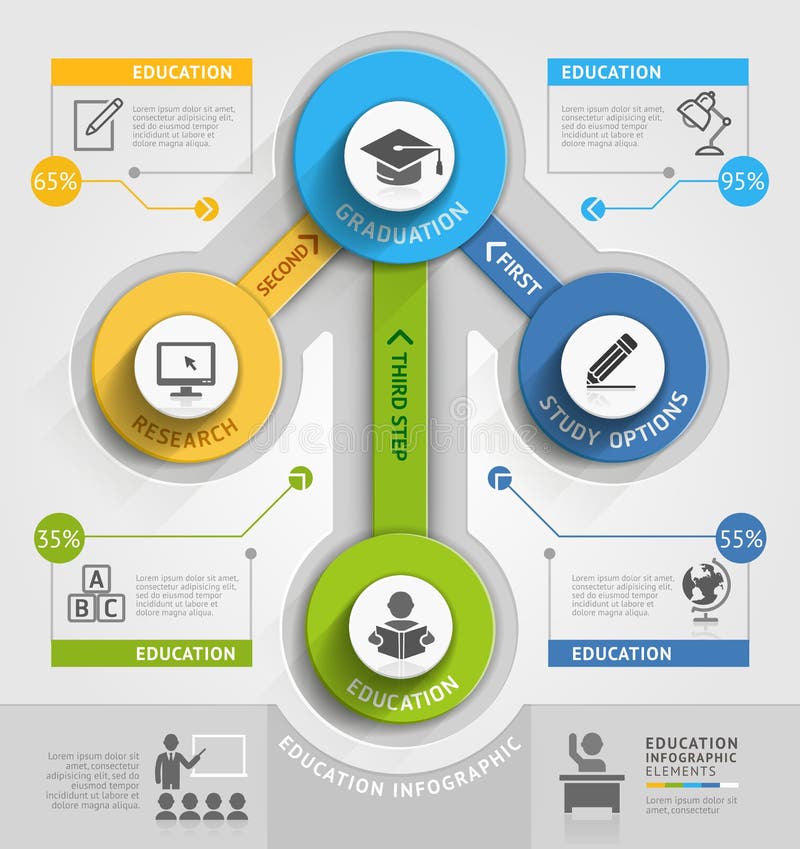
Free with trial Education timeline infographic template. Vector illustration. Can be used for workflow layout, banner, diagram, number options, web design. Timeline dots vectors Education timeline infographic template.
Free with trial Business timeline infographic template. Vector illustration. Can be used for workflow layout, banner, diagram, number options, web design. Timeline dots vectors Business timeline infographic template.
Free with trial Abstract, 4 step timeline infographic made of blue circles in a wave down the centre the page with empty text boxes on a subtle gradient background made in illustrator. Timeline dots vectors Abstract Blue Flat 4 Step Circles Vertical Timeline. Abstract, 4 step timeline infographic made of blue circles in a wave down the centre the page with empty text boxes on a subtle gradient background made in illustrator.
Free with trial Abstract, 4 step timeline infographic made of colorful circles in a wave down the centre the page with empty text boxes on a subtle gradient background made in illustrator. Timeline dots vectors Abstract Colorful Flat 4 Step Circles Vertical Timeline. Abstract, 4 step timeline infographic made of colorful circles in a wave down the centre the page with empty text boxes on a subtle gradient background made in illustrator.
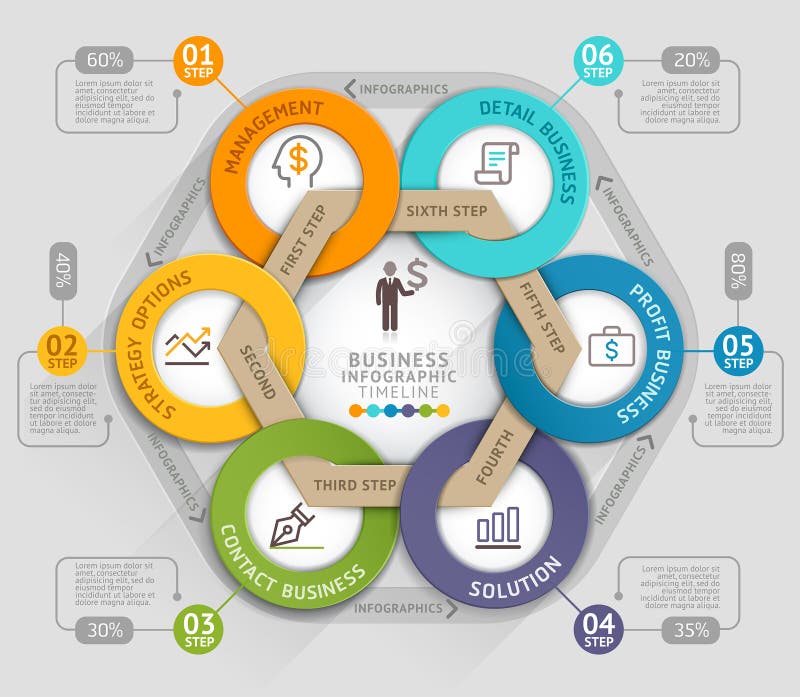
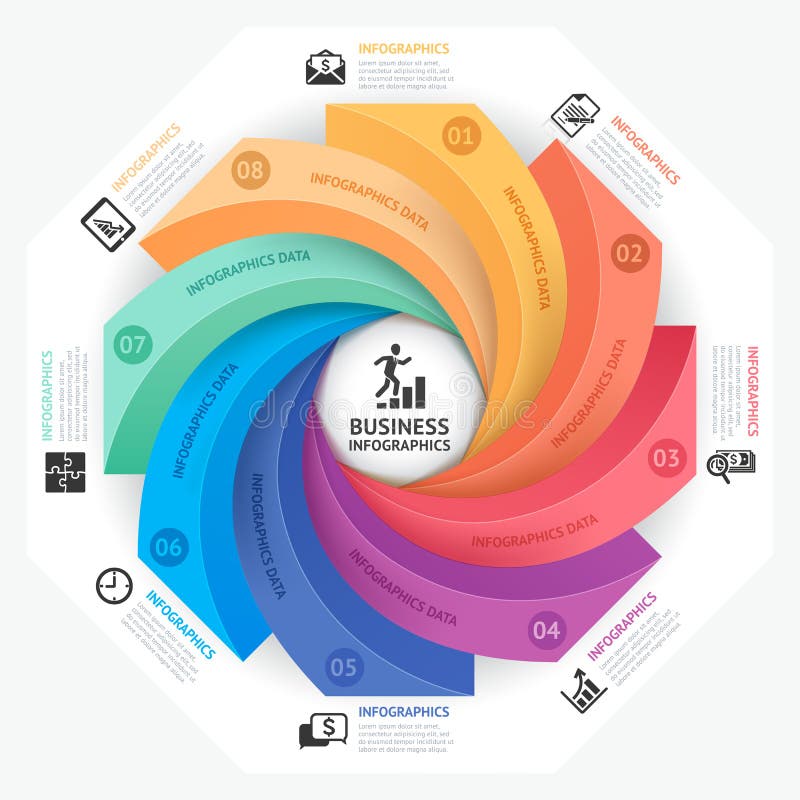
Free with trial Polygon timeline infographics design template with icons. vector illustration. Timeline dots vectors Polygon timeline infographics design template with icons
Free with trial Infograph 6 steps element, diagram process with centre circle. Graphic chart diagram, business timeline graphic design in rainbow color with icons, dots world map. Copy space. Vector illustration. Timeline dots vectors Infograph 6 steps element, diagram process with centre circle. Graphic chart diagram, business timeline graphic design
Free with trial Minimalistic timeline infographics design template. Vector illustration. Timeline dots vectors Minimalistic timeline infographics design template
Free with trial Business timeline infographic template can be used for workflow layout, diagram, number options,. Timeline dots vectors Business timeline infographic template
Free with trial Full year timeline template with all months on a horizontal time line as a circle droplets on dots timeline. Vivid color pointers on dotted time line infographic template. Timeline dots vectors Infographic full year timeline template made from color droplet pointers. Full year timeline template with all months on a horizontal time line as a circle droplets on dots timeline. Vivid color pointers on dotted time line infographic template
Free with trial Business infographics elements template. Vector illustrations. Can be used for workflow layout, banner, diagram, number options, web design, timeline template. Timeline dots vectors Business infographics elements template.
Free with trial Simplistic modern resume cv curriculum vitae template design with dots. Timeline dots vectors Simplistic resume cv template with dots. Simplistic modern resume cv curriculum vitae template design with dots
Free with trial Abstract 3d world map infographic 5 options, Business concept infographic template can be used for workflow layout, diagram, number options, timeline or milestones project. Timeline dots vectors Abstract 3d world map infographic 5 options
Free with trial Modern resume cv curriculum vitae design with colored dots. Timeline dots vectors Modern resume cv design with colored dots. Modern resume cv curriculum vitae design with colored dots
Free with trial Infographic design elements vector collection, diagram objects and visualizations. Timeline presentation templates, circular statistics graph charts, data structure layouts and hierarchy flow systems. Timeline dots vectors Infographic design elements vector collection, diagram structure objects and visualizations. Infographic design elements vector collection, diagram objects and visualizations. Timeline presentation templates, circular statistics graph charts, data structure layouts and hierarchy flow systems.
Free with trial Business marketing infographic template. Vector illustration. Can be used for workflow layout, banner, diagram, number options, web design, timeline elements. Timeline dots vectors Business marketing infographic template.
Free with trial Infographic design elements vector collection, diagram objects and visualizations. Timeline presentation templates, circular statistics graph charts, data structure layouts and hierarchy flow systems. Timeline dots vectors Infographic design elements vector collection, diagram structure objects and visualizations. Infographic design elements vector collection, diagram objects and visualizations. Timeline presentation templates, circular statistics graph charts, data structure layouts and hierarchy flow systems.
Free with trial Abstract 3d lightblub infographic 5 options, Business concept infographic template can be used for workflow layout, diagram, number options, timeline or milestones project. Timeline dots vectors Abstract 3d lightblub infographic 5 options, Business concept infographic
Free with trial Modern colorful 8 steps timeline infographics in jigsaw shape. Eight steps business infographic diagram with outline icons in rounded puzzle shape embossed to background with inner 3D circle. Timeline dots vectors Modern colorful 8 steps timeline infographics in jigsaw shape. E
Free with trial Set of black vector slide templates with gradient purple circles and photos, for annual report and presentation of web slides for marketing. Infographic timeline elements concept design. Timeline dots vectors Set of black vector slide templates with gradient purple circles and photos, for annual report and presentation of web slides for
Free with trial Business Infographics design template. Vector illustration. Can be used for workflow layout, diagram, number options, start-up options, web design. Timeline dots vectors Business Infographics design template.
Free with trial Business Infographics design template. Vector illustration. Can be used for workflow layout, diagram, number options, start-up options, web design. Timeline dots vectors Business Infographics design template.
Free with trial Economic structure of networks with icons, web design, mobile. Timeline dots vectors Economic structure of networks with icons
Free with trial Business Infographics design template. Vector illustration. Can be used for workflow layout, diagram, number options, start-up options, web design. Timeline dots vectors Business Infographics design template.
Free with trial Business Infographics design template. Vector illustration. Can be used for workflow layout, diagram, number options, start-up options, web design. Timeline dots vectors Business Infographics design template.
Free with trial Business Infographics design template. Vector illustration. Can be used for workflow layout, diagram, number options, start-up options, web designs. Timeline dots vectors Business Infographics design template. Vector illustration.
Free with trial World map globe template made from dots for your infographics reports - dark version. Timeline dots vectors World globe template for your infographics reports. World map globe template made from dots for your infographics reports - dark version
Free with trial Business Infographics design template. Vector illustration. Can be used for workflow layout, diagram, number options, start-up options, web design. Timeline dots vectors Business Infographics design template.
Free with trial Business infographics design template. Vector illustration. Can be used for workflow layout, diagram, number options, start-up options, web design. Timeline dots vectors Business infographics design template.
Free with trial Business infographics design template. Vector illustration. Can be used for workflow layout, diagram, number options, start-up options, web design. Timeline dots vectors Business infographics design template. Vector illustration. Can
Free with trial Business Infographics design template. Vector illustration. Can be used for workflow layout, diagram, number options, start-up options, web design. Timeline dots vectors Business Infographics design template.
Free with trial Business Infographics design template. Vector illustration. Can be used for workflow layout, diagram, web designs. Timeline dots vectors Business Infographics design template. Vector illustration. Can be used for workflow layout, diagram, web designs
Free with trial Business Infographics design template. Vector illustration. Can be used for workflow layout, diagram, number options, start-up options, web designs. Timeline dots vectors Business Infographics design template. Vector illustration.
Free with trial Business Infographics design template. Vector illustration. Can be used for workflow layout, diagram, web designs. Timeline dots vectors Business Infographics design template. Vector illustration. Can be used for workflow layout, diagram, web design
Free with trial Business infographics design template. Vector illustration. Can be used for workflow layout, diagram, number options, start-up options, web design. Timeline dots vectors Business infographics design template. Vector illustration.
Free with trial Business infographics design template. Vector illustration. Can be used for workflow layout, diagram, number options, start-up options, web design. Timeline dots vectors Business infographics design template. Vector illustration. Can be used for workflow layout, diagram, number options, start-up
Free with trial Bullet points numbers 1 to 12 list markers for infographic, process, sequential processes, timeline, annual highlights, progress. Timeline dots vectors Bullet points numbers 1 to 12 list markers for infographic, process, sequential
Free with trial Big set of business vector flat design infographics elements. graphs, bars, dots, charts, pie, diagrams, timeline, people icons, gadgets and pictograms. Timeline dots vectors Big set of business flat design infographics. Big set of business vector flat design infographics elements. graphs, bars, dots, charts, pie, diagrams, timeline, people icons, gadgets and pictograms
Free with trial Comic book templates for drawing Speech bubble balloon. Comics blank layout template background. Timeline dots vectors Comic book templates for drawing
Free with trial Modern infographic design template. Can be used for workflow layout, diagram, banner, chart, number options, web design. Vector illustration. Timeline dots vectors Modern infographic design template. Can be used
Free with trial Abstract 3D Modern template infographics. education and business concept design,can used for banner,infographic,data,presentation business,chart,sign,brochure,leaflet ,web. Vector illustration. Timeline dots vectors Banner info 1. Abstract 3D Modern template infographics.education and business concept design,can used for banner,infographic,data,presentation business,chart,sign,brochure,leaflet ,web.Vector illustration.
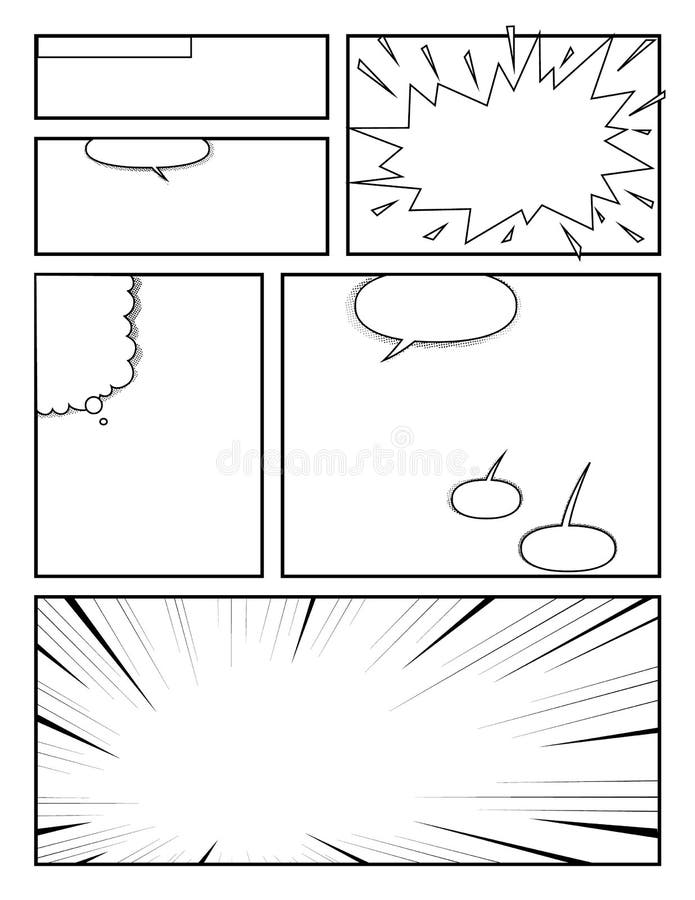
Free with trial Comic book template to create comics with radial halftone dotted rays stripes effects and speech bubblesю Manga Storyboard Layout template for Drawing Stories. Timeline dots vectors Comic book template to create comics with radial halftone dotted rays stripes effects and speech bubbles
Free with trial Mesh rush grace credit periods model with triangle mosaic icon. Wire carcass triangular network of rush grace credit periods. Vector mosaic of triangle parts in different sizes, and color tones. Timeline dots illustrations Rush Grace Credit Periods Vector Mesh Carcass Model and Triangle Mosaic Icon. Mesh rush grace credit periods model with triangle mosaic icon. Wire carcass triangular network of rush grace credit periods. Vector mosaic of triangle parts in different sizes, and color tones
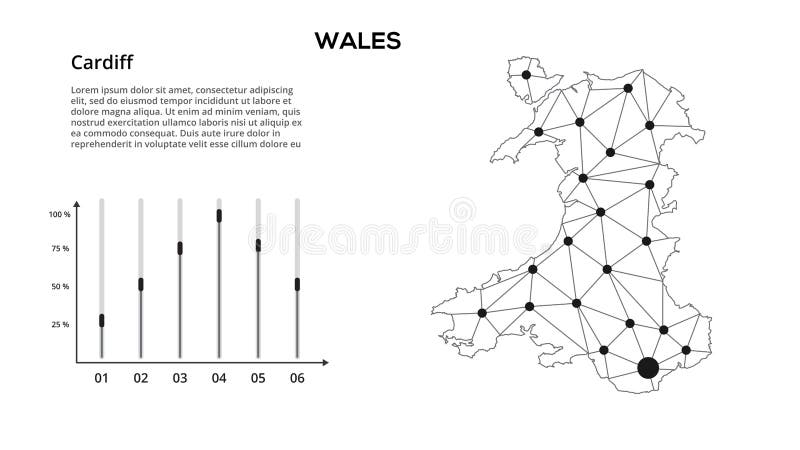
Free with trial Wales communication network map. Vector image of a low poly global map with city lights. Map in the form of lines and dots. Timeline dots vectors Wales communication network map. Vector image of a low poly global map with city lights. Map in the form of lines and dots
Free with trial Communication network map. Vector image of a low poly global map with city lights. Map in the form of lines and dots. Timeline dots vectors Set line maps. Slovenia, Spain, Sweden, Switzerland, United States of America, Ukraine, Canada, Costa Rica, Cuba. Communication network map. Vector image of a low poly global map with city lights. Map in the form of lines and dots
Free with trial A clear vector illustration of a series of interconnected dots, representing a digital process flow or timeline. Perfect for themes of data progression, step-by-step instructions, analytical stages, project management, or technological sequences. This design visualizes sequential operations and connectivity, vector design Generative AI. Timeline dots vectors Digital Process Flow Timeline Dots, vector design Generative AI. A clear vector illustration of a series of interconnected dots, representing a digital process flow or timeline. Perfect for themes of data progression, step-by-step instructions, analytical stages, project management, or technological sequences. This design visualizes sequential operations and connectivity, vector design Generative AI
Free with trial A timeline featuring several milestones represented through illustrated dots and lines accented with playful icons to mark significant events. Timeline dots vectors A timeline featuring several milestones represented through illustrated dots and lines accented with playful icons to
Free with trial 3D blue timeline icon with connected dots and right arrow, representing process flow, progress, or project planning. Suitable for business infographics and time tracking visuals. Timeline dots illustrations 3D Blue Timeline Icon with Forward Arrow. 3D blue timeline icon with connected dots and right arrow, representing process flow, progress, or project planning. Suitable for business infographics and time tracking visuals
Free with trial This image features a timeline composed of seven hexagons in a row, each with a different color. The hexagons are connected by a thin line and are arranged from left to right in a gradient of colors. The colors range from light orange to dark purple. Each hexagon contains a series of small dots arranged in a pattern. The word 'TIMELINE' is written in bold letters below the hexagons, accompanied by. Timeline dots illustrations Colorful hexagon timeline. This image features a timeline composed of seven hexagons in a row, each with a different color. The hexagons are connected by a thin line and are arranged from left to right in a gradient of colors. The colors range from light orange to dark purple. Each hexagon contains a series of small dots arranged in a pattern. The word 'TIMELINE' is written in bold letters below the hexagons, accompanied by
Free with trial A sleek abstract vector element featuring a horizontal bar with evenly spaced dots. This modern graphic can symbolize progression, connection, or a digital timeline. Ideal for infographics, technology displays, or minimalist design accents, providing a clean visual, vector design Generative AI. Timeline dots vectors Abstract Horizontal Element with Dots, vector design Generative AI. A sleek abstract vector element featuring a horizontal bar with evenly spaced dots. This modern graphic can symbolize progression, connection, or a digital timeline. Ideal for infographics, technology displays, or minimalist design accents, providing a clean visual, vector design Generative AI
Free with trial A modern vector illustration of a linear project timeline infographic, displaying key milestones and progress with connected dots. This clean design is perfect for business presentations, strategic planning, or educational content, conveying clear progression and organized task management, vector design Generative AI. Timeline dots vectors Linear Project Timeline Infographic, vector design Generative AI. A modern vector illustration of a linear project timeline infographic, displaying key milestones and progress with connected dots. This clean design is perfect for business presentations, strategic planning, or educational content, conveying clear progression and organized task management, vector design Generative AI