Free with trial This professional and minimalistic image features a grid of six distinct graphs and charts analyzing various aspects of solar energy usage, including a multi-colored line graph, a red line graph showing an upward trend, another displaying a lower trend, a blue line graph, and a graph with red lines, complemented on the right by icons representing a pie chart, a bar graph, and a magnifying glass to. Usage graphs illustrations A set of six modern solar energy usage graphs and charts arranged in a clean grid layout with data visualization icons on a white. This professional and minimalistic image features a grid of six distinct graphs and charts analyzing various aspects of solar energy usage, including a multi-colored line graph, a red line graph showing an upward trend, another displaying a lower trend, a blue line graph, and a graph with red lines, complemented on the right by icons representing a pie chart, a bar graph, and a magnifying glass to
Free with trial A professional digital background depicting a comprehensive network monitoring dashboard. The composition shows multiple dashboard panels displaying real-time metrics: bandwidth usage graphs in line and area chart format, latency and packet loss indicators, device status icons showing green for healthy and red for critical, alert notifications, and a network topology map. The interface is dark-. Usage graphs illustrations A Network Monitoring Dashboard Background With Graphs Alerts Real Time Metrics And Status Indicators. A professional digital background depicting a comprehensive network monitoring dashboard. The composition shows multiple dashboard panels displaying real-time metrics: bandwidth usage graphs in line and area chart format, latency and packet loss indicators, device status icons showing green for healthy and red for critical, alert notifications, and a network topology map. The interface is dark-
Free with trial Business analysis, statistics, conservation planning, environmental monitoring, resource management, water usage. Graphs and water drop icon. Business analysis and resource management concept. Usage graphs vectors Data Analytics Chart with Line Graph, Bar Graph, and Water Conservation Illustration. Business analysis, statistics, conservation planning, environmental monitoring, resource management, water usage. Graphs and water drop icon. Business analysis and resource management concept
Free with trial A modern smart home setup featuring a tablet and smartphone displaying home automation dashboards. The screens show energy usage graphs, temperature controls, and other smart home metrics. A smart speaker sits on a wooden cabinet, suggesting voice control integration. The scene represents the convenience and efficiency of connected living, suitable for illustrating technology, IoT, and modern lifestyle concepts. Usage graphs illustrations Smart Home Automation System Display. A modern smart home setup featuring a tablet and smartphone displaying home automation dashboards. The screens show energy usage graphs, temperature controls, and other smart home metrics. A smart speaker sits on a wooden cabinet, suggesting voice control integration. The scene represents the convenience and efficiency of connected living, suitable for illustrating technology, IoT, and modern lifestyle concepts.
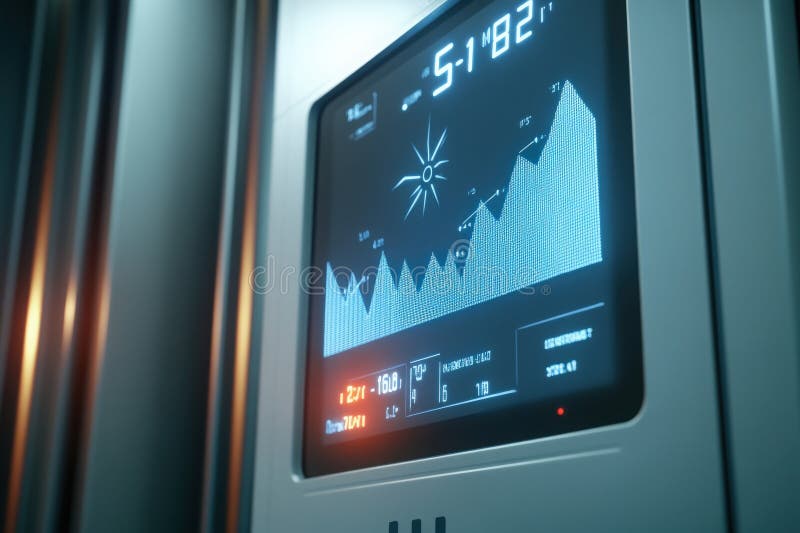
Free with trial Hydrogen smart meter with a sleek silver frame and digital touchscreen display is mounted on a gray wall. The screen shows metrics such as flow rate and cumulative usage with graphs and numeric indicators. Blue LED lighting outlines the device, enhancing visibility and modern aesthetics. Controls at the bottom of the screen allow for settings adjustment, indicating advanced functionality. The words 'H2 Smart Energy' are printed in the corner, highlighting its purpose in monitoring hydrogen energy consumption. Usage graphs illustrations Smart meter with a sleek silver frame and digital touchscreen
Free with trial A digital dashboard displaying real-time home energy consumption, including daily usage graphs, usage breakdown by room, current power, monthly estimates, and alerts. Usage graphs vectors Smart Home Energy Monitor Dashboard with Usage Breakdown and Alerts. A digital dashboard displaying real-time home energy consumption, including daily usage. A digital dashboard displaying real-time home energy consumption, including daily usage graphs, usage breakdown by room, current power, monthly estimates, and alerts
Free with trial Explore a digital touchscreen interface representing smart home energy management with solar output metrics and usage graphs that enhance technological efficiency. Gantry. Usage graphs illustrations Futuristic Smart Home Control Interface with Energy Usage Indicators and Solar Power Output Data Displayed on a. Explore a digital touchscreen interface representing smart home energy management with solar output metrics and usage graphs that enhance technological efficiency. Gantry
Free with trial The image shows a sleek, modern smart thermostat screen with a main display indicating an indoor temperature of 72 degrees. The interface includes various control options such as fan settings, temperature adjustment sliders, and system modes like 'eco' and 'away. ' Additional sections show system status, recent activity, and energy usage graphs, highlighting the device's connectivity and smart home. Usage graphs illustrations Smart thermostat interface displaying current indoor temperature and system status. The image shows a sleek, modern smart thermostat screen with a main display indicating an indoor temperature of 72 degrees. The interface includes various control options such as fan settings, temperature adjustment sliders, and system modes like 'eco' and 'away.' Additional sections show system status, recent activity, and energy usage graphs, highlighting the device's connectivity and smart home
Free with trial The image shows a digital interface of a smart thermostat displayed on a tablet screen. The screen indicates an indoor temperature of 72 degrees Fahrenheit and includes various system statuses such as system mode, fan status, and system runtime. There are also settings for system behavior, schedule, and energy usage graphs, along with options for adjusting temperature settings and viewing detailed. Usage graphs illustrations Modern smart thermostat displaying indoor temperature and system status on a tablet interface. The image shows a digital interface of a smart thermostat displayed on a tablet screen. The screen indicates an indoor temperature of 72 degrees Fahrenheit and includes various system statuses such as system mode, fan status, and system runtime. There are also settings for system behavior, schedule, and energy usage graphs, along with options for adjusting temperature settings and viewing detailed
Free with trial A close-up shot of a hand interacting with a modern smart home automation system, adjusting the temperature on a sleek digital display mounted on a wall. The screen shows various controls and data, including current temperature, weather, and energy usage graphs, set against a blurred background of a contemporary interior. Usage graphs illustrations Smart Home Automation System with Hand Adjusting Temperature on Digital Display. A close-up shot of a hand interacting with a modern smart home automation system, adjusting the temperature on a sleek digital display mounted on a wall. The screen shows various controls and data, including current temperature, weather, and energy usage graphs, set against a blurred background of a contemporary interior
Free with trial This comprehensive vector icon set features various flat-design elements related to energy management, smart home technology, and sustainability. Icons include an energy meter, usage graphs, dashboards, lightning bolts, electrical plugs, a battery, green leaves, and smart home symbols. Ideal for illustrating concepts of electricity consumption, renewable energy, eco-friendly living, home automation, and utility monitoring. Perfect for websites, apps, infographics, and presentations focusing on modern energy solutions and environmental awareness. Usage graphs illustrations Smart Home Energy Management and Sustainable Living Vector Icons Set. This comprehensive vector icon set features various flat-design elements related to energy management, smart home technology, and sustainability. Icons include an energy meter, usage graphs, dashboards, lightning bolts, electrical plugs, a battery, green leaves, and smart home symbols. Ideal for illustrating concepts of electricity consumption, renewable energy, eco-friendly living, home automation, and utility monitoring. Perfect for websites, apps, infographics, and presentations focusing on modern energy solutions and environmental awareness.
Free with trial A strategic digital background representing network capacity planning and forecasting. The composition shows bandwidth usage graphs with historical data, current utilization, and future growth projections shown as a dotted line extending upward. Resources such as bandwidth, port capacity, and processing power are shown with scaling indicators: current capacity in blue and projected needed capacity. Usage graphs illustrations A Network Capacity Planning Background With Bandwidth Forecast Growth Projections And Resource Scaling. A strategic digital background representing network capacity planning and forecasting. The composition shows bandwidth usage graphs with historical data, current utilization, and future growth projections shown as a dotted line extending upward. Resources such as bandwidth, port capacity, and processing power are shown with scaling indicators: current capacity in blue and projected needed capacity
Free with trial Close-up of a smart home control panel displaying temperature, energy usage graphs, and automation options. The interface shows a temperature of 22�C, indicating a comfortable indoor environment and the potential for efficient energy management. Usage graphs illustrations Smart Home Control Panel Temperature, Energy Efficiency, Automation. Close-up of a smart home control panel displaying temperature, energy usage graphs, and automation options. The interface shows a temperature of 22�C, indicating a comfortable indoor environment and the potential for efficient energy management.
Free with trial Modern smart home interior featuring sleek, minimalist design with large windows providing natural light. The open-plan layout includes a living area with a sofa, dining set, and a kitchen with high-tech appliances. Digital displays show energy monitoring data such as usage graphs and efficiency ratings. Connected devices are indicated by digital icons suggesting interactivity and automation. Neutral tones dominate the color scheme, complemented by green plants for a touch of nature. Energy-efficient lighting and smart controls are integrated throughout the space. Usage graphs illustrations Smart Home Interior with Energy Monitoring and Connected Devices. Modern smart home interior featuring sleek, minimalist design with large windows providing natural light. The open-plan layout includes a living area with a sofa, dining set, and a kitchen with high-tech appliances. Digital displays show energy monitoring data such as usage graphs and efficiency ratings. Connected devices are indicated by digital icons suggesting interactivity and automation. Neutral tones dominate the color scheme, complemented by green plants for a touch of nature. Energy-efficient lighting and smart controls are integrated throughout the space.
Free with trial A modern living room setting showcasing smart home technology. A tablet displays energy usage graphs, while a smartphone shows a thermostat control interface. A smart speaker sits nearby, highlighting the convenience and connectivity of a smart home system. This image represents energy efficiency, home automation, and the Internet of Things. Usage graphs illustrations Smart Home Energy Management. A modern living room setting showcasing smart home technology. A tablet displays energy usage graphs, while a smartphone shows a thermostat control interface. A smart speaker sits nearby, highlighting the convenience and connectivity of a smart home system. This image represents energy efficiency, home automation, and the Internet of Things.
Free with trial Smart home automation for energy savings A sleek, modern smart home thermostat mounted on a neutral colored wall. The digital display shows abstract green energy usage graphs and numbers, emitting a. Usage graphs illustrations Smart home automation for energy savings A sleek, modern smart home thermostat mounted on a neutral colored wall. The digital
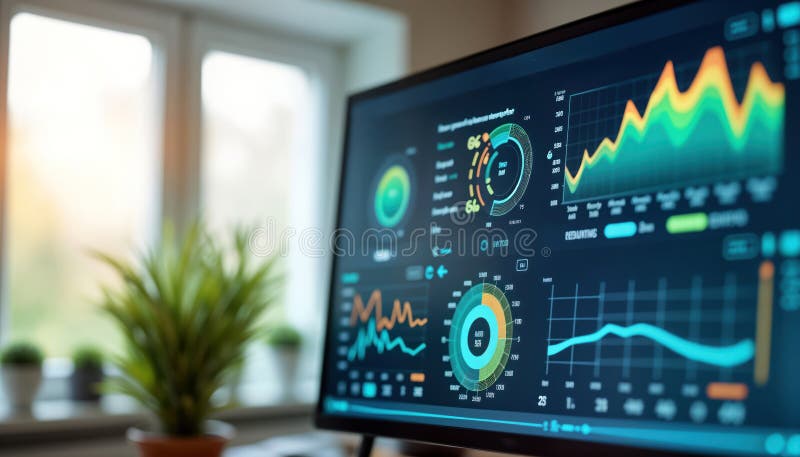
Free with trial Modern tablet showing an "Energy Hub" interface with various power usage statistics, bar graphs, and numerical data, placed on a light wooden table in a well-lit room, representing smart home energy management. Usage graphs illustrations Digital tablet displaying a real-time energy usage dashboard with graphs and data on a wooden desk. Modern tablet showing an "Energy Hub" interface with various power usage statistics, bar graphs, and numerical data, placed on a light wooden table in a well-lit room, representing smart home energy management
Free with trial Tablet showing a smart home dashboard with energy usage graphs and a solar panel house model. Usage graphs illustrations Smart home system displaying solar energy dashboard on tablet. Tablet showing a smart home dashboard with energy usage graphs and a solar panel house model
Free with trial This image displays a collection of vibrant mobile app usage infographics, featuring colorful graphs, charts, and statistics on a dark background, showcasing various data visualization elements in shades of pink, blue, orange, and purple. Usage graphs illustrations Vibrant mobile app usage infographic with colorful graphs and charts on dark background. This image displays a collection of vibrant mobile app usage infographics, featuring colorful graphs, charts, and statistics on a dark background, showcasing various data visualization elements in shades of pink, blue, orange, and purple
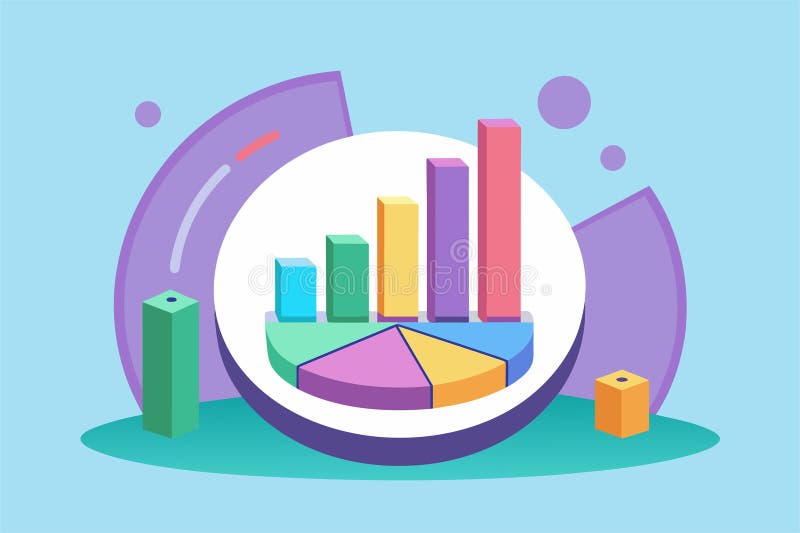
Free with trial A visual representation of resource usage with bar graphs and pie charts in bright colors on a pastel background, Examine resource usage, simple picture. Usage graphs vectors A visual representation of resource usage with bar graphs and pie charts in bright colors on a pastel background, Examine resource
Free with trial Detailed graphs and charts are displayed on a projector illustrating the current energy usage trends and potential for improvement.. Vector illustration. Usage graphs vectors Detailed graphs and charts are displayed on a projector illustrating the current energy usage trends and potential for
Free with trial A smart home dashboard phone held by hand showing energy usage and graphs with neutral modern interface, casual indoor setting with blurred, Generative AI. Usage graphs illustrations Smart home dashboard phone held by hand showing energy usage and graphs with neutral modern interface, casual indoor setting with
Free with trial Usage data template water illustration conservation graphs, charts information, consumption sources usage data template water. Usage graphs illustrations Usage data template water
Free with trial A modern control room featuring large screens displaying global energy usage data. Graphs and charts highlight various energy metrics, alongside a world map showing client locations. Several computer monitors are set up on desks in the foreground, suggesting a focus on data analysis and monitoring. The room is brightly lit, with a contemporary design emphasizing efficiency and technology integration. Usage graphs illustrations A modern control room featuring large screens displaying global energy usage data.
Free with trial A wall-mounted smart display in a wooden frame shows real-time energy usage data, including renewable sources and live demand, in a modern, sunlit office environment. Usage graphs illustrations Wall-Mounted Smart Display in a Wooden Frame Showing Real-Time Energy Usage Graphs. A wall-mounted smart display in a wooden frame shows real-time energy usage data, including renewable sources and live demand, in a modern, sunlit office environment
Free with trial A visual representation of monthly usage statistics, including charts, graphs, and key performance indicators. Usage graphs vectors Monthly Usage Statistics Report with Charts and Performance Metrics. A visual representation of monthly usage statistics, including charts, graphs, and key performance indicators
Free with trial A software interface displaying pod logs with CPU usage graphs and log entries for a monitoring system. Usage graphs vectors Pod Logs Monitoring System Interface. A software interface displaying pod logs with CPU usage graphs and log entries for a monitoring system
Free with trial A high-tech energy monitor displaying real-time data, with colorful charts and graphs showcasing electricity consumption and trends.. Generative AI. Usage graphs illustrations High-Tech Energy Monitor Displaying Real-Time Energy Usage with Colorful Graphs and Data. A high-tech energy monitor displaying real-time data, with colorful charts and graphs showcasing electricity consumption and trends.. Generative AI
Free with trial Smart energy monitor displaying a digital dashboard on a sleek black and silver rectangular screen. The display shows a usage reading of 4. 2 kWh with colorful bar graphs representing different time intervals beneath. Below the graphs, icons labeled 'Sink,' 'Lights,' 'Oven,' etc. , indicate various household appliances. Positioned on a modern stand, the monitor sits on a white countertop. To the left, a small potted succulent (likely a Haworthia species) adds a decorative touch. The setting resembles a contemporary kitchen or office space. Usage graphs illustrations Intervals beneath. Below the graphs, icons labeled Sink, Lights, Oven, etc. Smart energy monitor displaying a digital dashboard on a sleek black and silver rectangular screen. The display shows a usage reading of 4.2 kWh with colorful bar graphs representing different time intervals beneath. Below the graphs, icons labeled 'Sink,' 'Lights,' 'Oven,' etc., indicate various household appliances. Positioned on a modern stand, the monitor sits on a white countertop. To the left, a small potted succulent (likely a Haworthia species) adds a decorative touch. The setting resembles a contemporary kitchen or office space.
Free with trial A smartphone is placed on a wooden table in front of a house with solar panels on its roof the phone displays an energy usage app showing various graphs and statistics the house has a well-manicured lawn and a garden with flowers and trees in the background the sky is blue with a few clouds. Usage graphs illustrations A smartphone displays energy usage data on a table in front of a house with solar panels. a smartphone is placed on a wooden table in front of a house with solar panels on its roof the phone displays an energy usage app showing various graphs and statistics the house has a well-manicured lawn and a garden with flowers and trees in the background the sky is blue with a few clouds
Free with trial The a digital interface displaying server statuses and CPU usage in a data center with multiple servers and network nodes. The interface graphs, charts, and status indicators in green, blue, red. Usage graphs illustrations A digital interface displaying server statuses and C P U usage in a data center with multiple servers and network nodes. The a digital interface displaying server statuses and CPU usage in a data center with multiple servers and network nodes. The interface graphs, charts, and status indicators in green, blue, red
Free with trial The smart utility meter shows current energy consumption and usage patterns on its digital display, providing detailed insights on indoor energy management and efficiency. Usage graphs illustrations Isolated smart utility meter displaying energy usage data and graphs indoors. The smart utility meter shows current energy consumption and usage patterns on its digital display, providing detailed insights on indoor energy management and efficiency.
Free with trial Modern tech hub shows real-time energy data. Smart meters, renewable energy sources optimize household usage. Futuristic interface displays graphs charts. Data visualizes energy. Usage graphs illustrations Modern tech hub shows real-time energy data. Smart meters, renewable energy sources optimize household usage. Futuristic
Free with trial This vector illustration features a futuristic system command center dashboard with a radar scan, telemetry line graphs. Usage graphs vectors Futuristic system command center dashboard with radar scan data telemetry line graphs and resource usage bar charts. This vector illustration features a futuristic system command center dashboard with a radar scan, telemetry line graphs
Free with trial A modern smart thermostat interface displayed on a laptop, tablet, and smartphone. The dashboard shows temperature readings, weather conditions, and energy usage graphs. Ideal for illustrating home automation, energy efficiency, and smart technology concepts. Usage graphs illustrations Smart Thermostat Dashboard on Multiple Devices. A modern smart thermostat interface displayed on a laptop, tablet, and smartphone. The dashboard shows temperature readings, weather conditions, and energy usage graphs. Ideal for illustrating home automation, energy efficiency, and smart technology concepts