Free with trial Vector circle infographic template for graphs, charts, diagrams. Pie chart concept with 12 options, parts, steps, processes. Value interval vectors Vector circle infographic template for graphs, charts, diagrams. Pie chart concept with 12 options, parts, steps, processes
Free with trial Digital timer. Set of twelve digital timers showing different times. Value interval vectors Digital timer. Set of twelve digital timers showing different times
Free with trial Vector circle infographic templates for graphs, charts, diagrams. Pie chart concept with 4-12 options, parts, steps, processes. Value interval vectors Vector circle infographic templates 4-12 options. Vector circle infographic templates for graphs, charts, diagrams. Pie chart concept with 4-12 options, parts. Vector circle infographic templates for graphs, charts, diagrams. Pie chart concept with 4-12 options, parts, steps, processes.
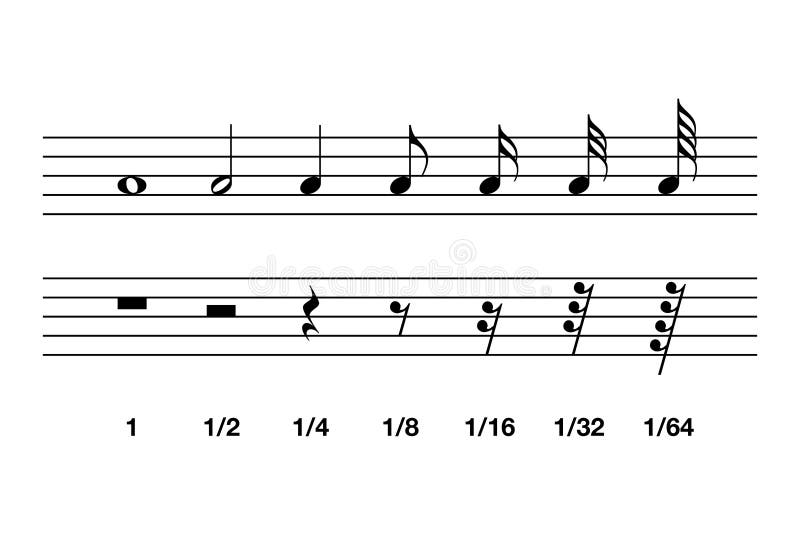
Free with trial Standard note values and rests in western music notation. The relative duration of a note and the interval of silence in a piece of music, marked by specific symbols. Illustration over white. Vector. Value interval vectors Standard note values and rests in music notation. Standard note values and rests in western music notation. The relative duration of a note and the interval of. Standard note values and rests in western music notation. The relative duration of a note and the interval of silence in a piece of music, marked by specific symbols. Illustration over white. Vector.
Free with trial Timer. Set of twelve timers showing different time. Value interval vectors Timer. Set of twelve timers showing different time
Free with trial Vector circle infographic template for graphs, charts, diagrams. Pie chart concept with 6 options, parts, steps, processes. Value interval vectors Vector circle infographic template for graphs, charts, diagrams. Pie chart concept with 6 options, parts, steps, processes
Free with trial Vector circle infographic template for graphs, charts, diagrams. Pie chart concept with 5 options, parts, steps, processes. Value interval vectors Vector circle infographic template for graphs, charts, diagrams. Pie chart concept with 5 options, parts, steps, processes
Free with trial Vector circle infographic template for graphs, charts, diagrams. Pie chart concept with 7 options, parts, steps, processes. Value interval vectors Vector circle infographic template for graphs, charts, diagrams. Pie chart concept with 7 options, parts, steps, processes
Free with trial Accuracy and precision. Statistical scheme of accuracy and precision on target. Value interval vectors Accuracy and precision. Statistical scheme of accuracy and precision on target
Free with trial Vector circle infographic template for graphs, charts, diagrams. Pie chart concept with 10 options, parts, steps, processes. Value interval vectors Vector circle infographic template for graphs, charts, diagrams. Pie chart concept with 10 options, parts, steps, processes
Free with trial This illustration concept shows the choices of availability. The availability is the degree to which a system is operable. Value interval illustrations The availability is the degree to which a system is operable. This illustration concept shows the choices of availability. The availability is the degree to. This illustration concept shows the choices of availability. The availability is the degree to which a system is operable
Free with trial Vector circle infographic template for graphs, charts, diagrams. Pie chart concept with 8 options, parts, steps, processes. Value interval vectors Vector circle infographic template for graphs, charts, diagrams. Pie chart concept with 8 options, parts, steps, processes
Free with trial Statistics diagram. 3d statistics diagram with arrow. Value interval illustrations Statistics diagram. 3d statistics diagram with arrow
Free with trial Thermometers with basic values of temperature with the scale division in units of Fahrenheit, Celsius, Kelvin. Vector illustration set of a visual material on thermodynamics for education and science. Value interval vectors Thermometers Set Fahrenheit Celsius Kelvin Temperature Division. Thermometers with basic values of temperature with the scale division in units of Fahrenheit. Thermometers with basic values of temperature with the scale division in units of Fahrenheit, Celsius, Kelvin. Vector illustration set of a visual material on thermodynamics for education and science.
Free with trial Music rests and their symbols and lengths. A rest is an interval of silence in a piece of music, marked by a symbol indicating the length of a pause. Black illustration on white background. Vector. Value interval vectors Music rests and their symbols and lengths. A rest is an interval of silence in a piece of music, marked by a symbol indicating the length of a pause. Black
Free with trial Music rests. Symbols and lengths. American and British English labeling. Interval of silence in a piece of music, marked by a symbol, indicating the length of a pause. Illustration over white. Vector. Value interval vectors Music rest symbols and lengths, English labeling. Music rests. Symbols and lengths. American and British English labeling. Interval of silence in a piece of. Music rests. Symbols and lengths. American and British English labeling. Interval of silence in a piece of music, marked by a symbol, indicating the length of a pause. Illustration over white. Vector
Free with trial Timeline template with graph. Vector Infographic Company Milestones Timeline Template with graph curve. Value interval vectors Timeline template with graph. Vector Infographic Company Milestones Timeline Template with graph curve
Free with trial Set of line graph infographic templates for charts and diagrams. Business, education, industry, science concept with 3-8 values, options, parts, steps, processes. Value interval vectors Set of line graph infographic templates for charts and diagrams. Business, education, industry, science concept with 3-8 values, options, parts, steps
Free with trial Statistics diagram. 3d statistics diagram with arrow. Value interval illustrations Statistics diagram. 3d statistics diagram with arrow
Free with trial Web analytics. Flat vector scheme of web analytics information, development and statistic. Vector illustration. Value interval vectors Web analytics. Flat vector scheme of web analytics information, development and statistic. Vector illustration
Free with trial Modern green digital timer - stopwatch vector. Value interval vectors Modern green digital timer. Stopwatch vector
Free with trial Vector circle infographic template for graphs, charts, diagrams. Pie chart concept with 11 options, parts, steps, processes. Value interval vectors Vector circle infographic template for graphs, charts, diagrams. Pie chart concept with 11 options, parts, steps, processes
Free with trial Football - Soccer scoreboard and timer, stopwatch to track the time in a football game, Broadcast Graphics template - eps available. Value interval vectors Football - Soccer scoreboard and timer. Stopwatch to track the time in a football game, Broadcast Graphics template - eps available
Free with trial Vector circle infographic template for graphs, charts, diagrams. Pie chart concept with 9 options, parts, steps, processes. Value interval vectors Vector circle infographic template for graphs, charts, diagrams. Pie chart concept with 9 options, parts, steps, processes
Free with trial Timers set Twelve different timers. Each timer has twelve positions. Value interval vectors Timers set. Twelve different timers. Each timer has twelve positions
Free with trial Timer icon sets - blue indicator, suitable for user interface. Value interval vectors Timer icon sets - blue indicator. Suitable for user interface
Free with trial Football - Soccer Modern Green digital timer - stopwatch, to track the time in a football game - eps available. Value interval vectors Football - Soccer Modern Green digital timer. Stopwatch, to track the time in a football game - eps available
Free with trial Vector circle infographic template for graphs, charts, diagrams. Pie chart concept with 4 options, parts, steps, processes. Value interval vectors Vector circle infographic template for graphs, charts, diagrams. Pie chart concept with 4 options, parts, steps, processes
Free with trial Stopwatch. Set of green digital timers. With different figures. Value interval illustrations Stopwatch. Set of green digital timers. With different figures
Free with trial Infographic design template. Creative concept with 5 steps. Can be used for workflow layout, diagram, banner, webdesign. Vector illustration. Value interval vectors Infographic design template. Creative concept with 5 steps. Can be used for workflow layout, diagram, banner, webdesign. Vector illustration
Free with trial Digital Countdown Timer. On a black background. Value interval illustrations Digital Countdown Timer. On a black background
Free with trial Digital Countdown Timer. On a white background. Value interval vectors Digital Countdown Timer. On a white background
Free with trial Watches icons. Over white background vector illustration. Value interval vectors Watches icons. Over white background vector illustration
Free with trial Time management. Over vintage background vector illustration. Value interval vectors Time management. Over vintage background vector illustration
Free with trial Time summer. Over blue background vector illustration. Value interval vectors Time summer. Over blue background vector illustration
Free with trial Watches icons. Over white background vector illustration. Value interval vectors Watches icons. Over white background vector illustration
Free with trial Timer design. Over black background vector illustration. Value interval vectors Timer design. Over black background vector illustration
Free with trial This captivating stock image embodies the intricate interplay between time and our inevitable deadline, evoking a sense of urgency and finality. The hourglass, an ancient timekeeping device, stands as the focal point, with fine granules of sand flowing from one glass bulb to another, precisely measuring time intervals. As the sand flows, it symbolizes the finite nature of time, drawing parallels with the relentless march of history and the urgent issues of our era, such as climate change and global warming. Flames and embers encircle the hourglass, alluding to the fiery potential consequences of inaction. This surreal and abstract image invites contemplation of time's passage, the concept of infinity, and the juxtaposition of hot and cold, while hinting at the possibility of time travel and the winding journey of existence. A powerful visual for projects exploring time, deadlines, and the consequences of our actions. Value interval illustrations Hourglass time concept. deadline, the end. ending time. fire and ice. global warming. aclimate change. fantasy. This captivating stock image embodies the. This captivating stock image embodies the intricate interplay between time and our inevitable deadline, evoking a sense of urgency and finality. The hourglass, an ancient timekeeping device, stands as the focal point, with fine granules of sand flowing from one glass bulb to another, precisely measuring time intervals.As the sand flows, it symbolizes the finite nature of time, drawing parallels with the relentless march of history and the urgent issues of our era, such as climate change and global warming. Flames and embers encircle the hourglass, alluding to the fiery potential consequences of inaction.This surreal and abstract image invites contemplation of time's passage, the concept of infinity, and the juxtaposition of hot and cold, while hinting at the possibility of time travel and the winding journey of existence. A powerful visual for projects exploring time, deadlines, and the consequences of our actions.
Free with trial This captivating stock image embodies the intricate interplay between time and our inevitable deadline, evoking a sense of urgency and finality. The hourglass, an ancient timekeeping device, stands as the focal point, with fine granules of sand flowing from one glass bulb to another, precisely measuring time intervals. As the sand flows, it symbolizes the finite nature of time, drawing parallels with the relentless march of history and the urgent issues of our era, such as climate change and global warming. Flames and embers encircle the hourglass, alluding to the fiery potential consequences of inaction. This surreal and abstract image invites contemplation of time's passage, the concept of infinity, and the juxtaposition of hot and cold, while hinting at the possibility of time travel and the winding journey of existence. A powerful visual for projects exploring time, deadlines, and the consequences of our actions. Value interval illustrations Hourglass time concept. deadline, the end. ending time. red sand and dirt. smoke and ashes. cloudy dark storm sky. This captivating stock image embodies the. This captivating stock image embodies the intricate interplay between time and our inevitable deadline, evoking a sense of urgency and finality. The hourglass, an ancient timekeeping device, stands as the focal point, with fine granules of sand flowing from one glass bulb to another, precisely measuring time intervals.As the sand flows, it symbolizes the finite nature of time, drawing parallels with the relentless march of history and the urgent issues of our era, such as climate change and global warming. Flames and embers encircle the hourglass, alluding to the fiery potential consequences of inaction.This surreal and abstract image invites contemplation of time's passage, the concept of infinity, and the juxtaposition of hot and cold, while hinting at the possibility of time travel and the winding journey of existence. A powerful visual for projects exploring time, deadlines, and the consequences of our actions.
Free with trial 3d illustration of musical notes. On black. Value interval illustrations 3d illustration of musical notes. On black
Free with trial 3d illustration of musical notes. On black. Value interval illustrations 3d illustration of musical notes. On black
Free with trial Time, clock stop watch, limited offer, happy hour, deadline concept, hand, line icon vector illustration. Value interval vectors Time, clock stop watch, limited offer, happy hour, deadline concept, hand, line icon, vector illustration. Time, clock stop watch, limited offer, happy hour. Time, clock stop watch, limited offer, happy hour, deadline concept, hand, line icon vector illustration
Free with trial Green Timeline Infographic Design. Green Timeline for 2006 - 2016 Infographic Design on White Background. Value interval vectors Green Timeline Infographic Design. Green Timeline for 2006 - 2016 Infographic Design on White Background
Free with trial On the electrocardiogram, the PJ interval is used to distinguish between ventricular heartbeats and ventricular pre excitation. The normal value of PJ interval is less than 270ms. Value interval illustrations PJ interval. On the electrocardiogram, the PJ interval is used to distinguish between ventricular heartbeats and ventricular pre excitation. The normal value of. On the electrocardiogram, the PJ interval is used to distinguish between ventricular heartbeats and ventricular pre excitation. The normal value of PJ interval is less than 270ms.
Free with trial Algebra inequality formula set for linear quadratic absolute value relations with multiplication division addition reversal interval method square properties notation. Value interval vectors Algebra inequality formula set. For linear quadratic absolute value relations with multiplication division addition reversal interval method square properties
Free with trial This line-art explains the bisection method, a classic numerical root-finding algorithm. At the top, a function curve crosses a horizontal baseline, and two stems at the ends show one value below zero and one above, which guarantees a root lies between them. Below, a stack of bars shows each iteration: a small cut mark sits at the midpoint of every bar, the half that still contains the sign change is drawn solid, and the rejected half is dashed. Each new bar is exactly the kept half of the one above, so the bracket shrinks by a factor of two every step. A dotted guide drops from the crossing point through every level to a final marker, showing the solution stays trapped inside the shrinking bracket. Value interval vectors Bisection Method Visual - Root Bracketing by Repeated Interval Halving. This line-art explains the bisection method, a classic numerical root-finding algorithm. This line-art explains the bisection method, a classic numerical root-finding algorithm. At the top, a function curve crosses a horizontal baseline, and two stems at the ends show one value below zero and one above, which guarantees a root lies between them. Below, a stack of bars shows each iteration: a small cut mark sits at the midpoint of every bar, the half that still contains the sign change is drawn solid, and the rejected half is dashed. Each new bar is exactly the kept half of the one above, so the bracket shrinks by a factor of two every step. A dotted guide drops from the crossing point through every level to a final marker, showing the solution stays trapped inside the shrinking bracket.
Free with trial Sand hourglass as a powerful metaphor for the passage of time and the value of each moment. Generative AI. Value interval illustrations Sand hourglass as a powerful metaphor for the passage of time and the value of each moment. Generative AI
Free with trial Time series analysis with sequence of data points outline hands concept. Scientific statistics and forecasting method for data science vector illustration. Interval of time axis for periodic chart. Value interval vectors Time series analysis with sequence of data points outline hands concept. Scientific statistics and forecasting method for data science vector illustration
Free with trial The image displays a bar and line graph illustrating the growth of a certain value over time. The x-axis represents time, divided into quarters (Q1 to Q4) for the first year and years for the subsequent years. The y-axis represents the value, ranging from 0 to 100. The graph shows a consistent upward trend, indicating a steady increase in value over the observed period. The bars represent the. Value interval illustrations Illustrative graph showing progressive growth over time. The image displays a bar and line graph illustrating the growth of a certain value over time. The x-axis. The image displays a bar and line graph illustrating the growth of a certain value over time. The x-axis represents time, divided into quarters (Q1 to Q4) for the first year and years for the subsequent years. The y-axis represents the value, ranging from 0 to 100. The graph shows a consistent upward trend, indicating a steady increase in value over the observed period. The bars represent the
Free with trial A professional partial dependence plot visualizes how a specific feature influences machine learning model predictions, displayed as a blue shaded confidence interval area. Created AI. Value interval illustrations Data science chart showing partial dependence plot for machine learning analysis. A professional partial dependence plot visualizes how a specific feature. A professional partial dependence plot visualizes how a specific feature influences machine learning model predictions, displayed as a blue shaded confidence interval area.Created AI
Free with trial A smooth continuous curve rises between two marked endpoints, crossing a horizontal target line at one guaranteed point in between. Value interval vectors Intermediate Value Theorem Visual – Curve Crossing a Target Line Between Two Marked Endpoints. A smooth continuous curve rises between two marked endpoints. A smooth continuous curve rises between two marked endpoints, crossing a horizontal target line at one guaranteed point in between.
Free with trial This image depicts a financial market stock chart with green and red candlesticks. The candlesticks represent price movements over specific time intervals, with green indicating an increase in value and red indicating a decrease. The chart is set against a dark background, highlighting the candlesticks clearly. This type of chart is commonly used by traders and investors to analyze market trends. Value interval illustrations Financial market stock chart. This image depicts a financial market stock chart with green and red candlesticks. The candlesticks represent price movements over. This image depicts a financial market stock chart with green and red candlesticks. The candlesticks represent price movements over specific time intervals, with green indicating an increase in value and red indicating a decrease. The chart is set against a dark background, highlighting the candlesticks clearly. This type of chart is commonly used by traders and investors to analyze market trends
Free with trial Confidence that is hitting a full scale, showing an extremely high level of confidence, overload of it, too much of it. Maximum value, off the charts. Value interval illustrations Confidence that is hitting a full scale, showing a very high level of confidence, overload of it, too much of. Confidence that is hitting a full scale, showing. Confidence that is hitting a full scale, showing an extremely high level of confidence, overload of it, too much of it. Maximum value, off the charts.
Free with trial The image displays a financial chart with multiple data series represented by different colored lines and bars. The chart includes a prominent peak labeled '22. 65,' indicating a significant value at that point. The x-axis appears to be marked with time intervals, while the y-axis shows numerical values, likely representing financial metrics such as stock prices or market indices. The lines and. Value interval illustrations Detailed financial chart showing fluctuating trends with a notable peak at 22.65. The image displays a financial chart with multiple data series represented by. The image displays a financial chart with multiple data series represented by different colored lines and bars. The chart includes a prominent peak labeled '22.65,' indicating a significant value at that point. The x-axis appears to be marked with time intervals, while the y-axis shows numerical values, likely representing financial metrics such as stock prices or market indices. The lines and
Free with trial A digital graph displays multiple golden trajectory lines diverging from a present moment toward future time projections, set against a dark background with faint code text and confidence interval markers. AI-generated. Value interval illustrations Future Projection Simulation Chart With Golden Lines. A digital graph displays multiple golden trajectory lines diverging from a present moment toward future. A digital graph displays multiple golden trajectory lines diverging from a present moment toward future time projections, set against a dark background with faint code text and confidence interval markers. AI-generated
Free with trial Time and money concept featuring a vibrant purple hourglass with flowing gold sand positioned next to a shiny gold dollar coin. This imagery symbolizes the adage 'time is money', emphasizing financial planning, investment deadlines, and value of efficient time management. Dark background highlights urgency and significance. Ideal for business, finance, and productivity themes. Value interval illustrations Purple Hourglass with Gold Sand and Dollar Coin Representing Time is Money Concept. Time and money concept featuring a vibrant purple hourglass with flowing gold. Time and money concept featuring a vibrant purple hourglass with flowing gold sand positioned next to a shiny gold dollar coin. This imagery symbolizes the adage 'time is money', emphasizing financial planning, investment deadlines, and value of efficient time management. Dark background highlights urgency and significance. Ideal for business, finance, and productivity themes
Free with trial This image depicts a bar and line graph that illustrates fluctuating values over a period of time. The x-axis represents time, while the y-axis represents the value. The graph shows an overall upward trend with several peaks and troughs, indicating periods of increase and decrease in value. The bars provide a visual representation of the value at specific intervals, while the line connects these. Value interval illustrations Graph showing fluctuating values over time. This image depicts a bar and line graph that illustrates fluctuating values over a period of time. The x-axis. This image depicts a bar and line graph that illustrates fluctuating values over a period of time. The x-axis represents time, while the y-axis represents the value. The graph shows an overall upward trend with several peaks and troughs, indicating periods of increase and decrease in value. The bars provide a visual representation of the value at specific intervals, while the line connects these
Free with trial This graphic features a minimalist circular timer interface displayed against a stark white background. The central area shows the numerical value in a bold blue font, while a partial blue ring indicates the progression of time. The design is clean, modern and highly functional for user interface applications or instructional media. The high-contrast color palette ensures clarity and readability. Value interval vectors A digital circular timer showing ten minutes on a clean white background. This graphic features a minimalist circular timer interface displayed against a stark. This graphic features a minimalist circular timer interface displayed against a stark white background. The central area shows the numerical value in a bold blue font, while a partial blue ring indicates the progression of time. The design is clean, modern and highly functional for user interface applications or instructional media. The high-contrast color palette ensures clarity and readability
Free with trial This minimalist graphic features a bold black number five centered within a circular outline that resembles a clock face. The design uses clean lines and high contrast to convey a sense of time, countdown, or numerical value. It is presented on a plain white background, making it versatile for various digital or print applications requiring a clear, symbolic representation of the digit five. Value interval vectors A simple black and white icon showing the number five inside a circular clock frame. This minimalist graphic features a bold black number five centered within a. This minimalist graphic features a bold black number five centered within a circular outline that resembles a clock face. The design uses clean lines and high contrast to convey a sense of time, countdown, or numerical value. It is presented on a plain white background, making it versatile for various digital or print applications requiring a clear, symbolic representation of the digit five
Free with trial The image displays a bar and line graph combination illustrating a steady increase in values. The bars, transitioning from blue to green, depict incremental growth over a series of intervals. A green line overlaying the bars emphasizes the upward trend, indicating a positive trajectory and significant growth in the final interval. This type of graph is often used in business, finance, and. Value interval illustrations Graph showing consistent growth and upward trend in data metrics over time. The image displays a bar and line graph combination illustrating a steady increase in. The image displays a bar and line graph combination illustrating a steady increase in values. The bars, transitioning from blue to green, depict incremental growth over a series of intervals. A green line overlaying the bars emphasizes the upward trend, indicating a positive trajectory and significant growth in the final interval. This type of graph is often used in business, finance, and
Free with trial The image displays a histogram, a type of bar graph that illustrates the distribution of a dataset. Each bar represents the frequency of data within certain intervals, showing how values are spread across the range. The varying heights of the bars indicate the number of data points in each interval, providing insights into the dataset's overall pattern and variability. Value interval illustrations A visual representation of data distribution in a histogram. The image displays a histogram, a type of bar graph that illustrates the distribution of a dataset. The image displays a histogram, a type of bar graph that illustrates the distribution of a dataset. Each bar represents the frequency of data within certain intervals, showing how values are spread across the range. The varying heights of the bars indicate the number of data points in each interval, providing insights into the dataset's overall pattern and variability
Free with trial Confidence and Self-Esteem Meter that is in full, hitting the end of the scale, showing an extremely high level of confidence, overload of it, too much of it. Maximum value, off the charts. Value interval illustrations Confidence and Self-Esteem Meter that is hitting a full scale, showing a very high level of confidence. Confidence and Self-Esteem Meter that is in full, hitting. Confidence and Self-Esteem Meter that is in full, hitting the end of the scale, showing an extremely high level of confidence, overload of it, too much of it. Maximum value, off the charts
Free with trial Confidence and Composure that is in full, hitting the end of the scale, showing an extremely high level of confidence, overload of it, too much of it. Maximum value, off the charts. Value interval illustrations Confidence and Composure that is hitting a full scale, showing a very high level of confidence. Confidence and Composure that is in full, hitting the end of the. Confidence and Composure that is in full, hitting the end of the scale, showing an extremely high level of confidence, overload of it, too much of it. Maximum value, off the charts
Free with trial Confidence and Self-Esteem Meter that is in full, hitting the end of the scale, showing an extremely high level of confidence, overload of it, too much of it. Maximum value, off the charts. Value interval illustrations Confidence and Self-Esteem Meter that is hitting a full scale, showing a very high level of confidence. Confidence and Self-Esteem Meter that is in full, hitting. Confidence and Self-Esteem Meter that is in full, hitting the end of the scale, showing an extremely high level of confidence, overload of it, too much of it. Maximum value, off the charts
Free with trial Confidence and Boldness that is in full, hitting the end of the scale, showing an extremely high level of confidence, overload of it, too much of it. Maximum value, off the charts. Value interval illustrations Confidence and Boldness that is hitting a full scale, showing a very high level of confidence. Confidence and Boldness that is in full, hitting the end of the. Confidence and Boldness that is in full, hitting the end of the scale, showing an extremely high level of confidence, overload of it, too much of it. Maximum value, off the charts
Free with trial Golden liquid slowly flowing through a transparent hourglass represents business patience, timing, and strategic decisions. Value interval illustrations A glowing amber hourglass in a dark space, symbolizing time, value, and patience in strategic planning. Golden liquid slowly flowing through a transparent. Golden liquid slowly flowing through a transparent hourglass represents business patience, timing, and strategic decisions
Free with trial Elegant hourglass with golden sand flowing. Timekeeper in vintage setting. Luxury, antique aesthetic. Sand grains flow passing time. Beautiful design old-fashioned. Represents value of. Value interval illustrations Elegant hourglass with golden sand flowing. Timekeeper in vintage setting. Luxury, antique aesthetic. Sand grains flow passing. Time. Beautiful design old. Elegant hourglass with golden sand flowing. Timekeeper in vintage setting. Luxury, antique aesthetic. Sand grains flow passing time. Beautiful design old-fashioned. Represents value of.
Free with trial Time to peak on white paper. Background. Value interval illustrations Time to peak on white paper. Background
Free with trial Correlation on white paper. Background. Value interval illustrations Correlation on white paper. Background
Free with trial Statistical significance as results for hypothesis testing outline diagram. Labeled educational scheme with significant data and random noise comparison to understand research vector illustration. Value interval vectors Statistical significance as results for hypothesis testing outline diagram. Labeled educational scheme with significant data and random noise comparison to
Free with trial Price Range Icons. Line and Glyph Vector Icons. Interval Between the Minimum and Maximum Prices of Similar Products or Services. Price Concept. Value interval vectors Price Range Icons. Line and Glyph Vector Icons. Interval Between the Minimum and Maximum Prices of Similar Products or Services. Price Concept
Free with trial Colored Price Range Icon. Vector Icon. Interval Between the Minimum and Maximum Prices of Similar Products or Services. Price Concept. Value interval vectors Colored Price Range Icon. Vector Icon. Interval Between the Minimum and Maximum Prices of Similar Products or Services. Price Concept
Free with trial Timely under magnifier glass on white. Background. Value interval illustrations Timely under magnifier glass on white. Background
Free with trial Statistics with magnifier glass on white. Background. Value interval illustrations Statistics with magnifier glass on white. Background
Free with trial This graphic displays a horizontal dotted line with arrows at both ends, signifying a measurement. The number '10m' is prominently placed above the center of the line, indicating a distance of ten meters. The overall aesthetic is clean and minimalist, with a dark blue color palette against a white background, making it suitable for technical diagrams or informational graphics. Value interval vectors A dotted line indicates a distance measurement of ten meters. This graphic displays a horizontal dotted line with arrows at both ends, signifying a measurement. This graphic displays a horizontal dotted line with arrows at both ends, signifying a measurement. The number '10m' is prominently placed above the center of the line, indicating a distance of ten meters. The overall aesthetic is clean and minimalist, with a dark blue color palette against a white background, making it suitable for technical diagrams or informational graphics
Free with trial Timer thirty minutes. Bold 30 minutes. Vector clock graphic. Green time circle. Manual vector only. No autotrace used. EPS 10. Value interval vectors Timer thirty minutes. Bold 30 minutes. Vector clock graphic. Green time circle. Manual vector only. No autotrace used. EPS 10
Free with trial A clear glass hourglass, filled with fine white sand, is placed on a textured, stone-like surface. The upper bulb of the hourglass contains a significant amount of sand, while the lower bulb has a smaller accumulation, indicating the passage of time. The background is a soft, blurred expanse of lush green foliage, creating a natural and serene atmosphere. This image evokes concepts of time, measurement, patience, and the ephemeral nature of moments. It is suitable for use in contexts related to deadlines, history, natural processes, or the value of time. Value interval illustrations Hourglass with White Sand on a Textured Surface with Blurred Green Background. A clear glass hourglass, filled with fine white sand, is placed on a textured. A clear glass hourglass, filled with fine white sand, is placed on a textured, stone-like surface. The upper bulb of the hourglass contains a significant amount of sand, while the lower bulb has a smaller accumulation, indicating the passage of time. The background is a soft, blurred expanse of lush green foliage, creating a natural and serene atmosphere. This image evokes concepts of time, measurement, patience, and the ephemeral nature of moments. It is suitable for use in contexts related to deadlines, history, natural processes, or the value of time.
 Sign in