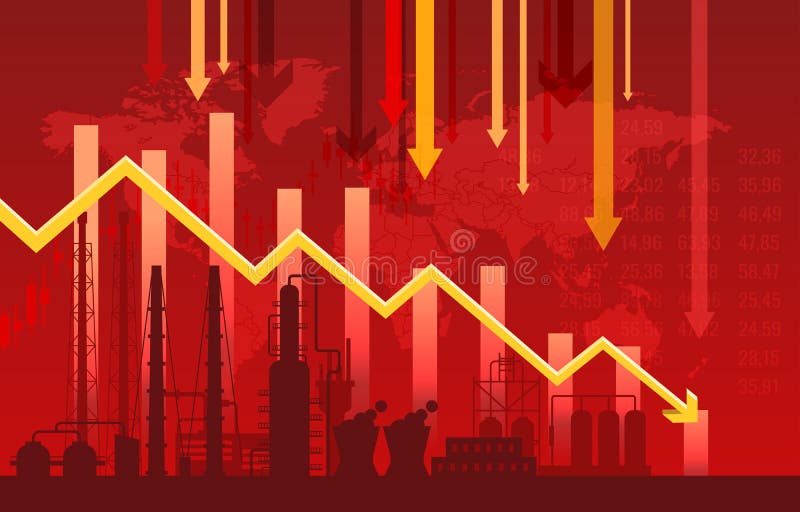
Free with trial Vector illustration Oil price decrease. Petroleum industry. Economic crisis. Drop prices to negative value. Low cost. Storage. Market crash. WTI West Texas Intermediate. Falling global oil demand. Value price decrease vectors Oil Economic Crisis Drop prices falls down WTI. Vector illustration Oil price decrease. Petroleum industry. Economic crisis. Drop prices to negative value. Low cost. Storage. Market crash. WTI West Texas Intermediate. Falling global oil demand
Free with trial Computer screen showing a list of prices and market caps of several cryptocurrencies. Camera pointed to the left. Light gray background version. Value price decrease illustrations Computer screen with list of cryptocurrency exchange rates. Computer screen showing a list of prices and market caps of several cryptocurrencies. Camera pointed to the left. Light gray background version.
Free with trial 3d render of computer keyboard with euro and dollar button. Forex currency pairs concept. Value price decrease illustrations 3d render of computer keyboard with euro and dollar button
Free with trial Bitcoin Fall. Cryptocurrency decline graph in flat style. Web money price crash, red sales arrow down vector Illustration. Value price decrease vectors Bitcoin Fall. Cryptocurrency decline graph in flat style.
Free with trial Bitcoin Fall. Cryptocurrency decline graph in flat style. Web money price crash, red sales arrow down vector Illustration. Value price decrease vectors Bitcoin Fall. Cryptocurrency decline graph in flat style.
Free with trial Bitcoin Fall. Cryptocurrency decline graph in flat style. Web money price crash, red sales arrow down vector Illustration. Value price decrease vectors Bitcoin Fall. Cryptocurrency decline graph in flat style.
Free with trial Bitcoin Fall. Cryptocurrency decline graph in flat style. Web money price crash, red sales arrow down vector Illustration. Value price decrease vectors Bitcoin Fall. Cryptocurrency decline graph in flat style.
Free with trial Bitcoin symbol with arrow up and down rounded black vector icons, cost reduction and raising, cryptocurrency price icon. Value price decrease vectors Bitcoin symbol with arrow up and down rounded black vector icons, cost reduction and raising, cryptocurrency price icon
Free with trial This stock image showcases a trading chart and candlesticks that represent a rising uptrend in the stock market. The candlesticks represent the price movements of a particular stock, and the chart shows the overall trend over a specific period of time. The high-quality production values of this stock image make it an ideal asset for a wide range of projects related to stock market trends, financial news, or investment advice. Value price decrease illustrations Stock market or trading chart and candlesticks showing a rising uptrend. This stock image showcases a trading chart and candlesticks that represent a rising uptrend in the stock market. The candlesticks represent the price movements of a particular stock, and the chart shows the overall trend over a specific period of time. The high-quality production values of this stock image make it an ideal asset for a wide range of projects related to stock market trends, financial news, or investment advice.
Free with trial This stock image showcases a trading chart and candlesticks that represent a rising uptrend in the stock market. The candlesticks represent the price movements of a particular stock, and the chart shows the overall trend over a specific period of time. The high-quality production values of this stock image make it an ideal asset for a wide range of projects related to stock market trends, financial news, or investment advice. Value price decrease illustrations Stock market or trading chart and candlesticks showing a rising uptrend. This stock image showcases a trading chart and candlesticks that represent a rising uptrend in the stock market. The candlesticks represent the price movements of a particular stock, and the chart shows the overall trend over a specific period of time. The high-quality production values of this stock image make it an ideal asset for a wide range of projects related to stock market trends, financial news, or investment advice.
Free with trial This stock image showcases a trading chart and candlesticks that represent a rising uptrend in the stock market. The candlesticks represent the price movements of a particular stock, and the chart shows the overall trend over a specific period of time. The high-quality production values of this stock image make it an ideal asset for a wide range of projects related to stock market trends, financial news, or investment advice. Value price decrease illustrations Stock market or trading chart and candlesticks showing a rising uptrend. This stock image showcases a trading chart and candlesticks that represent a rising uptrend in the stock market. The candlesticks represent the price movements of a particular stock, and the chart shows the overall trend over a specific period of time. The high-quality production values of this stock image make it an ideal asset for a wide range of projects related to stock market trends, financial news, or investment advice.
Free with trial This stock image showcases a trading chart and candlesticks that represent a rising uptrend in the stock market. The candlesticks represent the price movements of a particular stock, and the chart shows the overall trend over a specific period of time. The high-quality production values of this stock image make it an ideal asset for a wide range of projects related to stock market trends, financial news, or investment advice. Value price decrease illustrations Stock market or trading chart and candlesticks showing a rising uptrend. This stock image showcases a trading chart and candlesticks that represent a rising uptrend in the stock market. The candlesticks represent the price movements of a particular stock, and the chart shows the overall trend over a specific period of time. The high-quality production values of this stock image make it an ideal asset for a wide range of projects related to stock market trends, financial news, or investment advice.
Free with trial Bonus colorful speech bubble illustration isolated on white background. Value price decrease illustrations Bonus
Free with trial 3d man balancing on the arrow. 3d render. Value price decrease illustrations 3d man balancing on the arrow.
Free with trial Bitcoin currency decline concept as illustration. Value price decrease vectors Bitcoin currency decline concept as illustration
Free with trial Dollar crash sign, currency inflation symbol on white background. Value price decrease vectors Dollar crash sign, currency inflation symbol
Free with trial Growing and dropping golden percent symbols. Vector illustration. Value price decrease vectors Golden percent symbols. Vector illustration
Free with trial Stock market concept , stock market crisis. Value price decrease illustrations Stock market concept
Free with trial Stock market concept , stock market crisis. Value price decrease illustrations Stock market concept
Free with trial Stock market down. Financial crisis concept. Stock prices are falling. Vector Illustration. Value price decrease vectors Stock market down. Financial crisis concept. Vector Illustration. Stock market down. Financial crisis concept. Stock prices are falling. Vector Illustration
Free with trial 3D illustration with a SALE sign. Value price decrease illustrations $ALE. 3D illustration with a SALE sign
Free with trial Three dimensional illustration of colorful 50% badges or buttons; isolated on white background. Value price decrease illustrations 50 percent reduction. Three dimensional illustration of colorful 50% badges or buttons; isolated on white background.
Free with trial Dollar Roll illustrations clip-art vector eps. Value price decrease vectors Dollar Roll
Free with trial Mouse pinching money as symbol for currency devaluation. Value price decrease illustrations Inflation and Deflation. Mouse pinching money as symbol for currency devaluation
Free with trial Ten percentage off - red and yellow label with text space and rate sign, sale concept. Value price decrease illustrations Ten percentage off label with text space. Ten percentage off - red and yellow label with text space and rate sign, sale concept
Free with trial Road marking painted on an asphalt street that says 25% OFF SALE! with an arrow above it pointing forward. Value price decrease illustrations 25% off sale road markings. Road marking painted on an asphalt street that says 25% OFF SALE! with an arrow above it pointing forward.
Free with trial Thirty percentage off - red and yellow label with text space and rate sign, sale concept. Value price decrease illustrations Thirty percentage off label with text space. Thirty percentage off - red and yellow label with text space and rate sign, sale concept
Free with trial Twenty percentage off - red and yellow label with text space and rate sign, sale concept. Value price decrease illustrations Twenty percentage off label with text space. Twenty percentage off - red and yellow label with text space and rate sign, sale concept
Free with trial Special bonus button on white background. Value price decrease illustrations Special bonus button
Free with trial Sale with red percentage numbers. Value price decrease illustrations Sale sign. Sale with red percentage numbers
Free with trial Sale with glowing percentage numbers. Value price decrease illustrations Sale sign. Sale with glowing percentage numbers
Free with trial Extra bonus - 3d red banner with white text and yellow dollars symbols, business concept. Value price decrease illustrations Extra bonus red banner with dollars signs. Extra bonus - 3d red banner with white text and yellow dollars symbols, business concept
Free with trial 3d man holding two arrows with opposite directions. 3d render. Value price decrease illustrations 3d man holding two arrows with opposite directions.
Free with trial Autumn sale and offer - orange labels with text and fall leaf, business concept. Value price decrease illustrations Autumn sale and offer labels with fall leaf. Autumn sale and offer - orange labels with text and fall leaf, business concept
Free with trial Silver prices falling down concept illustration design over a white background. Value price decrease illustrations Silver prices falling down concept
Free with trial Bitcoin failing graph crypto currency. Coin B symbol finance economy banking system. Blockchain extra crash with lightning negative forecast for decline in value vector illustration. Value price decrease vectors Bitcoin failing graph crypto currency. Coin B symbol finance economy banking system. Blockchain extra crash with. Lightning negative forecast for decline in. Bitcoin failing graph crypto currency. Coin B symbol finance economy banking system. Blockchain extra crash with lightning negative forecast for decline in value vector illustration.
Free with trial Falling silver prices illustration background. Value price decrease vectors Falling silver prices illustration
Free with trial Tax concept and losing profits to taxes or market correction and capital loss and taxable income as a business concept with 3D illustration elements. Value price decrease illustrations Tax Concept
Free with trial Growing and dropping percent symbols and magnifying glass. Vector illustration. Value price decrease vectors Growing and dropping percent symbols
Free with trial Bitcoin. Already at bottom? Abstract template with a BTC symbol at depth. Vector. Value price decrease vectors Abstract template with a bitcoin symbol at depth. Vector. Bitcoin. Already at bottom? Abstract template with a BTC symbol at depth. Vector
Free with trial Money and currency icon set,flat style,vector and illustration. Value price decrease vectors Money and currency icon set
Free with trial Money and currency icon set,filled outline style,vector and illustration. Value price decrease vectors Money and currency icon set
Free with trial Realistic gold Bitcoin sign encapsulated in transparent soap bubble for business, financial, banking and web projects and designs. Symbol of burst or crash cryptocurrency blockchain concept. Vector illustration. Value price decrease illustrations Realistic gold Bitcoin sign encapsulated in transparent soap bubble
Free with trial Glowing bitcoin coin in miner's hand. Flat cartoon illustration. Value price decrease vectors Glowing bitcoin coin in miner's hand. Flat cartoon illustration
Free with trial 3d render closeup of computer keyboard with bear and S&P 500 index button. Stock market indexes concept. Value price decrease illustrations 3d render of computer keyboard with bear and S&P 500 index. 3d render closeup of computer keyboard with bear and S&P 500 index button. Stock market indexes concept.
Free with trial 3D red illustration with shadow of 40% in red and Discount in white on the red base underneath, isolated on a white background. Value price decrease illustrations 40% discount. 3D red illustration with shadow of 40% in red and Discount in white on the red base underneath, isolated on a white background.
Free with trial Concept of Bitcoin bubble and speculation. Risks and dangers of investing to Bitcoin. Financial bubble. Flat cartoon illustration. Value price decrease illustrations Concept of Bitcoin bubble and speculation.Risks and dangers of investing to Bitcoin. Financial bubble
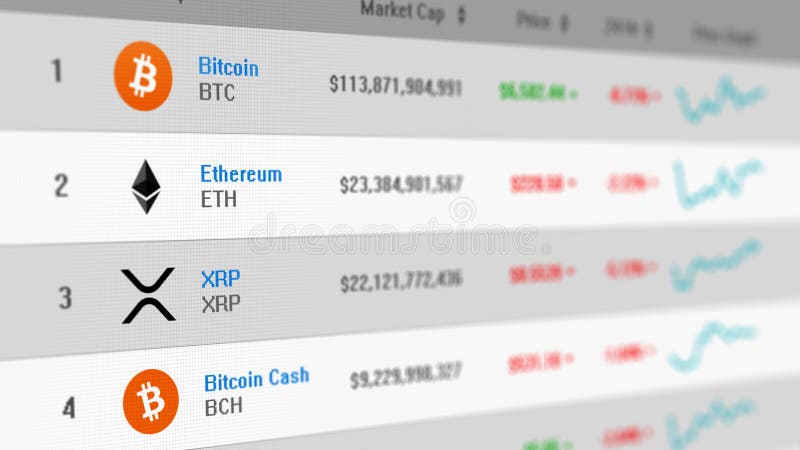
Free with trial Computer screen showing a list of prices and market caps of several cryptocurrencies. Top down view. Light gray background version. Value price decrease illustrations Computer screen with list of cryptocurrency exchange rates. Computer screen showing a list of prices and market caps of several cryptocurrencies. Top down view. Light gray background version.
Free with trial Dropping graphic arrow. Profit reduction schedule, financial debt graph and income loss 3D arrow vector illustration. Business downturn, company income decline. Decreasing stock market trend forecast. Value price decrease vectors Dropping graphic arrow. Profit reduction schedule, financial debt graph and income loss 3D arrow vector illustration
Free with trial Bit coin on abstract background with downward arrows. Cryptocurrnecy and failure concept. 3D Rendering. Value price decrease illustrations Cryptocurrency and failure concept. Bit coin on abstract background with downward arrows. Cryptocurrnecy and failure concept. 3D Rendering
Free with trial 3d render closeup of computer keyboard with bear and NIKKEI 225 index button. Stock market indexes concept. Value price decrease illustrations 3d render of computer keyboard with bear and NIKKEI 225 index b. 3d render closeup of computer keyboard with bear and NIKKEI 225 index button. Stock market indexes concept.
Free with trial 3d render closeup of computer keyboard with FTSE 100 index button. Stock market indexes concept. Value price decrease illustrations 3d render of computer keyboard with FTSE 100 index button. 3d render closeup of computer keyboard with FTSE 100 index button. Stock market indexes concept.
Free with trial 3d render of keyboard with natural gas button. Stock market concept. Value price decrease illustrations 3d render of keyboard with natural gas button
Free with trial Computer screen showing a list of prices and market caps of several cryptocurrencies. Camera pointed to the right. Light gray background version. Value price decrease illustrations Computer screen with list of cryptocurrency exchange rates. Computer screen showing a list of prices and market caps of several cryptocurrencies. Camera pointed to the right. Light gray background version.
Free with trial Editable line icon of infographic stick figure person in a corporate design style wearing a suit with tie in full body length view in modern black lines on a clean and white background as a eps and vector. Value price decrease vectors Editable real line icon of a stick figure businessman with a negative chart. Editable line icon of infographic stick figure person in a corporate design style wearing a suit with tie in full body length view in modern black lines on a clean and white background as a eps and vector
Free with trial 3d render of keyboard with natural gas button. Stock market concept. Value price decrease illustrations 3d render of keyboard with natural gas button
Free with trial Oil barrels on Decline chart diagram background vector illustration. Value price decrease vectors Oil barrels on Decline chart diagram background
Free with trial 3d render closeup of computer keyboard with CAC 40 index button. Stock market indexes concept. Value price decrease illustrations 3d render of computer keyboard with CAC 40 index button. 3d render closeup of computer keyboard with CAC 40 index button. Stock market indexes concept.
Free with trial Graph down. Black Icon graph decline with arrow isolated on white background. Hologram statistic. Deficit direction for business concept design. Analysis information forecast. Vector illustration. Value price decrease vectors Graph down. Black Icon graph decline with arrow isolated on white background. Hologram deficit direction for business design. Graph down. Black Icon graph decline with arrow isolated on white background. Hologram statistic. Deficit direction for business concept design. Analysis information forecast. Vector illustration
Free with trial 3d render of computer keyboard with pound and dollar button. Forex currency pairs concept. Value price decrease illustrations 3d render of computer keyboard with pound and dollar button
Free with trial Coin cryptocurrency Tron and skeletonon a background chart. Value price decrease illustrations Coin cryptocurrency TRX and skeletonon a background chart.
Free with trial Cost button on dark background. 3D illustration. Value price decrease illustrations Cost button on dark background. 3D illustration
Free with trial Oil barrels on Decline chart diagram with black down arrow vector illustration background. Value price decrease vectors Oil barrels on Decline chart diagram with black down arrow
Free with trial Pricing word block on white background. Value price decrease illustrations Pricing word block
Free with trial Margin call button on white background. Value price decrease illustrations Margin call button on white
Free with trial Graph down. Black icon graph decline with arrow isolated on white background. Hologram statistic. Deficit direction for business concept design. Analysis information forecast. Vector illustration. Value price decrease vectors Graph down. Black icon graph decline with arrow. Hologram statistic. Deficit direction business. Analysis information forecast. Graph down. Black icon graph decline with arrow isolated on white background. Hologram statistic. Deficit direction for business concept design. Analysis information forecast. Vector illustration
Free with trial Extra bonus button on white background. Value price decrease illustrations Extra bonus button on white
Free with trial Discount word blocks on white background. Value price decrease illustrations Discount word blocks on white
Free with trial Illustration drawing of a money plant logo with isolated background. Value price decrease vectors Money plant logo
Free with trial 3d render of computer keyboard with MARGIN CALL button. Stock market subjects. Value price decrease illustrations 3d render of computer keyboard with MARGIN CALL button
Free with trial Coin cryptocurrency Cardano and skeletonon a background chart. Ada. Value price decrease illustrations Coin cryptocurrency ADA and skeletonon a background chart. Coin cryptocurrency Cardano and skeletonon a background chart. Ada.
Free with trial Forecast of reduce with linear bag. concept of sharp drop in revenues and no wealth or banking service. flat stroke simple moneybag logotype graphic lineart design art isolated on white background. Value price decrease vectors Forecast of reduce with linear bag
Free with trial 3d render closeup of computer keyboard with CAC 40 index button. Stock market indexes concept. Value price decrease illustrations 3d render of computer keyboard with CAC 40 index button. 3d render closeup of computer keyboard with CAC 40 index button. Stock market indexes concept.
Free with trial Accumulated depreciation word block on white background. Value price decrease illustrations Accumulated depreciation word block on white
Free with trial Cost optimization concept. Laptop with graph and diagram windows on the screen. Analyzing statistical charts and graphs. Data analysis for business finance investment. Web vector illustration in 3D style. Value price decrease vectors Cost optimization illustration in 3D style. Cost optimization concept. Laptop with graph and diagram windows on the screen. Analyzing statistical charts and graphs. Data analysis for business finance investment. Web vector illustration in 3D style
Free with trial Vector of a young family withstanding real estate market and economic crisis. Value price decrease illustrations Vector of a family withstanding real estate market and economic crisis
Free with trial Turkish Lira textured bars and falling arrow. 3D illustration. Value price decrease illustrations Turkish Lira textured bars and falling arrow. 3D illustration
Free with trial 3d render of keyboard with options button. The concept of investing in the stock market. Value price decrease illustrations 3d render of keyboard with options button
Free with trial Cost of goods sold on blue background. Value price decrease illustrations Cost of goods sold on blue