Free with trial Three green arrows with white percent symbols pointing downward, representing concept of interest rate decrease or sale discount. Value price decrease illustrations Three green percentage arrows pointing down isolated on white background indicating reduction. Three green arrows with white percent symbols pointing downward, representing concept of interest rate decrease or sale discount
Free with trial A stylized depiction of a commodity barrel with coins being deposited and downward arrows, representing a decrease in value or a negative financial trend. Value price decrease illustrations Conceptual illustration of declining commodity prices with a barrel coins and downward trending indicators symbolizing economic. A stylized depiction of a commodity barrel with coins being deposited and downward arrows, representing a decrease in value or a negative financial trend
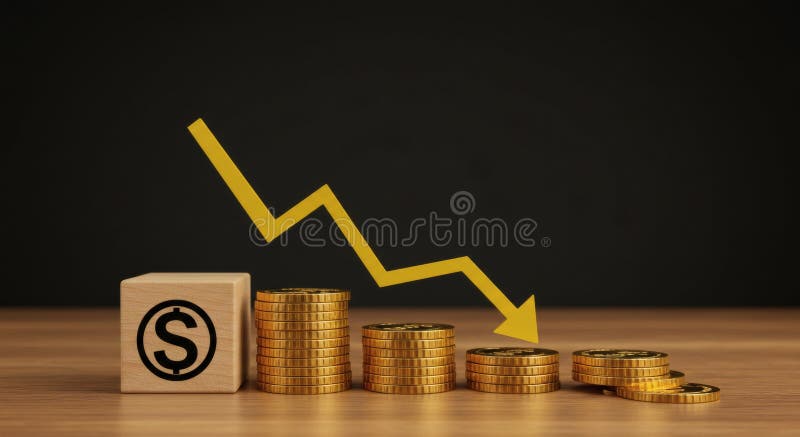
Free with trial A bear market, such as stocks or cryptocurrencies, that is in a downtrend , which creates a huge disaster for investors. It is suitable to use the image in articles analyzing various price trends. Value price decrease illustrations A bear market, such as stocks or cryptocurrencies, that is in a downtrend , which creates a huge disaster for investors. It is
Free with trial Close up of a business professional in a blue suit presenting a digital graphic with arrows showing increase in quality and decrease in cost with percentage signs for business efficiency financial planning and effective strategies. Value price decrease illustrations Hand presenting digital arrows pointing up for quality and down for cost in business strategy concept. Close up of a business professional in a blue suit presenting a digital graphic with arrows showing increase in quality and decrease in cost with percentage signs for business efficiency financial planning and effective strategies
Free with trial This image depicts a small white house encircled by gold coins, with a white arrow pointing down towards it. It visually represents a decline in property values or a challenging real estate market. high-quality professional detailed modern elegant stylish clean. Value price decrease illustrations A miniature house surrounded by coins with an arrow pointing downwards symbolizing decreasing value. This image depicts a small white house encircled by gold coins, with a white arrow pointing down towards it. It visually represents a decline in property values or a challenging real estate market. high-quality professional detailed modern elegant stylish clean
Free with trial Dynamic grid of fluctuating stock prices and financial data with columns and rows showing the volatile market changes in green and red creating a high-tech abstract visualization. Value price decrease illustrations Abstract data visualization of stock market prices and financial data in rows and columns with price changes in green and red. Dynamic grid of fluctuating stock prices and financial data with columns and rows showing the volatile market changes in green and red creating a high-tech abstract visualization
Free with trial Pound sterling coin with red arrow pointing down, symbol of financial crisis, currency decrease, recession, and economic trouble. Value price decrease vectors Falling pound sterling coin with downward arrow indicating financial loss and currency depreciation illustration. Pound sterling coin with red arrow pointing. Pound sterling coin with red arrow pointing down, symbol of financial crisis, currency decrease, recession, and economic trouble
Free with trial A stark image of '7%' in black against a white backdrop, representing a financial percentage, possibly indicating a discount, interest rate, or statistical value. Value price decrease vectors Vector art of, a bold black 7 with a subtle shadow, symbolizing a percentage or discount rate in a financial or promotional. A stark image of '7%' in black against a white backdrop, representing a financial percentage, possibly indicating a discount, interest rate, or statistical value
Free with trial A close-up shot of a screen displaying a red financial graph with declining trends, indicating a bearish stock market. The chart shows decreasing value, suggesting potential losses and market downturn. Value price decrease illustrations Red Financial Graph Displaying Stock Market Decline and Bearish Trading Trends on a Screen. A close-up shot of a screen displaying a red financial graph with declining trends, indicating a bearish stock market. The chart shows decreasing value, suggesting potential losses and market downturn
Free with trial Golden bitcoin coin rests on wooden surface. Blurred red downward crypto chart in background. Digital currency investment risk, market loss financial volatility and value decrease. Value price decrease illustrations Golden bitcoin coin rests on wooden surface. Blurred red downward crypto chart in background. Digital currency investment risk
Free with trial Reduce labor costs icon logo sign vector outline in black and white color. Value price decrease vectors Labor Cost Reduction Icons for Worker Pay Salary and Wage Income Decrease. Reduce labor costs icon logo sign vector outline in black and white color
Free with trial Red 3D Percentage Symbol With Arrow Pointing Down. Price reduction percentage sign in red. Vector Illustrator. Value price decrease vectors Red 3D Percentage Symbol With Arrow Pointing Down. Vector Illustrator. Red 3D Percentage Symbol With Arrow Pointing Down. Price reduction percentage sign in red. Vector Illustrator.
Free with trial A sharp, glossy blue arrow shape pointing right, emblazoned with the bold white text REDUCTION, signifying a decrease or cutback. Value price decrease illustrations Glossy blue arrow shape with the word reduction. A sharp, glossy blue arrow shape pointing right, emblazoned with the bold white text REDUCTION, signifying a decrease or cutback
Free with trial Gold bars on graph and arrow down, fall, chart gold with increase and decrease, gold profit and loss concept. Value price decrease vectors Gold bars on graph and arrow down, fall, chart gold with increase and decrease, gold profit and loss concept
Free with trial A vibrant red arrow points downward, resting on a silver coin, signifying a market decline. This 3D rendering, generated by AI, visually represents economic downturn or price reduction. Use it to illustrate concepts related to financial loss, market trends, and economic instability. Value price decrease illustrations Falling Prices. A vibrant red arrow points downward, resting on a silver coin, signifying a market decline. This 3D rendering, generated by AI, visually represents economic downturn or price reduction. Use it to illustrate concepts related to financial loss, market trends, and economic instability.
Free with trial A dynamic 3D illustration of a glossy red arrow pointing downwards in a jagged, volatile path. Isolated on a white background, this graphic icon is a powerful symbol for negative concepts. It represents decline, decrease, failure, loss, and crisis. This visual is perfect for illustrating stock market crashes, economic recession, financial downturns, poor business performance, or any downward trend in data and statistics. An ideal element for reports, presentations, and financial news, with ample copy space. Value price decrease illustrations Red Jagged Arrow of Decline - Financial Crisis Concept. A dynamic 3D illustration of a glossy red arrow pointing downwards in a jagged, volatile path. Isolated on a white background, this graphic icon is a powerful symbol for negative concepts. It represents decline, decrease, failure, loss, and crisis. This visual is perfect for illustrating stock market crashes, economic recession, financial downturns, poor business performance, or any downward trend in data and statistics. An ideal element for reports, presentations, and financial news, with ample copy space.
Free with trial Black and white icon depicting a downward arrow and a dollar symbol inside a speech bubble, positioned above an oil barrel with a droplet symbol. The design conveys a decrease in oil prices, using simple, bold lines for clear interpretation. Value price decrease vectors World Crude Oil Prices Down. Black and white icon depicting a downward arrow and a dollar symbol inside a speech bubble, positioned above an oil barrel with a droplet symbol. The design conveys a decrease in oil prices, using simple, bold lines for clear interpretation.
Free with trial A red price tag prominently displaying a "50% off" discount, representing sales, special offers, and significant price reductions for shopping and promotions. Value price decrease illustrations Bold red fifty percent off tag. A red price tag prominently displaying a "50% off" discount, representing sales, special offers, and significant price reductions for shopping and promotions
Free with trial Simple vector icon representing the concept of rising inflation affecting the value of money. Value price decrease illustrations Dollar banknote showing money inflation icon. Simple vector icon representing the concept of rising inflation affecting the value of money
Free with trial A visual representation of a financial downturn or a reduction in rates. A golden coin with a percentage sign is shown with a downward arrow, symbolizing a decrease, recession, or a sale promotion. Value price decrease vectors Financial Percentage Drop Symbol. A visual representation of a financial downturn or a reduction in rates. A golden coin with a percentage sign is shown with a downward arrow, symbolizing a decrease, recession, or a sale promotion
Free with trial Cost on wooden cube from stack block with rise arrow, Real estate property investment concept. Asset management, Interest rates, inflation, loan mortgage, decrease tax. 3d render. Value price decrease illustrations Cost on wooden cube from stack block with rise arrow
Free with trial A minimalist vector icon representing a downturn in the housing market. Value price decrease vectors Real Estate Price Reduction Symbol. A minimalist vector icon representing a downturn in the housing market
Free with trial Stacked coins decline under a red, jagged arrow. Coins decrease in quantity from left to right against a neutral background. Image. Value price decrease illustrations Coin Stacks with Declining Red Arrow. Stacked coins decline under a red, jagged arrow. Coins decrease in quantity from left to right against a neutral background. Image
Free with trial A minimalist vector icon representing a house with a prominent downward arrow. Value price decrease vectors Real Estate Market Decrease Vector Icon. A minimalist vector icon representing a house with a prominent downward arrow
Free with trial Economic crisis icon of economy depreciation and business downturn, vector line symbol. Banking investment recession, stock exchange trade fall and money value inflation icon of financial crisis. Value price decrease vectors Economic crisis icon economy business depreciation. Economic crisis icon of economy depreciation and business downturn, vector line symbol. Banking investment recession, stock exchange trade fall and money value inflation icon of financial crisis
Free with trial Abstract financial graph with a candlestick chart and a large downward arrow on a dark background with a world map. This image represents a stock market crash, bearish trend, and global economic crisis. The red and blue candles illustrate market volatility and a significant price drop. It's a powerful visual concept for topics like financial recession, investment risk, economic downturn, and business failure. Ideal for financial news, reports, presentations, and web design related to finance, trading, and the global economy. Value price decrease illustrations Global Stock Market Crash and Bearish Trend. Abstract financial graph with a candlestick chart and a large downward arrow on a dark background with a world map. This image represents a stock market crash, bearish trend, and global economic crisis. The red and blue candles illustrate market volatility and a significant price drop. It's a powerful visual concept for topics like financial recession, investment risk, economic downturn, and business failure. Ideal for financial news, reports, presentations, and web design related to finance, trading, and the global economy.
Free with trial Image depicting a downward trend in currency value, symbolized by stacks of gold coins and a falling arrow. Value price decrease illustrations Declining Dollar: Economic Downturn Visualized. Image depicting a downward trend in currency value, symbolized by stacks of gold coins and a falling arrow
Free with trial Reduce inflation concept by increase interest rate. Man Hand using needle to burst inflation balloon with price tag. Value price decrease vectors Reduce inflation concept by increase interest rate
Free with trial Minimalist style illustration of a hand presenting a coin with a downward arrow, representing financial loss, investment decrease, or economic downturn. Simple, clean design suitable for various business and financial related applications. Value price decrease vectors Bold Line Hand Holding Coin with Down Arrow Financial Icon. Minimalist style illustration of a hand presenting a coin with a downward arrow, representing financial loss, investment decrease, or economic downturn. Simple, clean design suitable for various business and financial related applications.
Free with trial A Vector Dollar Up Icon Symbol represents an increase in value, price, or positive movement in financial markets, often associated with economic growth or profit. This symbol is commonly used in financial contexts to indicate a rise in currency value or favorable trends. Value price decrease vectors Vector Dollar Up Icon Symbol
Free with trial A bright red arrow points directly downwards towards a single gold coin embossed with a dollar sign. The coin is depicted as a shiny, metallic disc. Both the arrow and the coin are rendered in 3D and are presented on a clean white background, creating a clear visual representation of a financial decrease or cost reduction. Value price decrease illustrations Red Downward Arrow Pointing Towards a Gold Dollar Coin on White Background money currency. A bright red arrow points directly downwards towards a single gold coin embossed with a dollar sign. The coin is depicted as a shiny, metallic disc. Both the arrow and the coin are rendered in 3D and are presented on a clean white background, creating a clear visual representation of a financial decrease or cost reduction
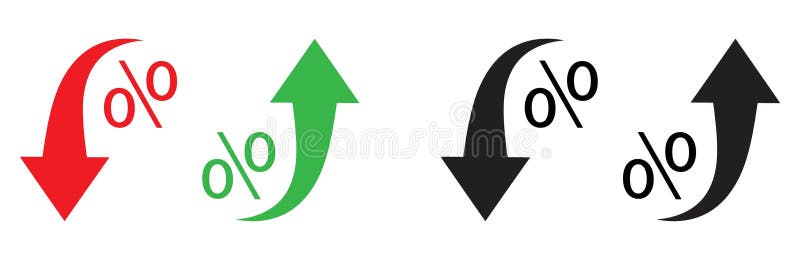
Free with trial Red and black arrows point downward, while green and black arrows point upward. Each arrow is curved, paired with a percentage symbol (%), indicating changes in rate or value. The red and black arrows denote decrease, and the green and black arrows denote increase, suggesting economic or statistical trends. The arrows and symbols are bold and stylized for emphasis. Value price decrease vectors Percent arrow icon. Growth, increase, decrease arrow filled icons. Up arrows, down arrows. Red and black arrows point downward, while green and black arrows point upward. Each arrow is curved, paired with a percentage symbol (%), indicating changes in rate or value. The red and black arrows denote decrease, and the green and black arrows denote increase, suggesting economic or statistical trends. The arrows and symbols are bold and stylized for emphasis.
Free with trial The "Vector Dollar Down Icon Symbol" is a graphical representation designed to indicate a decrease or downward trend related to financial aspects, specifically involving currency or value. Value price decrease vectors Vector Dollar Down Icon Symbol
Free with trial A Vector Dollar Down Icon Symbol represents a decline in value or price, commonly associated with financial markets or economic trends. It is designed to visually convey a drop in currency value or downward movement related to money. Value price decrease vectors Vector Dollar Down Icon Symbol
Free with trial Stock market chart showing a downward trend with red and green candlesticks indicating price fluctuations. A moving average line overlays the candlesticks. Volume bars at the bottom correlate with trading activity, mostly red, suggesting higher selling pressure. Vertical axis shows price levels, and horizontal axis depicts time. The chart originates from Cendlewe (Bearits). Candlestick shapes and colors represent price movements over time, with red indicating a decrease and green an increase. Value price decrease illustrations Dynamic stock market chart shows downward trend with red and green candlesticks and volume bars. Stock market chart showing a downward trend with red and green candlesticks indicating price fluctuations. A moving average line overlays the candlesticks. Volume bars at the bottom correlate with trading activity, mostly red, suggesting higher selling pressure. Vertical axis shows price levels, and horizontal axis depicts time. The chart originates from Cendlewe (Bearits). Candlestick shapes and colors represent price movements over time, with red indicating a decrease and green an increase.
Free with trial A red downward trending arrow is superimposed over a stack of gold bullion bars. The bars are arranged in a pyramid formation on a white background. The red arrow extends diagonally from the top of the stack towards the bottom right, indicating a decrease or decline. Gold bars symbolize wealth or financial investment, while the arrow suggests a drop in value or market trend. Value price decrease illustrations Red downward trending arrow superimposed over a stack of gold bullion bars on a white background. A red downward trending arrow is superimposed over a stack of gold bullion bars. The bars are arranged in a pyramid formation on a white background. The red arrow extends diagonally from the top of the stack towards the bottom right, indicating a decrease or decline. Gold bars symbolize wealth or financial investment, while the arrow suggests a drop in value or market trend.
Free with trial A financial candlestick chart illustrates a positive market trend, with green and red candles indicating price movements and a smooth green line representing a moving average. Value price decrease illustrations Financial stock market candlestick chart showing upward trend with moving average line. A financial candlestick chart illustrates a positive market trend, with green and red candles indicating price movements and a smooth green line representing a moving average
Free with trial A bright red, three-dimensional arrow is positioned directly above a shiny golden coin with a dollar sign embossed on its surface. The arrow points downwards, indicating a decrease or fall. Both the arrow and the coin are rendered in a clean 3D style and are isolated against a plain white background, suggesting a financial concept. Value price decrease illustrations Red Downward Arrow Pointing Towards a Golden Dollar Coin on a White Background direction. A bright red, three-dimensional arrow is positioned directly above a shiny golden coin with a dollar sign embossed on its surface. The arrow points downwards, indicating a decrease or fall. Both the arrow and the coin are rendered in a clean 3D style and are isolated against a plain white background, suggesting a financial concept
Free with trial Inflation percent signs. Crisis or rising interest rates. Black inflatable balloons with dollar icons. 3D inflated balls fly. Economy recession. Money costs decrease. Currency exchange. Vector concept. Value price decrease vectors Inflation percent signs. Crisis or rising interest rates. Black inflatable balloons with dollar icons. 3D inflated balls fly
Free with trial A financial illustration shows coins decreasing in size along a horizontal axis, representing devaluation. An upward-pointing arrow indicates increasing inflation percentages, with labels of "4%", "20%", and "50%". The chart is labeled "INFLATION" at the top, with percentages scattered around. Broken pieces from a large coin suggest fragmentation and loss of value. The background features a subtle line graph, reinforcing the economic theme. Value price decrease illustrations Inflation increasing and devaluing money, showing a financial chart with coins and an arrow going up. A financial illustration shows coins decreasing in size along a horizontal axis, representing devaluation. An upward-pointing arrow indicates increasing inflation percentages, with labels of "4%", "20%", and "50%". The chart is labeled "INFLATION" at the top, with percentages scattered around. Broken pieces from a large coin suggest fragmentation and loss of value. The background features a subtle line graph, reinforcing the economic theme.
Free with trial Discount tag displays a percentage symbol with arrows pointing up and down indicating fluctuating prices representing sales promotions and marketing offers for retail businesses. Value price decrease illustrations Blue discount tag with percentage sign and arrows indicating price changes on white background. Discount tag displays a percentage symbol with arrows pointing up and down indicating fluctuating prices representing sales promotions and marketing offers for retail businesses
Free with trial A 3D illustration depicts a large white dollar sign centered on a vibrant purple circle. Two smaller white circles are positioned on either side of the purple circle. A green upward-pointing arrow is in the top right circle, signifying growth or increase, while a red downward-pointing arrow is in the bottom left circle, indicating decline or decrease. The composition is set against a clean white. Value price decrease illustrations 3D Dollar Sign with Up and Down Arrows Indicating Financial Growth and Decline on White Background. A 3D illustration depicts a large white dollar sign centered on a vibrant purple circle. Two smaller white circles are positioned on either side of the purple circle. A green upward-pointing arrow is in the top right circle, signifying growth or increase, while a red downward-pointing arrow is in the bottom left circle, indicating decline or decrease. The composition is set against a clean white
Free with trial 3D Hand is holding Diagram and dollar illustration. Dollar value rising. Exchange rate or financial report, economy or investment concept. Trendy and modern vector in 3d style. Value price decrease vectors 3D Hand is holding Diagram and dollar illustration. Dollar value rising. Exchange rate or financial report, economy
Free with trial A golden 10 percent off sign on a white background indicates a discount and promotional offer for shoppers. This image represents savings, reduction, and special deals, signaling a price cut or markdown on products or services. It conveys a message of affordability and incentive to buy CREATED AI. Value price decrease illustrations Golden 10 Percent Off Sign on White Background Indicating Discount and Promotional Offer for Shoppers. A golden 10 percent off sign on a white background indicates a discount and promotional offer for shoppers. This image represents savings, reduction, and special deals, signaling a price cut or markdown on products or services. It conveys a message of affordability and incentive to buy CREATED AI
Free with trial Global economic instability, market volatility, and the growing demand for energy security are represented by the combination of an oil pump jack, oil barrels, and the national flag of Sri Lanka. Value price decrease illustrations The backdrop of geopolitical challenges and economic volatility is driving the increase or decrease in Sri Lankan oil prices. Global economic instability, market volatility, and the growing demand for energy security are represented by the combination of an oil pump jack, oil barrels, and the national flag of Sri Lanka.
Free with trial Miniature house with red downward arrow. Declining house market real estate prices. Housing market recession crisis concept. Economic downturn, falling sales, decreased value financial. Value price decrease illustrations Miniature house with red downward arrow. Declining house market real estate prices. Housing market recession crisis concept.
Free with trial A vibrant orange circle graphic depicting a green speech bubble with a downward arrow and a stack of money, symbolizing financial decrease and economic downturn. Value price decrease vectors Vector art of orange circle graphic featuring a green speech bubble with a downward arrow and a stack of money with a coin. A vibrant orange circle graphic depicting a green speech bubble with a downward arrow and a stack of money, symbolizing financial decrease and economic downturn
Free with trial Generative ai, The image shows a bar chart with a red arrow pointing down, indicating a downward trend in a financial market. The glowing blue bars represent rising values, while the red arrow signifies a drop in value,. Value price decrease illustrations The image shows a blue and red graph with a red arrow pointing downwards, illustrating a decline in a company stock price. generative ai, The image shows a bar chart with a red arrow pointing down, indicating a downward trend in a financial market. The glowing blue bars represent rising values, while the red arrow signifies a drop in value,
Free with trial Generative ai, The image is of a red arrow pointing down, superimposed on a blue and red bar graph, symbolizing a downward trend, potentially indicating a financial or economic decline. Value price decrease illustrations A large red arrow points downwards over a gridded financial chart showing a sharp decline in value, with the bars of the chart. generative ai, The image is of a red arrow pointing down, superimposed on a blue and red bar graph, symbolizing a downward trend, potentially indicating a financial or economic decline
Free with trial This 3d image of a floating golden dollar coin over a falling arrow shows flying signs of financial loss value drop and market downturn in a modern clean economic concept. Value price decrease illustrations A floating dollar coin with a downward arrow represents flying financial signs of loss decline and economic downfall in 3d. this 3d image of a floating golden dollar coin over a falling arrow shows flying signs of financial loss value drop and market downturn in a modern clean economic concept
Free with trial This 3d illustration of a floating dollar coin with a flying downward arrow line represents signs of market decline loss in value and financial downturn in a visual economic concept. Value price decrease illustrations A floating dollar coin with a purple down arrow shows flying signs of financial loss and currency devaluation in 3d design. this 3d illustration of a floating dollar coin with a flying downward arrow line represents signs of market decline loss in value and financial downturn in a visual economic concept
Free with trial Golden dollar sign with red arrow pointing down. Financial crisis concept, recession chart, stock market crash symbol. Economic downturn, loss, decrease, risk, bad investment money. Value price decrease illustrations Golden dollar sign with red arrow pointing down. Financial crisis concept, recession chart, stock market crash symbol. Economic
Free with trial Shiny metallic percentage sign centered on blue financial graph background. Selective focus highlights symbol over stock market data. Represents finance, business, price, discount sale. Value price decrease illustrations Shiny metallic percentage sign centered on blue financial graph background. Selective focus highlights symbol over stock market
Free with trial A bear market, such as stocks or cryptocurrencies, that is in a downtrend , which creates a huge disaster for investors. It is suitable to use the image in articles analyzing various price trends. Value price decrease illustrations A bear market, such as stocks or cryptocurrencies, that is in a downtrend , which creates a huge disaster for investors. It is
Free with trial A bear market, such as stocks or cryptocurrencies, that is in a downtrend , which creates a huge disaster for investors. It is suitable to use the image in articles analyzing various price trends. Value price decrease illustrations A bear market, such as stocks or cryptocurrencies, that is in a downtrend , which creates a huge disaster for investors. It is
Free with trial A bear market, such as stocks or cryptocurrencies, that is in a downtrend , which creates a huge disaster for investors. It is suitable to use the image in articles analyzing various price trends. Value price decrease illustrations A bear market, such as stocks or cryptocurrencies, that is in a downtrend , which creates a huge disaster for investors. It is
Free with trial A bear market, such as stocks or cryptocurrencies, that is in a downtrend , which creates a huge disaster for investors. It is suitable to use the image in articles analyzing various price trends. Value price decrease illustrations A bear market, such as stocks or cryptocurrencies, that is in a downtrend , which creates a huge disaster for investors. It is
Free with trial A bear market, such as stocks or cryptocurrencies, that is in a downtrend , which creates a huge disaster for investors. It is suitable to use the image in articles analyzing various price trends. Value price decrease illustrations A bear market, such as stocks or cryptocurrencies, that is in a downtrend , which creates a huge disaster for investors. It is
Free with trial A bear market, such as stocks or cryptocurrencies, that is in a downtrend , which creates a huge disaster for investors. It is suitable to use the image in articles analyzing various price trends. Value price decrease illustrations A bear market, such as stocks or cryptocurrencies, that is in a downtrend , which creates a huge disaster for investors. It is
Free with trial A bear market, such as stocks or cryptocurrencies, that is in a downtrend , which creates a huge disaster for investors. It is suitable to use the image in articles analyzing various price trends. Value price decrease illustrations A bear market, such as stocks or cryptocurrencies, that is in a downtrend , which creates a huge disaster for investors. It is
Free with trial A bear market, such as stocks or cryptocurrencies, that is in a downtrend , which creates a huge disaster for investors. It is suitable to use the image in articles analyzing various price trends. Value price decrease illustrations A bear market, such as stocks or cryptocurrencies, that is in a downtrend , which creates a huge disaster for investors. It is
Free with trial A bear market, such as stocks or cryptocurrencies, that is in a downtrend , which creates a huge disaster for investors. It is suitable to use the image in articles analyzing various price trends. Value price decrease illustrations A bear market, such as stocks or cryptocurrencies, that is in a downtrend , which creates a huge disaster for investors. It is
Free with trial A bear market, such as stocks or cryptocurrencies, that is in a downtrend , which creates a huge disaster for investors. It is suitable to use the image in articles analyzing various price trends. Value price decrease illustrations A bear market, such as stocks or cryptocurrencies, that is in a downtrend , which creates a huge disaster for investors. It is
Free with trial A bear market, such as stocks or cryptocurrencies, that is in a downtrend , which creates a huge disaster for investors. It is suitable to use the image in articles analyzing various price trends. Value price decrease illustrations A bear market, such as stocks or cryptocurrencies, that is in a downtrend , which creates a huge disaster for investors. It is
Free with trial A bear market, such as stocks or cryptocurrencies, that is in a downtrend , which creates a huge disaster for investors. It is suitable to use the image in articles analyzing various price trends. Value price decrease illustrations A bear market, such as stocks or cryptocurrencies, that is in a downtrend , which creates a huge disaster for investors. It is
Free with trial A bear market, such as stocks or cryptocurrencies, that is in a downtrend , which creates a huge disaster for investors. It is suitable to use the image in articles analyzing various price trends. Value price decrease illustrations A bear market, such as stocks or cryptocurrencies, that is in a downtrend , which creates a huge disaster for investors. It is
Free with trial A bear market, such as stocks or cryptocurrencies, that is in a downtrend , which creates a huge disaster for investors. It is suitable to use the image in articles analyzing various price trends. Value price decrease illustrations A bear market, such as stocks or cryptocurrencies, that is in a downtrend , which creates a huge disaster for investors. It is
Free with trial A bear market, such as stocks or cryptocurrencies, that is in a downtrend , which creates a huge disaster for investors. It is suitable to use the image in articles analyzing various price trends. Value price decrease illustrations A bear market, such as stocks or cryptocurrencies, that is in a downtrend , which creates a huge disaster for investors. It is
Free with trial A bear market, such as stocks or cryptocurrencies, that is in a downtrend , which creates a huge disaster for investors. It is suitable to use the image in articles analyzing various price trends. Value price decrease illustrations A bear market, such as stocks or cryptocurrencies, that is in a downtrend , which creates a huge disaster for investors. It is
Free with trial A bear market, such as stocks or cryptocurrencies, that is in a downtrend , which creates a huge disaster for investors. It is suitable to use the image in articles analyzing various price trends. Value price decrease illustrations A bear market, such as stocks or cryptocurrencies, that is in a downtrend , which creates a huge disaster for investors. It is
Free with trial A bear market, such as stocks or cryptocurrencies, that is in a downtrend , which creates a huge disaster for investors. It is suitable to use the image in articles analyzing various price trends. Value price decrease illustrations A bear market, such as stocks or cryptocurrencies, that is in a downtrend , which creates a huge disaster for investors. It is
Free with trial A bear market, such as stocks or cryptocurrencies, that is in a downtrend , which creates a huge disaster for investors. It is suitable to use the image in articles analyzing various price trends. Value price decrease illustrations A bear market, such as stocks or cryptocurrencies, that is in a downtrend , which creates a huge disaster for investors. It is
Free with trial A bear market, such as stocks or cryptocurrencies, that is in a downtrend , which creates a huge disaster for investors. It is suitable to use the image in articles analyzing various price trends. Value price decrease illustrations A bear market, such as stocks or cryptocurrencies, that is in a downtrend , which creates a huge disaster for investors. It is
Free with trial A bear market, such as stocks or cryptocurrencies, that is in a downtrend , which creates a huge disaster for investors. It is suitable to use the image in articles analyzing various price trends. Value price decrease illustrations A bear market, such as stocks or cryptocurrencies, that is in a downtrend , which creates a huge disaster for investors. It is
Free with trial A bear market, such as stocks or cryptocurrencies, that is in a downtrend , which creates a huge disaster for investors. It is suitable to use the image in articles analyzing various price trends. Value price decrease illustrations A bear market, such as stocks or cryptocurrencies, that is in a downtrend , which creates a huge disaster for investors. It is
Free with trial A bear market, such as stocks or cryptocurrencies, that is in a downtrend , which creates a huge disaster for investors. It is suitable to use the image in articles analyzing various price trends. Value price decrease illustrations A bear market, such as stocks or cryptocurrencies, that is in a downtrend , which creates a huge disaster for investors. It is
Free with trial A bear market, such as stocks or cryptocurrencies, that is in a downtrend , which creates a huge disaster for investors. It is suitable to use the image in articles analyzing various price trends. Value price decrease illustrations A bear market, such as stocks or cryptocurrencies, that is in a downtrend , which creates a huge disaster for investors. It is
Free with trial A bear market, such as stocks or cryptocurrencies, that is in a downtrend , which creates a huge disaster for investors. It is suitable to use the image in articles analyzing various price trends. Value price decrease illustrations A bear market, such as stocks or cryptocurrencies, that is in a downtrend , which creates a huge disaster for investors. It is
Free with trial A bear market, such as stocks or cryptocurrencies, that is in a downtrend , which creates a huge disaster for investors. It is suitable to use the image in articles analyzing various price trends. Value price decrease illustrations A bear market, such as stocks or cryptocurrencies, that is in a downtrend , which creates a huge disaster for investors. It is
Free with trial A bear market, such as stocks or cryptocurrencies, that is in a downtrend , which creates a huge disaster for investors. It is suitable to use the image in articles analyzing various price trends. Value price decrease illustrations A bear market, such as stocks or cryptocurrencies, that is in a downtrend , which creates a huge disaster for investors. It is