Free with trial Internet of things icon hologram interactive telephone technology innovation concept design eps 10 vector. Visualization interactive vectors Internet of things icon hologram interactive telephone technology innovation concept design
Free with trial Boost your business with powerful data visualization, interactive bar charts and actionable insights ,Generative ai. Visualization interactive illustrations Boost your business with powerful data visualization, interactive bar charts and actionable insights
Free with trial Set Element for Futuristic Design. Interactive Interface Control Panels - Illustration Vector. Visualization interactive illustrations Set Element for Futuristic Design. Interactive Interface Control Panels
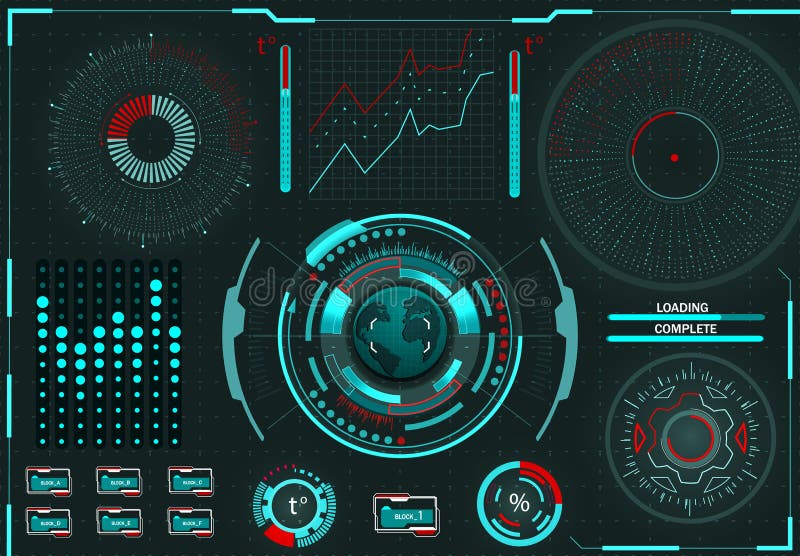
Free with trial Display, dashboard, target, innovation, user, interface, sensors, sign, , cyberspace, symbol, elements, interactive, circle, data, graphic, digital, hud, technology, illustration, chart, system, visualization, panel, futuristic, web design science electronic set control radar navigator aim space virtual navigation statistic game screen counter virtual panel motion sensors interface design te. Visualization interactive illustrations Futuristic blue virtual graphic touch user interface. Display, dashboard, target, innovation, user, interface, sensors, sign, , cyberspace, symbol, elements, interactive, circle, data, graphic, digital, hud, technology, illustration, chart, system, visualization, panel, futuristic, web design science electronic set control radar navigator aim space virtual navigation statistic game screen counter virtual panel motion sensors interface design te
Free with trial Display, dashboard, target, innovation, user, interface, sensors, sign, , cyberspace, symbol, elements, interactive, circle, data, graphic, digital, hud, technology, illustration, chart, system, visualization, panel, futuristic, web design science electronic set control radar navigator aim space virtual navigation statistic game screen counter virtual panel motion sensors interface design te. Visualization interactive illustrations Futuristic black and white HUD, virtual touch user interface in flat design. Display, dashboard, target, innovation, user, interface, sensors, sign, , cyberspace, symbol, elements, interactive, circle, data, graphic, digital, hud, technology, illustration, chart, system, visualization, panel, futuristic, web design science electronic set control radar navigator aim space virtual navigation statistic game screen counter virtual panel motion sensors interface design te
Free with trial Futuristic digital interface with holographic data visualization and interactive touchpoint elements. Visualization interactive illustrations Digital Technology Visualization Interactive Data Analytics Dashboard Concept. Futuristic digital interface with holographic data visualization and interactive touchpoint elements
Free with trial Audio and creative design process, video projection mapping, vjing and generative art, interactive and live performance concept. Flat line icons modern style vector illustration set. Visualization interactive vectors Audio and visual art design flat icons. Audio and creative design process, video projection mapping, vjing and generative art, interactive and live performance concept. Flat line icons modern style vector illustration set.
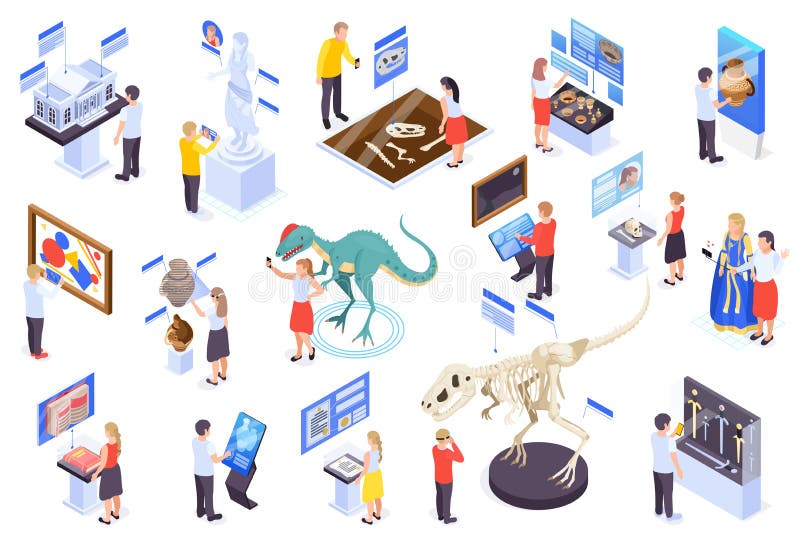
Free with trial Modern museum technology isometric set with virtual reality interactive exhibits reconstruction dinosaurs amphora info displays vector illustration. Visualization interactive vectors Modern Museum Isometric Set. Modern museum technology isometric set with virtual reality interactive exhibits reconstruction dinosaurs amphora info displays vector illustration
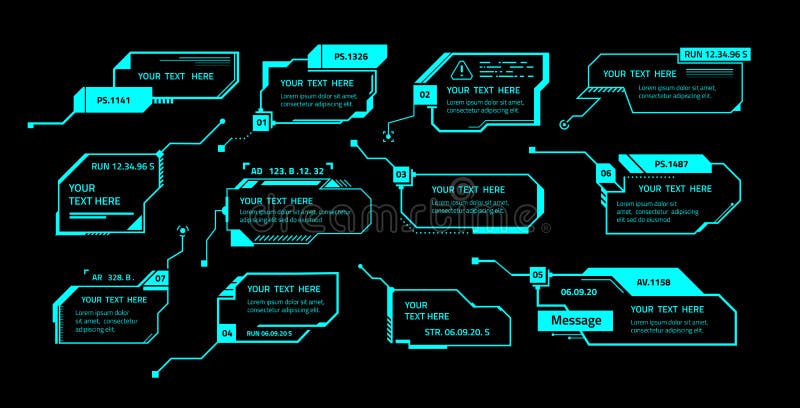
Free with trial Hud callout. Call box message layout with text template, futuristic technology ui elements, game call out banners, square frames with copy space, visualization menu panels vector vr dashboards set. Visualization interactive vectors Hud callout. Call box message layout with text template, futuristic technology ui elements, game call out banners
Free with trial The image showcases a futuristic digital interface with holographic data visualization, interactive elements, and a sleek, modern design. The scene is set in a dark environment with glowing blue and green graphics floating above a surface, creating an immersive and dynamic atmosphere. Visualization interactive illustrations Futuristic digital interface with holographic data visualization and interactive elements. The image showcases a futuristic digital interface with holographic data visualization, interactive elements, and a sleek, modern design. The scene is set in a dark environment with glowing blue and green graphics floating above a surface, creating an immersive and dynamic atmosphere
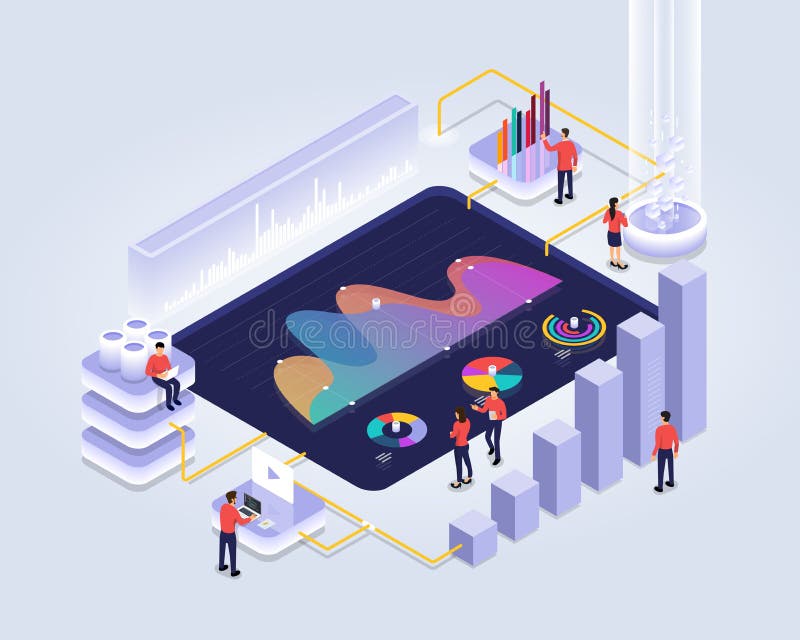
Free with trial Isometric design concept people interactive working analyzing statistics. Data visualization 3d object. Vector illustrations. Visualization interactive vectors Isometric analyzing statistics. Isometric design concept people interactive working analyzing statistics. Data visualization 3d object. Vector illustrations.
Free with trial Futuristic hightech virtual screen design. Computer systems hud panel with tracking aim frames vector set. Illustration of gui interactive, crosshair visual aim. Visualization interactive vectors Futuristic hightech virtual screen design. Computer systems hud panel with tracking aim frames vector set
Free with trial Set Element for Futuristic Design. Interactive Interface Control Panels - Illustration Vector. Visualization interactive illustrations Set Element for Futuristic Design. Interactive Interface Control Panels
Free with trial An engaging illustration of a person rolling a colorful pie chart, symbolizing data visualization, interactive analytics, and business insights. Ideal for corporate presentations, financial reports, educational materials, and marketing analytics. This graphic conveys clarity and strategic thinking, perfect for professional and informative visuals, highlighting data-driven decisions, vector design. Visualization interactive vectors Person Rolling a Colorful Pie Chart Data Visualization, vector design Generative AI. An engaging illustration of a person rolling a colorful pie chart, symbolizing data visualization, interactive analytics, and business insights. Ideal for corporate presentations, financial reports, educational materials, and marketing analytics. This graphic conveys clarity and strategic thinking, perfect for professional and informative visuals, highlighting data-driven decisions, vector design
Free with trial Video Content Visual Multimedia Modern Art Interactive Design Icon Set Vector Illustration. Visualization interactive vectors Video Content Visual Multimedia Modern Art Interactive Design Icon Set
Free with trial Real estate floor plan abstract concept vector illustration. Floor plan online services, real estate marketing, house listing, interactive property layout, virtual staging abstract metaphor. Visualization interactive vectors Real estate floor plan abstract concept vector illustration.
Free with trial Business infographic template for interactive data communication. Visualization interactive vectors Business infographic template
Free with trial A futuristic scene featuring a sleek VR headset paired with a large digital screen displaying a 3D architectural model of a glass skyscraper. The composition highlights augmented reality and building design, suggesting immersive visualization, interactive touchscreen controls, and real-time architectural planning. This image conveys tech-forward concepts for architecture, real estate tech, and digital twins, suitable for illustrating AR VR simulations, urban development, and collaborative design workflows in marketing or editorial contexts. Visualization interactive vectors Augmented Reality Architectural Visualization with VR Headset. A futuristic scene featuring a sleek VR headset paired with a large digital screen displaying a 3D architectural model of a glass skyscraper. The composition highlights augmented reality and building design, suggesting immersive visualization, interactive touchscreen controls, and real-time architectural planning. This image conveys tech-forward concepts for architecture, real estate tech, and digital twins, suitable for illustrating AR VR simulations, urban development, and collaborative design workflows in marketing or editorial contexts.
Free with trial Business infographic template for interactive data communication. Visualization interactive vectors Business infographic template
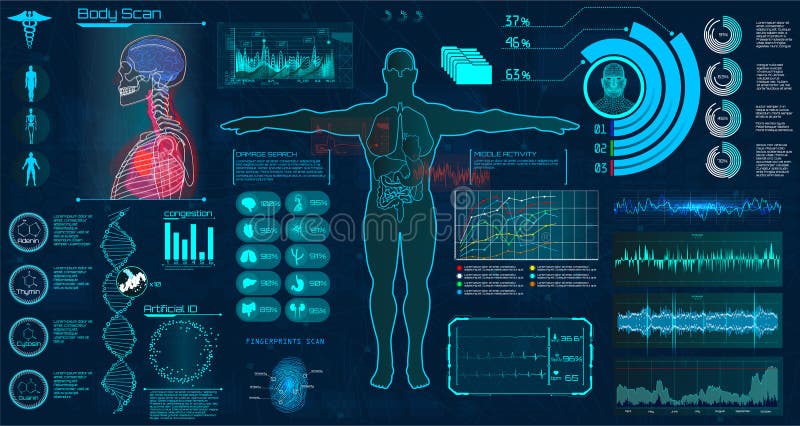
Free with trial Modern medical examination HUD style. Human body scan Anatomy, Ecg monitor, Dna formula, X-ray, Medical Infographic, Data monitors, Statistic and Diagrams Medical infographic Hud style vector. Visualization interactive vectors Modern medical examination HUD style.
Free with trial Medical examination HUD elements set. Display virtual interface dna formula, ecg monitor, body scan, medical infographic, icons set, statistic and diagrams Modern research of human health, vector. Visualization interactive vectors Medical examination HUD elements set. interface. Medical examination HUD elements set. Display virtual interface dna formula, ecg monitor, body scan, medical infographic, icons set, statistic and diagrams Modern research of human health, vector
Free with trial A man wearing a dark suit is seated, holding a tablet device that a complex financial data visualization. The screen various charts, graphs, and numerical data in blue and green hues, with glowing His fingers are interacting with the display, suggesting an active analysis or manipulation of the data. The background is blurred, focusing attention on the man and the advanced technological interface. Visualization interactive illustrations Man in suit holding tablet with financial data visualization, interactive display. A man wearing a dark suit is seated, holding a tablet device that a complex financial data visualization. The screen various charts, graphs, and numerical data in blue and green hues, with glowing His fingers are interacting with the display, suggesting an active analysis or manipulation of the data. The background is blurred, focusing attention on the man and the advanced technological interface
Free with trial HUD user interface with vector elements. Interactive screen with control panel. Futuristic HUD UI with infographic elements. Vector. Visualization interactive vectors HUD user interface with vector elements.
Free with trial Digital futuristic hud virtual interface. Vector technology screen with data graphs. Illustration of interface with data digital. Visualization interactive vectors Digital futuristic hud virtual interface. Vector technology screen with data graphs
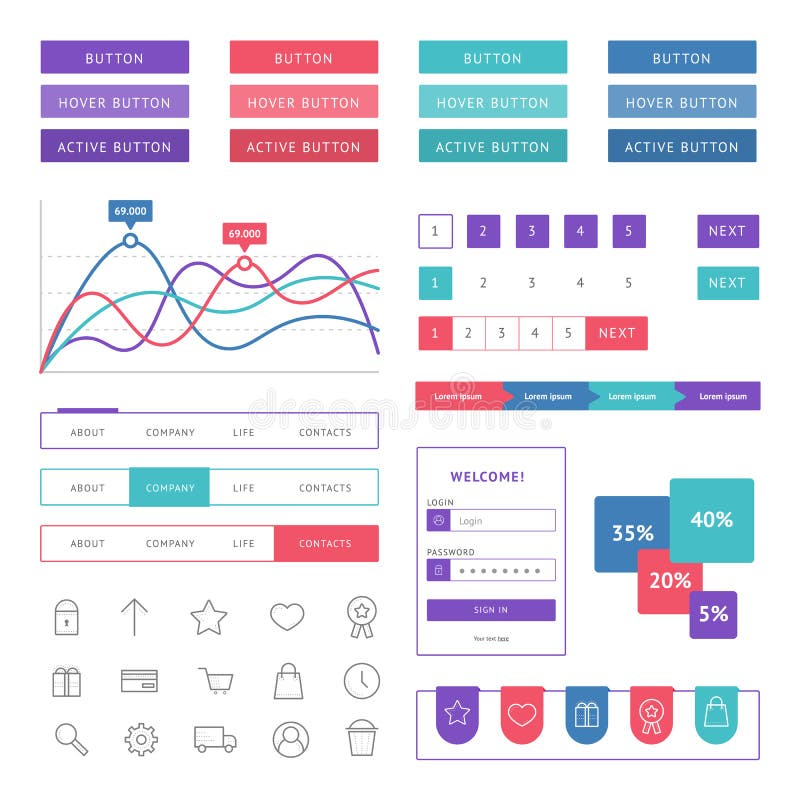
Free with trial Flat dashboard, set of ui web infographic elements. Visualization interactive vectors Flat dashboard ui. Flat dashboard, set of ui web infographic elements
Free with trial Displaying holographic UI over dark grid, showing month bars, pie chart, circular timeline, code. Data, analytics, dashboard, neon, futuristic, visualization, interactive. Visualization interactive illustrations Displaying holographic UI over dark grid, showing month bars, pie chart, circular timeline, code
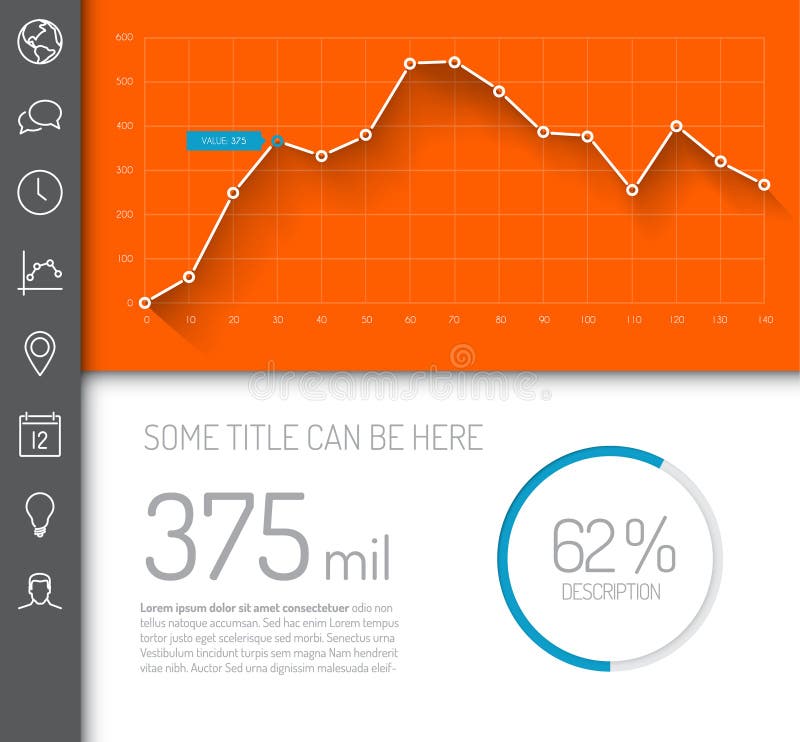
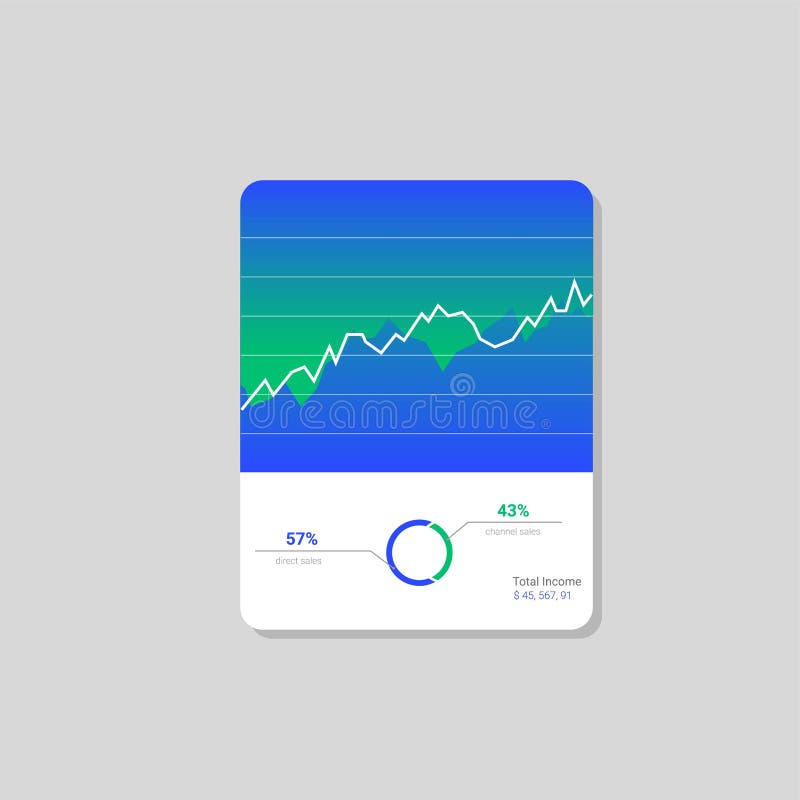
Free with trial Simple infographic dashboard template with flat design graphs and charts - orange and blue version. Visualization interactive illustrations Simple infographic dashboard template
Free with trial Technological background with square. Concept design gaming futuristic user interface high tech screen. Vector Illustration. Visualization interactive vectors Technological background with square. Concept design gaming futuristic user interface high tech screen.
Free with trial Futuristic Interface Hud Design, Infographic Elements,Tech and Science, Analysis Theme, Template UI for App and Virtual Reality - Illustration Vector. Visualization interactive vectors Futuristic Interface Hud Design, Infographic Elements,Tech and Science, Analysis Theme, Template UI for App and Virtual
Free with trial Displaying circular radial interface projecting data rings on grid with panels, world map overlay. Futuristic, digital, holographic, technology, abstract, data visualization, interactive. Visualization interactive illustrations Displaying circular radial interface projecting data rings on grid with panels, world map overlay
Free with trial Infographic dashboard template with graphs and charts. Visualization interactive vectors Infographic dashboard template
Free with trial Flat dashboard, set of ui web infographic elements. Visualization interactive vectors Flat dashboard ui. Flat dashboard, set of ui web infographic elements
Free with trial Futuristic circuit technology concept. HUD elements background. Digital futuristic user interface, HUD for app and web. VR futuristic illustration. Visualization interactive vectors Futuristic circuit technology concept HUD. Futuristic circuit technology concept.HUD elements background. Digital futuristic user interface, HUD for app and web. VR futuristic illustration.
Free with trial A businessman in a suit interacts with a digital interface projected over a smartphone, featuring a colorful bar chart, labeled "Digital Marketing," and an "AD" panel. Icons for social media, analytics, and communication surround the display, emphasizing a high-tech approach. The setting suggests modern marketing technology, blending physical and digital elements while showcasing data visualization and interactive features. Visualization interactive illustrations . A businessman in a suit interacts with a digital interface projected over a smartphone, featuring a colorful bar chart, labeled "Digital Marketing," and an "AD" panel. Icons for social media, analytics, and communication surround the display, emphasizing a high-tech approach. The setting suggests modern marketing technology, blending physical and digital elements while showcasing data visualization and interactive features.
Free with trial HUD Futuristic User Screen Control Interface Set. Abstract Virtual Hologram Target Monitor Concept Design eps10. Visualization interactive vectors HUD Futuristic User Screen Control Interface Set. Abstract Virtual Hologram Target Monitor Concept Design
Free with trial Realistic 3d Virtual Reality Headset Box Closeup front View. Futuristic Innovation digital cyberspace Technology Simulation Symbol. Vector stereoscopic vr mask device on green blue background. Visualization interactive vectors Realistic 3d Virtual Reality Headset Box Closeup front View. Futuristic Innovation digital cyberspace Technology Simulation Symbol
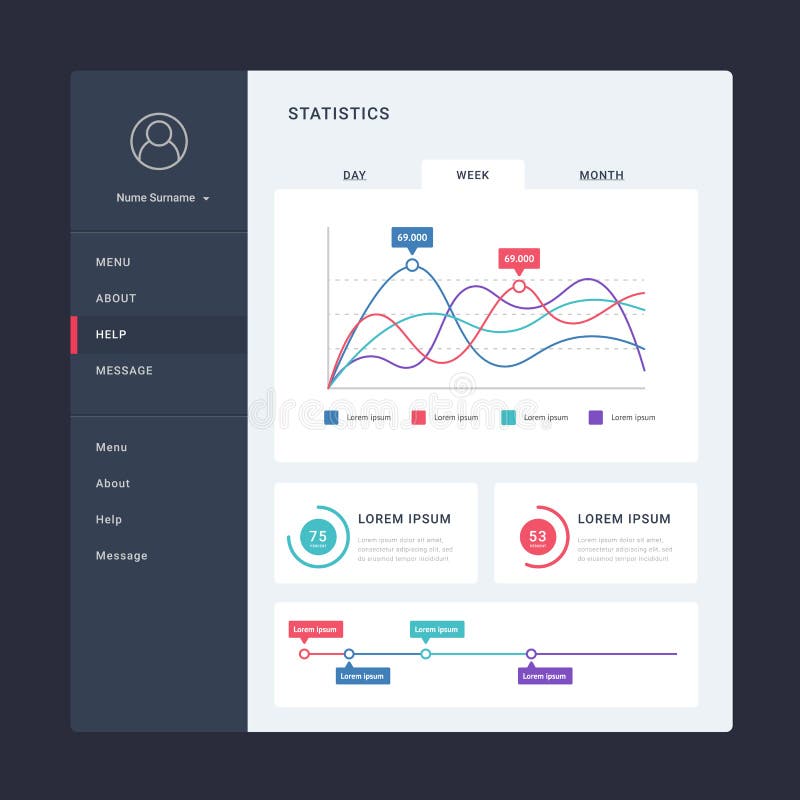
Free with trial Business infographic dashboard. Modern interface, admin platform with graph, statistics chart marketing diagram. Vector infographics admin dashboard, infographic business statistic illustration. Visualization interactive vectors Business infographic dashboard. Modern interface, admin platform with graph, statistics chart marketing diagram. Vector
Free with trial Sci-fi futuristic blue hud dashboard display virtual reality technology screen. Visualization interactive vectors Sci-fi futuristic blue hud dashboard display virtual reality technology screen
Free with trial Computer control processes. Diagnostic stand. Virtual graphic interface, electronic lens, HUD elements. Vector illustration. Visualization interactive vectors Computer control processes. Diagnostic stand. Virtual graphic interface, electronic lens, HUD elements. illustration
Free with trial Dashboard service abstract concept vector illustration. Online reporting mechanism, key performance indicators, dashboard service tool, data metrics, information management abstract metaphor. Visualization interactive vectors Dashboard service abstract concept vector illustration.
Free with trial Real estate listing services abstract concept vector illustration set. Real estate photography, video tour and floor plan, realty agency advertisement, open house, virtual staging abstract metaphor. Visualization interactive vectors Real estate listing services abstract concept vector illustrations. Real estate listing services abstract concept vector illustration set. Real estate photography, video tour and floor plan, realty agency advertisement, open house, virtual staging abstract metaphor.
Free with trial Computer management. Diagnostic equipment. Virtual graphic interface, electronic lens, HUD elements. Vector illustration. Visualization interactive vectors Computer management. Diagnostic equipment. Virtual graphic interface, electronic lens, HUD elements. illustration
Free with trial Abstract technology ui futuristic concept hud interface hologram elements of digital data chart, communication, computing and circle percent vitality innovation. hi tech future design background. Visualization interactive vectors Abstract technology ui futuristic concept hud interface hologram elements of digital data chart, communication, computing and
Free with trial The image shows a pair of hands holding a large tablet displaying a vibrant, futuristic interface filled with various icons, charts, and animated figures. The interface appears to be a complex digital dashboard with elements suggesting data visualization, interactive graphics, and possibly a virtual workspace or game environment. Visualization interactive illustrations Person interacting with a futuristic digital interface on a tablet device. The image shows a pair of hands holding a large tablet displaying a vibrant, futuristic interface filled with various icons, charts, and animated figures. The interface appears to be a complex digital dashboard with elements suggesting data visualization, interactive graphics, and possibly a virtual workspace or game environment
Free with trial Computer management. Diagnostic stand. Virtual graphic interface, electronic lens, HUD elements. Vector illustration. Visualization interactive vectors Computer management. Diagnostic stand. Virtual graphic interface, electronic lens, HUD elements. illustration
Free with trial Infographic dashboard template with flat design graphs and pie charts. Information Graphics elements for UI UX design. Web elements in moden style. Visualization interactive vectors Infographic dashboard template with flat design graphs and pie charts. Information Graphics elements for UI UX design.
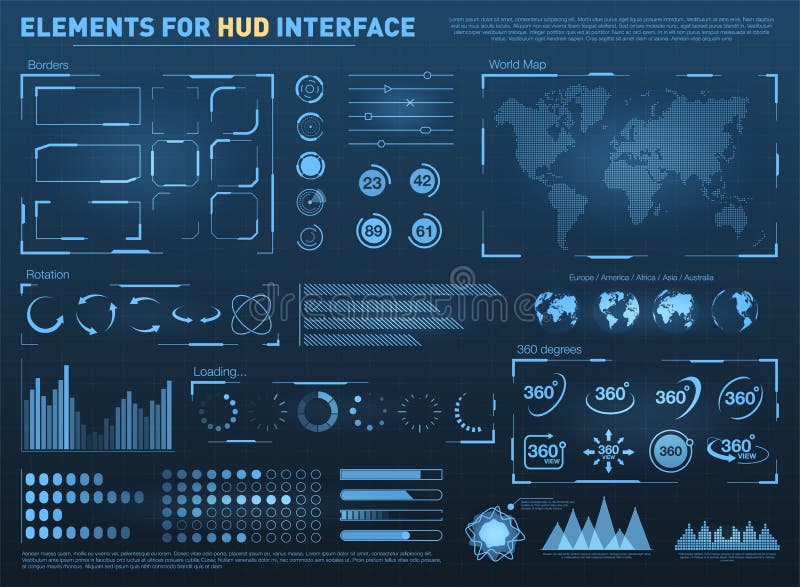
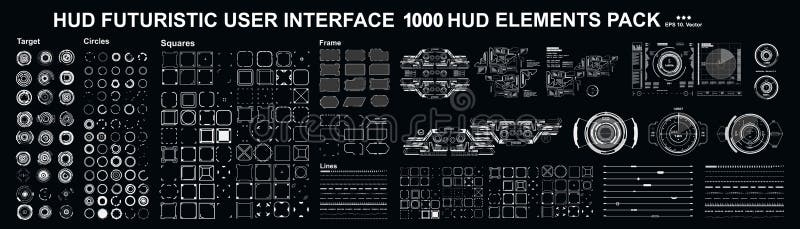
Free with trial HUD style. Big hud sets. Vector science abstract. Vector illustration. Futuristic user interface. Sky-fi HUD. Set abstract HUD elements for UI UX design. Futuristic Sci-Fi useri Interface for app. Visualization interactive vectors HUD style. Big hud sets. Vector science abstract. Vector illustration. Futuristic user interface. Sky-fi HUD. Set abstract HUD el
Free with trial This image depicts a hand interacting with a tablet that displays various digital interface elements in real-time. The tablet screen shows a range of graphics, icons, charts, and graphs, illustrating the concept of data visualization and interactive technology. The image highlights the modern and innovative aspects of digital communication, information exchange, and data analysis. Visualization interactive vectors A hand interacting with a tablet displaying various digital interface elements in real-time. This image depicts a hand interacting with a tablet that displays various digital interface elements in real-time. The tablet screen shows a range of graphics, icons, charts, and graphs, illustrating the concept of data visualization and interactive technology. The image highlights the modern and innovative aspects of digital communication, information exchange, and data analysis.
Free with trial Mega pack set target. HUD futuristic user interface. Futuristic virtual graphic touch user interface. Visualization interactive vectors Mega pack set target. HUD futuristic user interface. Futuristic virtual graphic touch user interface.
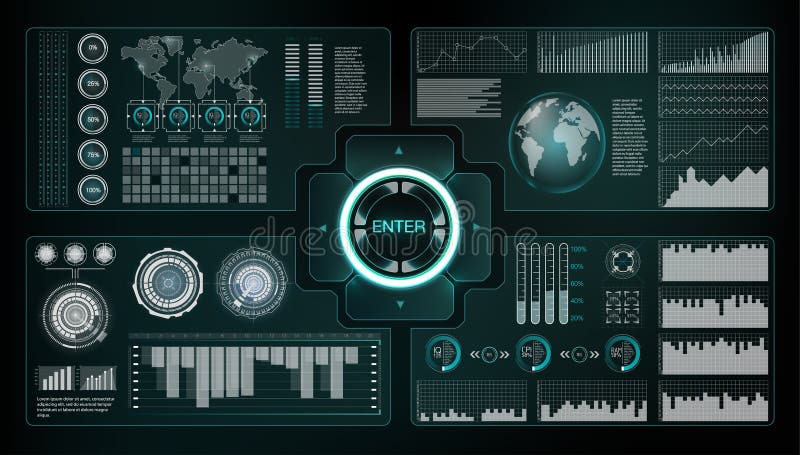
Free with trial HUD elements mega set pack. Dashboard display virtual reality technology screen. Futuristic user interface. Visualization interactive illustrations HUD elements mega set pack. Dashboard display virtual reality technology screen. Futuristic user interface
Free with trial Infographic dashboard template with flat design graphs and charts. Processing analysis of data. Visualization interactive vectors Infographic dashboard template with flat design graphs and charts. Processing analysis of data
Free with trial A futuristic visualization of global data, showcasing financial market trends and technological advancements on a transparent globe. Visualization interactive illustrations Global Network Data Visualization: Interactive World Map with Financial Market Trends and Technological Innovation. A futuristic visualization of global data, showcasing financial market trends and technological advancements on a transparent globe
Free with trial Futuristic black and white virtual graphic touch user interface HUD. Visualization interactive vectors Futuristic black and white virtual graphic touch user interface HUD
Free with trial Car HUD Dashboard. Abstract virtual graphic touch user interface. Futuristic user interface HUD and Infographic elements. Visualization interactive vectors Car HUD Dashboard. Abstract virtual graphic touch user interface. Futuristic user interface HUD
Free with trial Sci-fi futuristic hud dashboard display virtual reality technology screen. Visualization interactive illustrations Sci-fi futuristic hud dashboard display virtual reality technology screen
Free with trial A digital visualization showing global data and financial market trends. Illustrates interconnectedness and technological advancement. Visualization interactive illustrations Global Network Data Visualization: Interactive World Map with Financial Market Trends and Technological Connections. A digital visualization showing global data and financial market trends. Illustrates interconnectedness and technological advancement
Free with trial HUD elements mega set pack. Dashboard display virtual reality technology screen. Futuristic user interface. Visualization interactive illustrations HUD elements mega set pack. Dashboard display virtual reality technology screen. Futuristic user interface
Free with trial Space launch interface rockets, graphic display control the pallet rocket. Sky-fi HUD. vector. Visualization interactive vectors Space launch interface rockets, graphic display control the pallet rocket.
Free with trial HUD elements mega set pack. Dashboard display virtual reality technology screen. Futuristic user interface. Visualization interactive vectors HUD elements mega set pack. Dashboard display virtual reality technology screen. Futuristic user interface.
Free with trial Professionals engage in a strategic meeting showcasing modern technology and artificial intelligence, enhancing collaboration through data visualization and interactive discussion. Trope. Visualization interactive illustrations Team Collaboration in Modern Office with Artificial Intelligence Concept and Data Visualization on Screens and Tables. Professionals engage in a strategic meeting showcasing modern technology and artificial intelligence, enhancing collaboration through data visualization and interactive discussion. Trope
Free with trial Futuristic blue virtual graphic touch user interface. Visualization interactive illustrations Futuristic blue virtual graphic touch user interface
Free with trial Sci-fi futuristic hud dashboard display virtual reality technology screen. Visualization interactive illustrations Sci-fi futuristic hud dashboard display virtual reality technology screen
Free with trial Sci-fi futuristic hud dashboard display virtual reality technology screen. Visualization interactive illustrations Sci-fi futuristic hud dashboard display virtual reality technology screen
Free with trial A stylized illustration of an energy monitoring inverter display panel featuring a digital LCD showing 95 kWh, a bar chart, and control buttons (ON OFF, MODE, SETTINGS). The design emphasizes modern energy management with a user-friendly interface, data visualization, and interactive controls. Suitable for stock imagery on renewable energy, home power monitoring, smart appliances, and electrical engineering topics. Ideal for projects about energy efficiency, solar power systems, and energy analytics for dashboards, manuals, and marketing materials. Visualization interactive vectors Energy Monitoring Inverter Display Panel Illustration. A stylized illustration of an energy monitoring inverter display panel featuring a digital LCD showing 95 kWh, a bar chart, and control buttons (ON OFF, MODE, SETTINGS). The design emphasizes modern energy management with a user-friendly interface, data visualization, and interactive controls. Suitable for stock imagery on renewable energy, home power monitoring, smart appliances, and electrical engineering topics. Ideal for projects about energy efficiency, solar power systems, and energy analytics for dashboards, manuals, and marketing materials.
Free with trial Sci-fi futuristic hud dashboard display virtual reality technology screen. Visualization interactive illustrations Sci-fi futuristic hud dashboard display virtual reality technology screen
Free with trial Sci-fi futuristic hud dashboard display virtual reality technology screen. Visualization interactive illustrations Sci-fi futuristic hud dashboard display virtual reality technology screen
Free with trial Infographic dashboard template with flat design graphs and charts. Mobile app design. Processing and analysis of data. Visualization interactive illustrations Infographic dashboard template with flat design graphs and charts. Mobile app design. Processing and analysis of data
Free with trial A futuristic close-up of a gloved hand gently touching a glowing, data-driven world map. The holographic interface features blue neon grids, orange-highlighted continents, and interconnected networks, conveying themes of globalization, digital transformation, and real-time analytics. Ideal for tech, finance, cybersecurity, and geospatial campaigns, this image communicates innovation, connectivity, and strategic insight in a modern, high-tech setting. Visualization interactive illustrations Global Tech Visualization: Interactive Digital World Map. A futuristic close-up of a gloved hand gently touching a glowing, data-driven world map. The holographic interface features blue neon grids, orange-highlighted continents, and interconnected networks, conveying themes of globalization, digital transformation, and real-time analytics. Ideal for tech, finance, cybersecurity, and geospatial campaigns, this image communicates innovation, connectivity, and strategic insight in a modern, high-tech setting.
Free with trial Abstract background of round futuristic technology user interface screen hud. Visualization interactive vectors Background of round futuristic technology user interface screen hud
Free with trial Infographic dashboard template with flat design graphs and charts. Processing analysis of data. Visualization interactive illustrations Infographic dashboard template with flat design graphs and charts. Processing analysis of data
Free with trial Augmented reality marketing concept. Black color smart phone with abstract simple infographic. AR application background. 3D vector illustration. Visualization interactive vectors Augmented reality marketing concept. Black color smart phone with abstract simple infographic. AR application background
Free with trial A close-up view of a person wearing a suit interacting with a futuristic, holographic virtual workflow dashboard displayed on a transparent digital glass screen in a professional environment. The dashboard features circular flow charts, data visualization, interactive conversation elements, and optimization icons, representing advanced business management and digital transformation technology. Visualization interactive illustrations A business professional interacting with a virtual workflow dashboard on a digital glass screen. A close-up view of a person wearing a suit interacting with a futuristic, holographic virtual workflow dashboard displayed on a transparent digital glass screen in a professional environment. The dashboard features circular flow charts, data visualization, interactive conversation elements, and optimization icons, representing advanced business management and digital transformation technology
Free with trial HUD elements mega set pack. Dashboard display virtual reality technology screen. Futuristic user interface. Visualization interactive illustrations HUD elements mega set pack. Dashboard display virtual reality technology screen. Futuristic user interface
Free with trial Vector virtual reality person banner template. Female in vr glasses holding musical note on fluid wave background. Concept of innovation in music entertainment. Design element for poster, flyer, web. Visualization interactive vectors Vector virtual reality person banner template. Female in vr glasses holding musical note on fluid wave background. Concept of
Free with trial HUD elements mega set pack. Dashboard display virtual reality technology screen. Futuristic user interface. Visualization interactive vectors HUD elements mega set pack. Dashboard display virtual reality technology screen. Futuristic user interface.
Free with trial Professional it specialist working on workstation with complex 3d infrastructure visualization. Interactive dashboard showing application layer network layer and data layer security status with compliance reports and real time vulnerability assessment. Visualization interactive illustrations Layered network architecture diagram showing security protocols data protection and threat detection. Professional it specialist working on workstation with. Professional it specialist working on workstation with complex 3d infrastructure visualization. Interactive dashboard showing application layer network layer and data layer security status with compliance reports and real time vulnerability assessment
Free with trial HUD elements mega set pack. Dashboard display virtual reality technology screen. Futuristic user interface. Visualization interactive illustrations HUD elements mega set pack. Dashboard display virtual reality technology screen. Futuristic user interface
Free with trial A futuristic vector illustration of data projected onto a holographic grid, symbolizing advanced data visualization, interactive displays, and cutting-edge technology. This icon is ideal for themes of virtual reality, augmented reality, scientific modeling, or digital interfaces. Perfect for tech presentations, sci-fi media, or innovative software, vector design Generative AI. Visualization interactive vectors Holographic Data Projection: Advanced Visualization Interactive Tech vector design Generative AI. A futuristic vector illustration of data projected onto a holographic grid, symbolizing advanced data visualization, interactive displays, and cutting-edge technology. This icon is ideal for themes of virtual reality, augmented reality, scientific modeling, or digital interfaces. Perfect for tech presentations, sci-fi media, or innovative software, vector design Generative AI