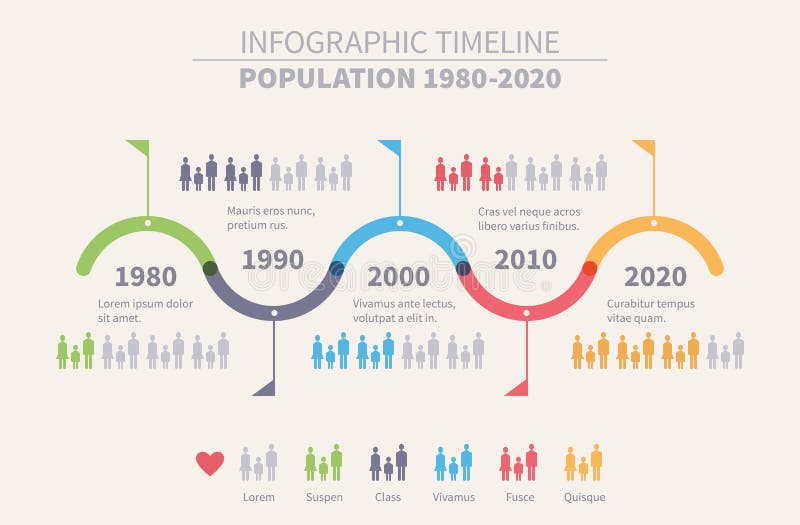
Free with trial Colored Population Timeline Inforgraphic Design from 1980 to 2020 on Off White Background. Wavy timeline vectors Population Timeline Inforgraphic Design
Free with trial Green wavy timeline infographic template showcases a chronological progression with distinct years and associated icons. The timeline template represent historical data or future plans effectively. Wavy timeline vectors Modern Green Wavy Timeline Infographic Template with Icons. Green wavy timeline infographic template showcases a chronological progression with distinct years and associated icons. The timeline template represent historical data or future plans effectively
Free with trial Blue presentation background templates with dynamic wavy stripe lines elements background. Use for business annual report, flyer, corporate marketing, leaflet, advertising, brochure, modern style. Wavy timeline illustrations Blue presentation background templates with dynamic wavy stripe lines elements background. Use for business annual report, flyer
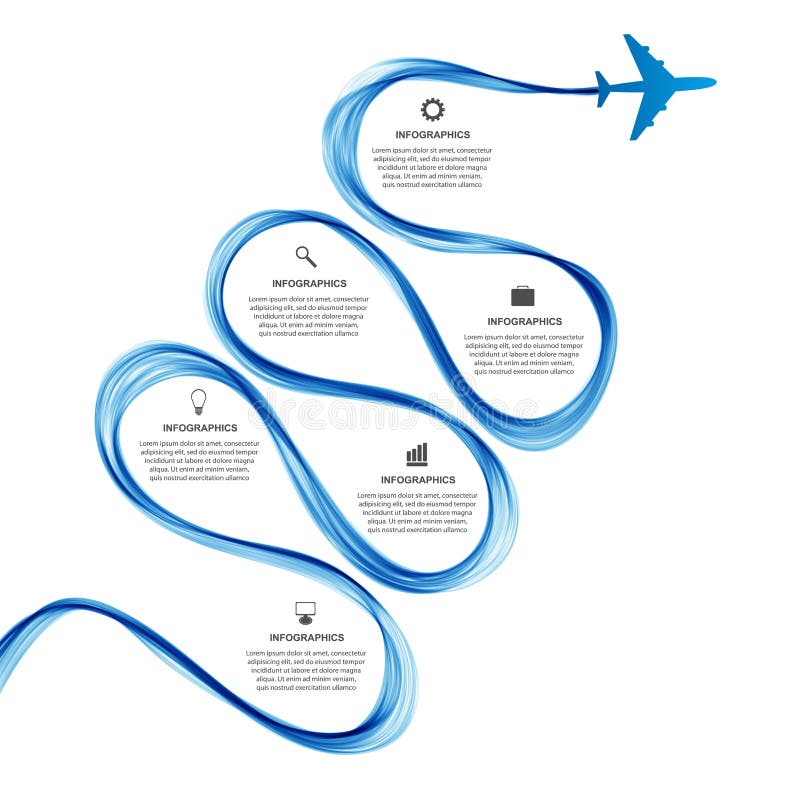
Free with trial Abstract infographic airplane and wave a blue smoke. Vector illustration. Wavy timeline vectors Abstract infographic airplane and wave a blue smoke.
Free with trial Men Fashion Icons Set. Fashion Evolution Avatar Vector Illustration. Man Fashion Evolution Decorative Set. Fashion Evolution Design Set. Fashion Evolution Flat Isolated Set. Wavy timeline vectors Men Fashion Avatar Evolution Icons Set. Men Fashion Icons Set. Fashion Evolution Avatar Vector Illustration. Man Fashion Evolution Decorative Set. Fashion Evolution Design Set. Fashion Evolution Flat Isolated Set.
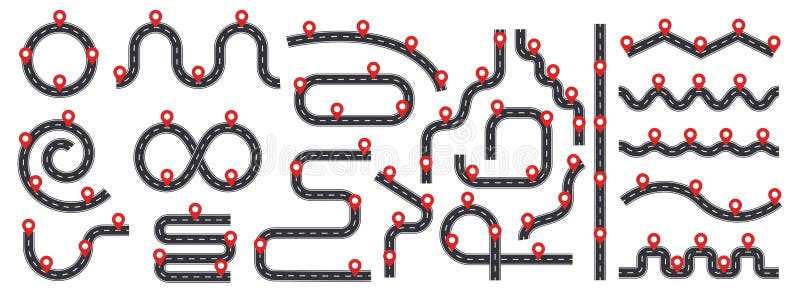
Free with trial Road path with red pin pointers. Business journey map infographic, wavy timeline with milestones. Workflow process chart, flow chart. Abstract route infographics vector elements. Wavy timeline vectors Road path with red pin pointers. Business journey map infographic, wavy timeline with milestones. Workflow process chart, flow
Free with trial Women Fashion Icons Set. Fashion Evolution Avatar Vector Illustration. Fashion Evolution Decorative Set. Fashion Evolution Design Set. Fashion Evolution Flat Set. Wavy timeline vectors Fashion Evolution Avatar Set. Women Fashion Icons Set. Fashion Evolution Avatar Vector Illustration. Fashion Evolution Decorative Set. Fashion Evolution Design Set. Fashion Evolution Flat Set.
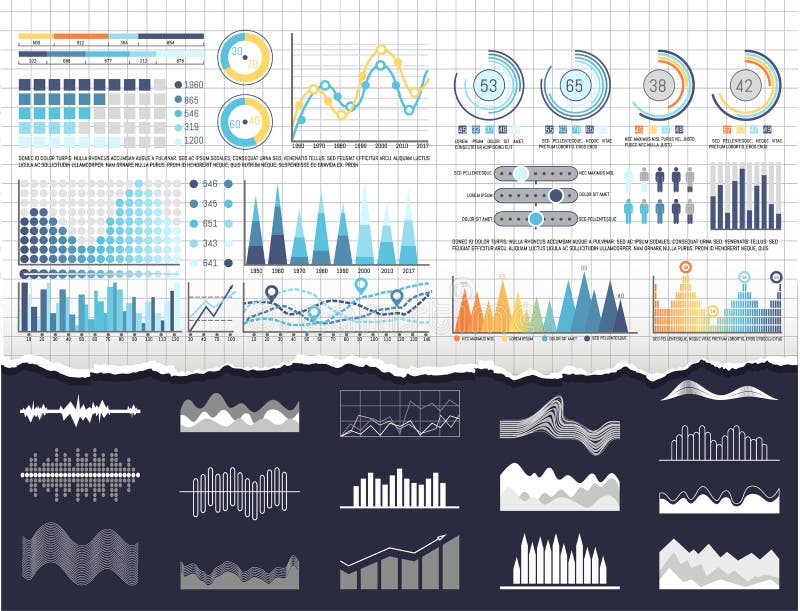
Free with trial Data on infographics and flowcharts templates vector. Editable business charts having percentages and figures statistics. Pie diagrams and graphs. Wavy timeline vectors Data on Infographics and Flowcharts Templates
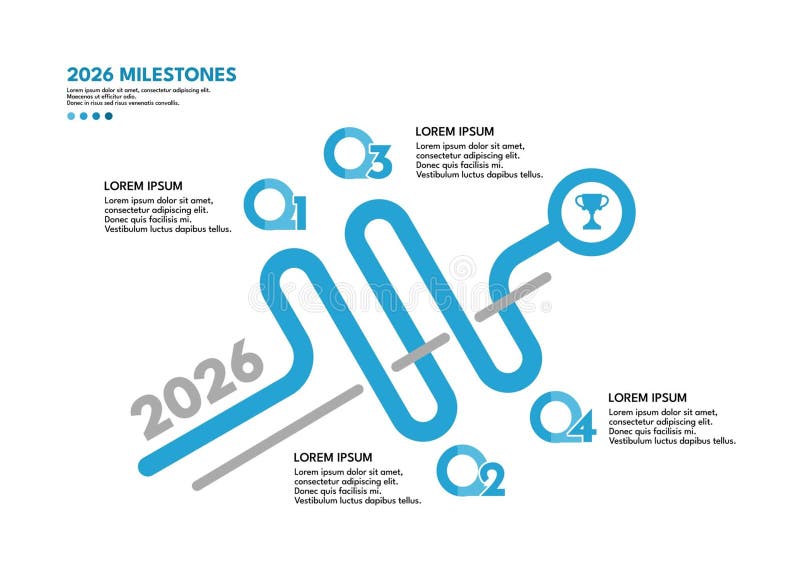
Free with trial A creative vector infographic template designed to visualize milestones and key events for the year 2026 using a dynamic wavy timeline format. This modern design breaks away from traditional linear layouts to present project stages, annual objectives, historical events, or future plans in an engaging and flowing manner. Ideal for business presentations, marketing campaigns, educational materials, or strategic planning documents. Fully scalable and easily editable. Wavy timeline vectors 2026 milestones infographic template, wavy timeline. A creative vector infographic template designed to visualize milestones and key events for the year 2026 using a dynamic wavy timeline format. This modern design breaks away from traditional linear layouts to present project stages, annual objectives, historical events, or future plans in an engaging and flowing manner. Ideal for business presentations, marketing campaigns, educational materials, or strategic planning documents. Fully scalable and easily editable.
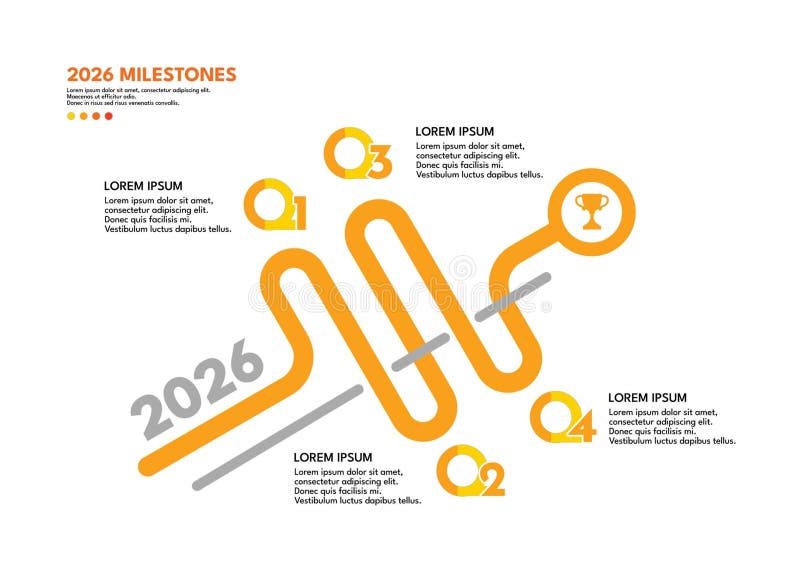
Free with trial A creative vector infographic template designed to visualize milestones and key events for the year 2026 using a dynamic wavy timeline format. This modern design breaks away from traditional linear layouts to present project stages, annual objectives, historical events, or future plans in an engaging and flowing manner. Ideal for business presentations, marketing campaigns, educational materials, or strategic planning documents. Fully scalable and easily editable. Wavy timeline vectors 2026 milestones infographic template, wavy timeline. A creative vector infographic template designed to visualize milestones and key events for the year 2026 using a dynamic wavy timeline format. This modern design breaks away from traditional linear layouts to present project stages, annual objectives, historical events, or future plans in an engaging and flowing manner. Ideal for business presentations, marketing campaigns, educational materials, or strategic planning documents. Fully scalable and easily editable.
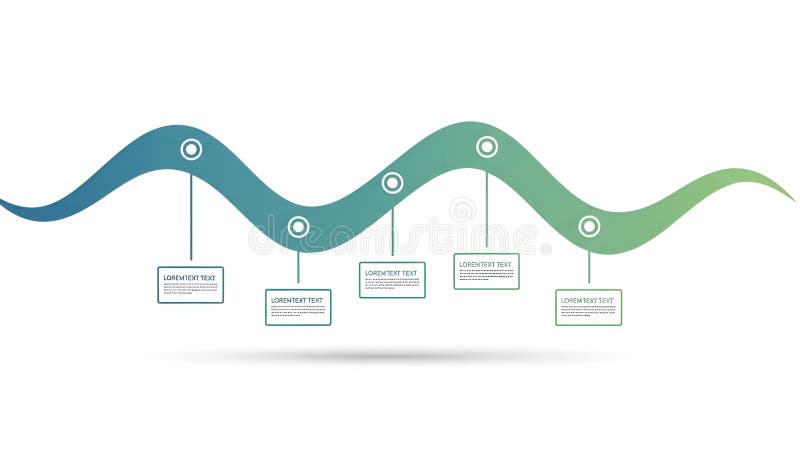
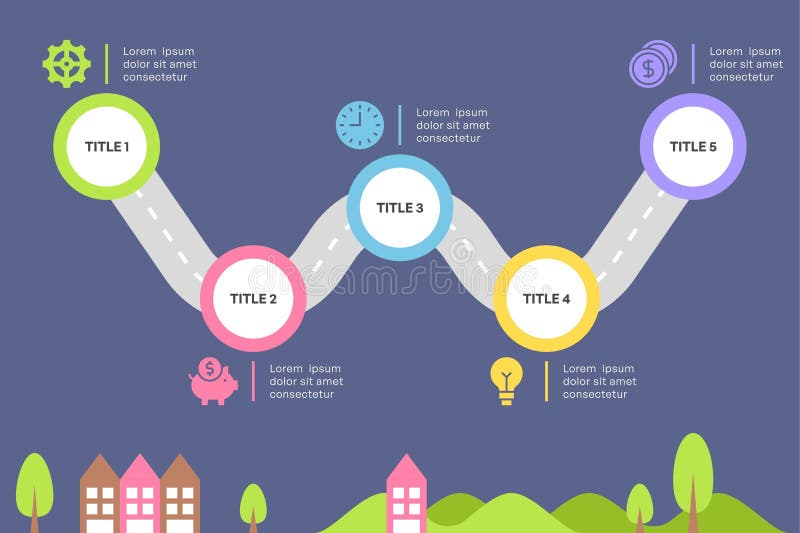
Free with trial A modern and clean infographic template featuring a wavy, flowing line with a blue-to-green gradient. This vector illustration visualizes a process, timeline, or roadmap with five distinct milestones or steps. Each point on the wave connects to a text box for custom descriptions, making it ideal for business presentations, project management, strategic planning, or educational materials. The minimalist design on a white background allows for easy integration into various projects. This is a versatile graphic for data visualization and process flow charts. Wavy timeline illustrations Modern Wavy Timeline Infographic Template. A modern and clean infographic template featuring a wavy, flowing line with a blue-to-green gradient. This vector illustration visualizes a process, timeline, or roadmap with five distinct milestones or steps. Each point on the wave connects to a text box for custom descriptions, making it ideal for business presentations, project management, strategic planning, or educational materials. The minimalist design on a white background allows for easy integration into various projects. This is a versatile graphic for data visualization and process flow charts.
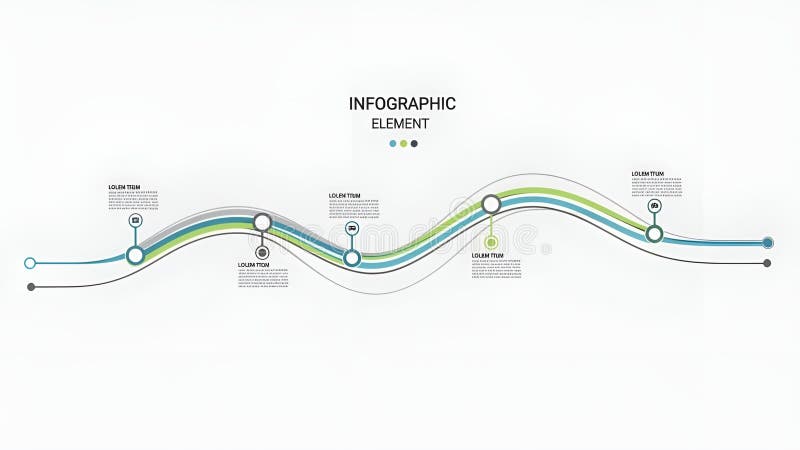
Free with trial A clean and modern infographic element featuring a wavy timeline with multiple stages or points. The design incorporates blue, green, and gray lines, each connected to circles with placeholders for text and icons. The layout is suitable for visualizing processes, project timelines, or data progression. It's a versatile graphic for presentations, reports, and web design. Wavy timeline illustrations Timeline Infographic Element with Wavy Line. A clean and modern infographic element featuring a wavy timeline with multiple stages or points. The design incorporates blue, green, and gray lines, each connected to circles with placeholders for text and icons. The layout is suitable for visualizing processes, project timelines, or data progression. It's a versatile graphic for presentations, reports, and web design.
Free with trial A dynamic, abstract wavy arrow symbol with illuminated blue dots represents a timeline or progress. Ideal for illustrating stages, journeys, or sequential steps in a project or process. Wavy timeline illustrations Abstract wavy timeline arrow symbol progress stages journey visualization concept. A dynamic, abstract wavy arrow symbol with illuminated blue dots represents a timeline or progress. Ideal for illustrating stages, journeys, or sequential steps in a project or process
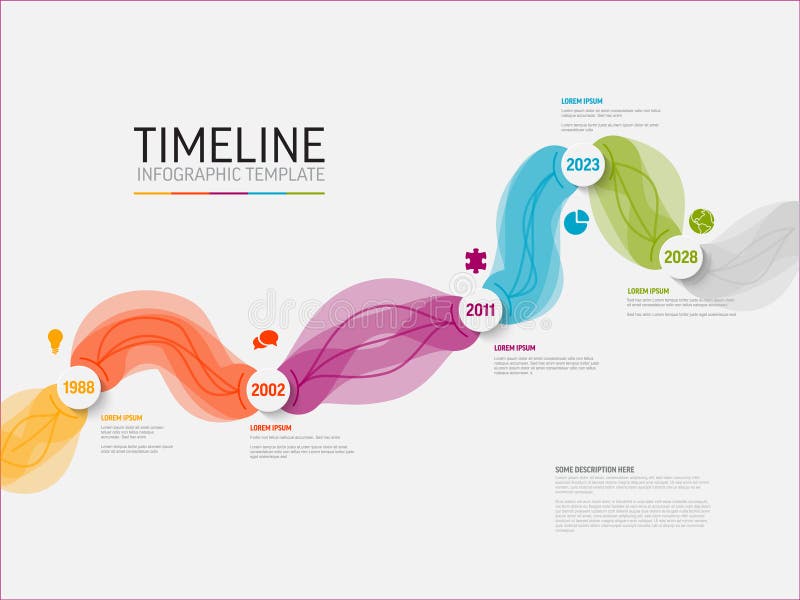
Free with trial A modern colorful wavy timeline infographic template for presenting historical data, business progress, or project stages. Timeline infographic template for your data visualization design. Wavy timeline vectors Colorful Modern Timeline Infographic Template on light background. A modern colorful wavy timeline infographic template for presenting historical data, business progress, or project stages. Timeline infographic template for your data visualization design
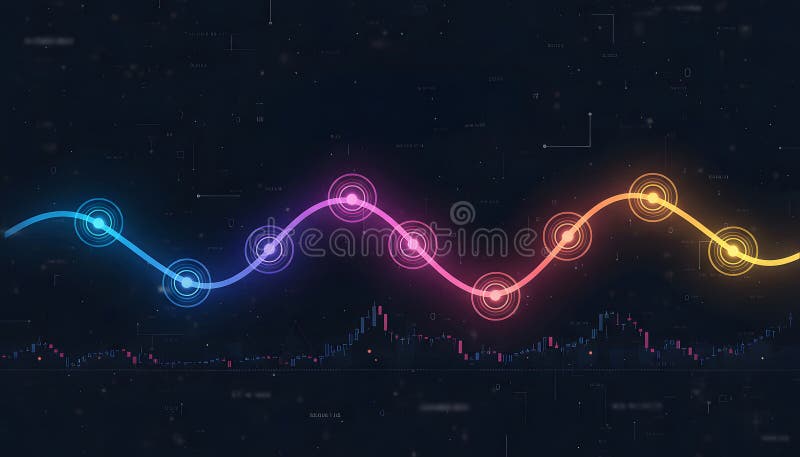
Free with trial This sophisticated digital image depicts a futuristic financial data visualization, featuring a vibrant, multi-colored wavy timeline with glowing circular nodes that illustrate a path of progress or data flow. Beneath this dynamic curve, a detailed candlestick chart displays market trends, indicating price movements and trading activity with blue and red bars against a dark, abstract background. Wavy timeline illustrations Futuristic Financial Data Visualization: Vibrant Wavy Timeline and Glowing Candlestick Chart on a Dark Digital Background. This sophisticated digital image depicts a futuristic financial data visualization, featuring a vibrant, multi-colored wavy timeline with glowing circular nodes that illustrate a path of progress or data flow. Beneath this dynamic curve, a detailed candlestick chart displays market trends, indicating price movements and trading activity with blue and red bars against a dark, abstract background
Free with trial Modern wavy timeline infographic template with colorful segments, icons, and text blocks for visualizing project stages or historical events. Vector illustration. Wavy timeline vectors Modern timeline infographic template with colorful segments, icons, and text, visualizing project stages. Vector illustration. Modern wavy timeline infographic template with colorful segments, icons, and text blocks for visualizing project stages or historical events. Vector illustration.
Free with trial Modern wavy timeline infographic template with colorful segments, icons, and text blocks for visualizing project stages or historical events. Vector illustration. Wavy timeline vectors Modern timeline infographic template with colorful segments, icons, and text, visualizing project stages. Vector illustration. Modern wavy timeline infographic template with colorful segments, icons, and text blocks for visualizing project stages or historical events. Vector illustration.
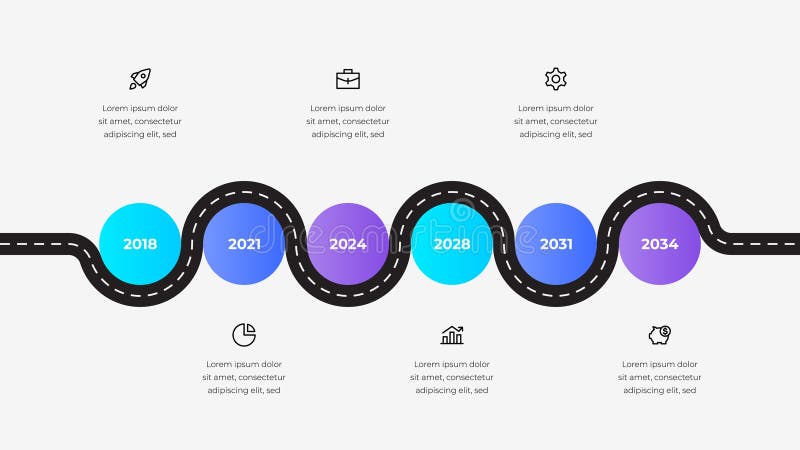
Free with trial A colorful wavy timeline graphic illustrates business development milestones from 2024 through 2028, featuring icons for analytics, computers, data transfer, partnerships, and gears. Wavy timeline illustrations Timeline infographic showing business growth from 2024 to 2028 with icons. A colorful wavy timeline graphic illustrates business development milestones from 2024 through 2028, featuring icons for analytics, computers, data transfer, partnerships, and gears
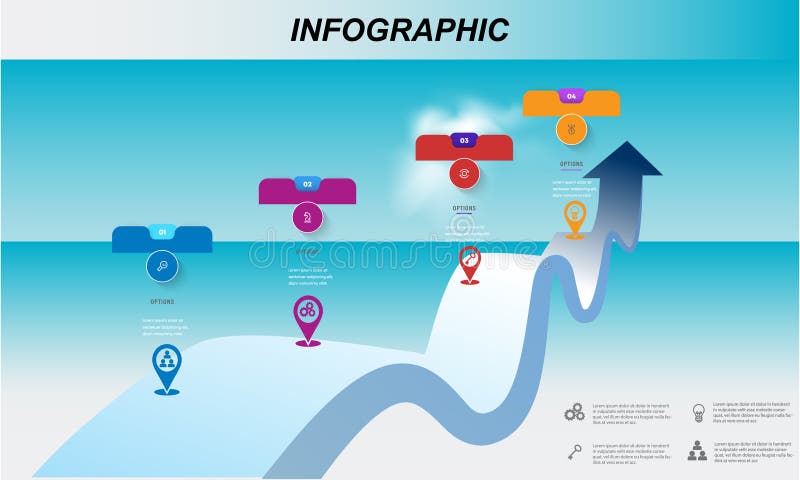
Free with trial This image is a dynamic vector infographic illustrating a four-step process, growth, or timeline. The steps (01 to 04) are visually represented by colorful, numbered horizontal banners (blue, purple, red, and orange) placed along a central, prominent wavy line that curves steeply upward into a large arrowhead. The background features a stylized blue and turquoise gradient, suggesting air, water, or sky. Each step is associated with thematic icons and location pins to mark milestones. The overall design conveys concepts of progress, a journey with challenges, business development, and achieving a final goal or success. Wavy timeline vectors Wavy Growth Infographic: Four-Step Timeline with Icons and Upward Trending Arrow. This image is a dynamic vector infographic illustrating a four-step process, growth, or timeline. The steps (01 to 04) are visually represented by colorful, numbered horizontal banners (blue, purple, red, and orange) placed along a central, prominent wavy line that curves steeply upward into a large arrowhead. The background features a stylized blue and turquoise gradient, suggesting air, water, or sky. Each step is associated with thematic icons and location pins to mark milestones. The overall design conveys concepts of progress, a journey with challenges, business development, and achieving a final goal or success.
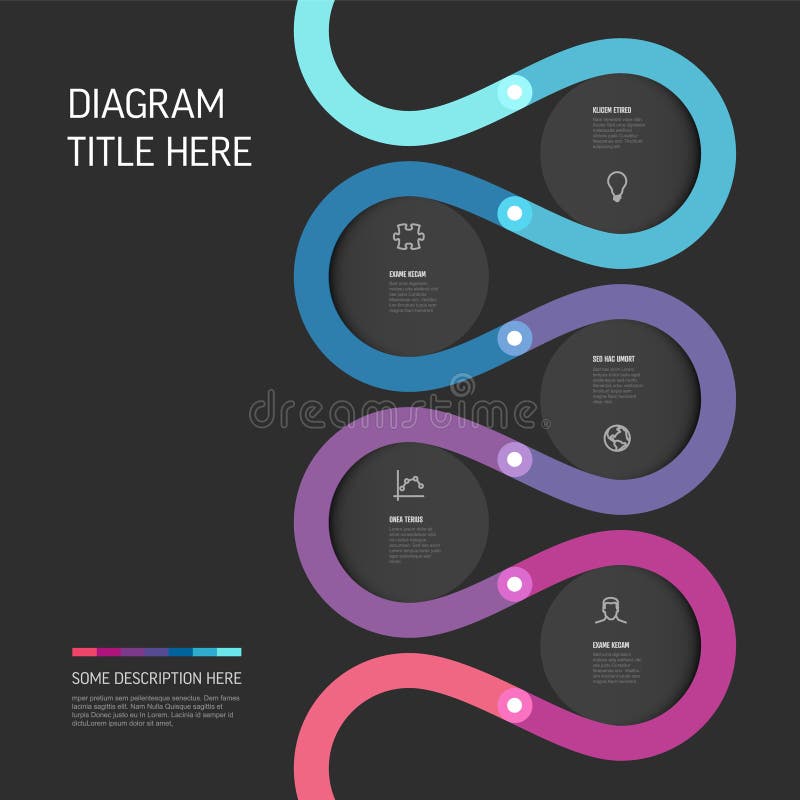
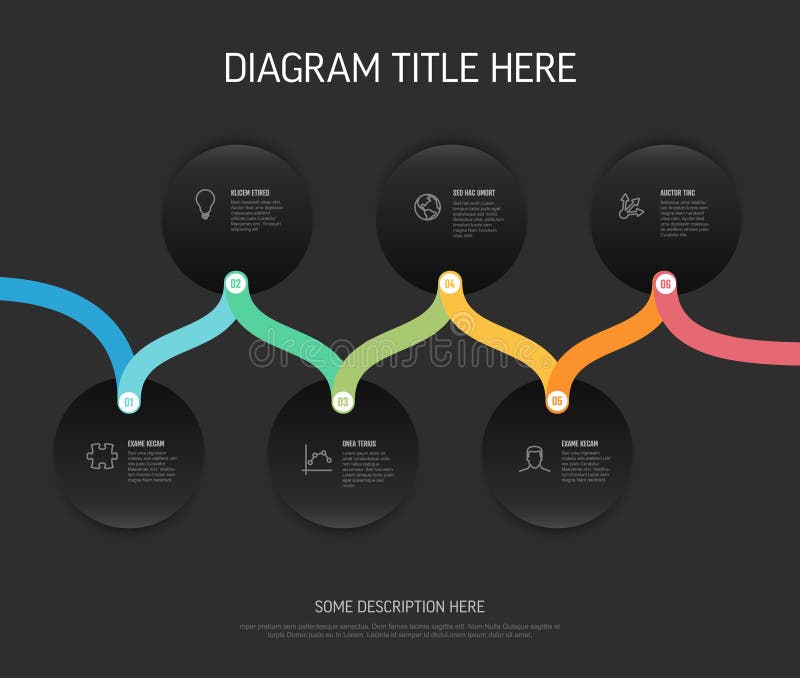
Free with trial A modern infographic timeline design element features a wavy multi-colored line with connected circles on a dark background. This infographic timeline is perfect for presentations and flowcharts. Wavy timeline vectors Modern Infographic Timeline Design Element with Wavy Sections. A modern infographic timeline design element features a wavy multi-colored line with connected circles on a dark background. This infographic timeline is perfect for presentations and flowcharts
Free with trial Timeline infographic template using a colorful wavy path to illustrate chronological events. This timeline template is perfect for presenting historical data or project milestones in an engaging way. Wavy timeline vectors Colorful Timeline Template Infographic Design with Wavy Path. Timeline infographic template using a colorful wavy path to illustrate chronological events. This timeline template is perfect for presenting historical data or project milestones in an engaging way
Free with trial Road infographic. 3D road timeline wavy wending route, journey infographics with red location pins marking milestones. Success business growth startup strategy vector concept. Wavy timeline vectors Road infographic. 3D road timeline wavy wending route, journey infographics with red location pins marking milestones. Success
Free with trial A cheerful cartoon boy in blue clothing points at a wavy timeline infographic with colorful icons on a light blue background, conveying a sense of excitement and guidance. Wavy timeline illustrations Cartoon boy character pointing at timeline infographic with icons. A cheerful cartoon boy in blue clothing points at a wavy timeline infographic with colorful icons on a light blue background, conveying a sense of excitement and guidance.
Free with trial A vibrant 5-step infographic template, with colorful wavy arrow design. This infographic template uses distinct steps and icons to represent a process or timeline with clear, engaging visual flow. Wavy timeline vectors Colorful 5-Step Wavy Arrow Infographic Template with Icons. A vibrant 5-step infographic template, with colorful wavy arrow design. This infographic template uses distinct steps and icons to represent a process or timeline with clear, engaging visual flow
Free with trial Infographic labels as wavy waves in shadows of green color with rectangles, circles and timeline ready for your text. Wavy timeline vectors Infographic vector as wavy waves in shadows of green color. Infographic labels as wavy waves in shadows of green color with rectangles, circles and timeline ready for your text.
Free with trial Modern infographic labels as wavy waves in shadows of yellow and brown color with rectangles, circles and timeline ready for your text. Wavy timeline vectors Modern infographic vector as wavy waves in shadows of yellow and. Modern infographic labels as wavy waves in shadows of yellow and brown color with rectangles, circles and timeline ready for your text.
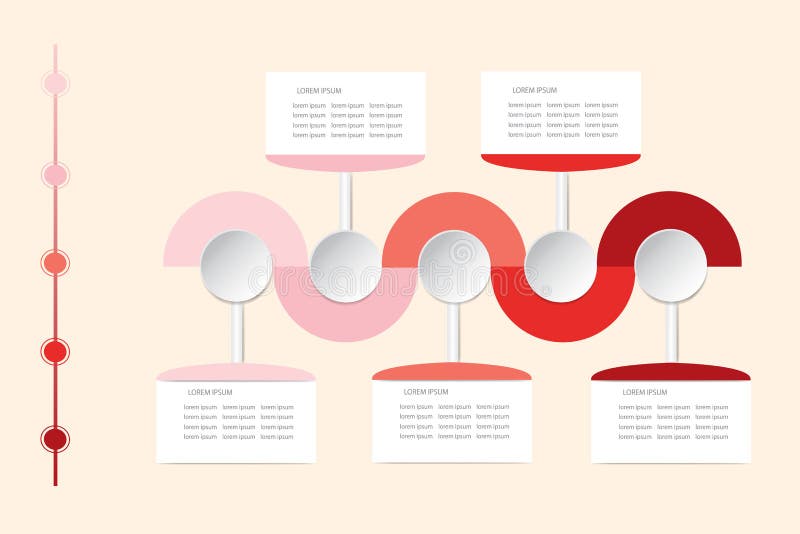
Free with trial Modern infographic labels as wavy waves in shadows of red color with rectangles, circles and timeline ready for your text. Wavy timeline vectors Modern infographic vector as wavy waves in shadows of red color. Modern infographic labels as wavy waves in shadows of red color with rectangles, circles and timeline ready for your text.
Free with trial Modern infographic labels as wavy waves in shadows of blue color with rectangles, circles and timeline ready for your text. Wavy timeline vectors Modern infographic vector as wavy waves in shadows of blue color. Modern infographic labels as wavy waves in shadows of blue color with rectangles, circles and timeline ready for your text.
Free with trial Winding 3d road with pins. Business journey map infographic, wavy way in perspective view. Abstract travel street, workflow process chart, timeline. Vector flowchart templates. Wavy timeline vectors Winding 3d road with pins. Business journey map infographic, wavy way in perspective view. Abstract travel street, workflow
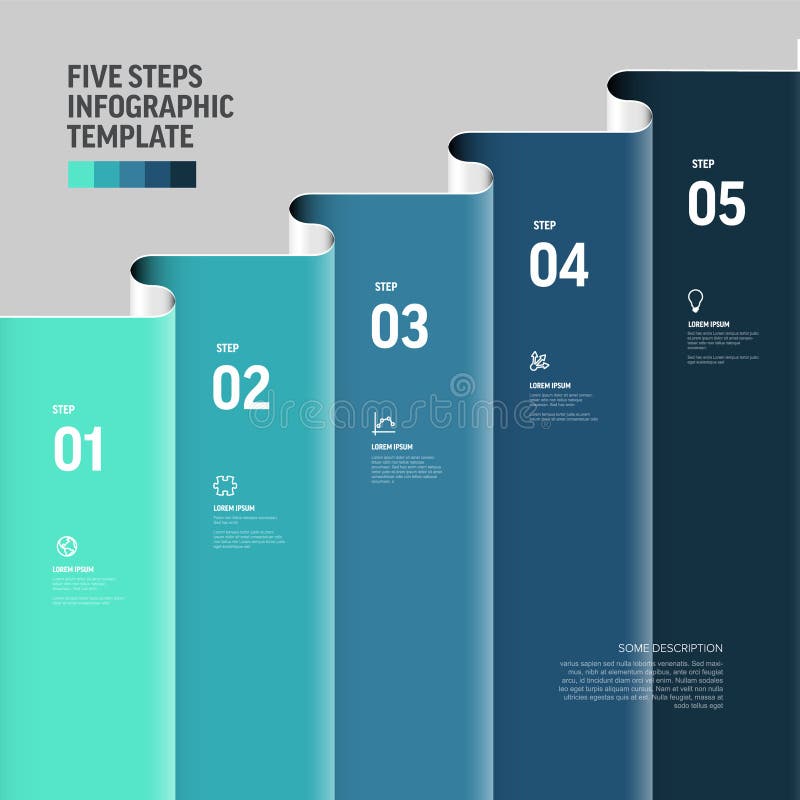
Free with trial Five steps infographic template, perfect for presenting five steps processes or a timeline. Five steps infographic template with modern design and wavy elements suitable for various presentations. Wavy timeline vectors Five Steps Infographic Template with Wavy Design and Gradient Colors. Five steps infographic template, perfect for presenting five steps processes or a timeline. Five steps infographic template with modern design and wavy elements suitable for various presentations
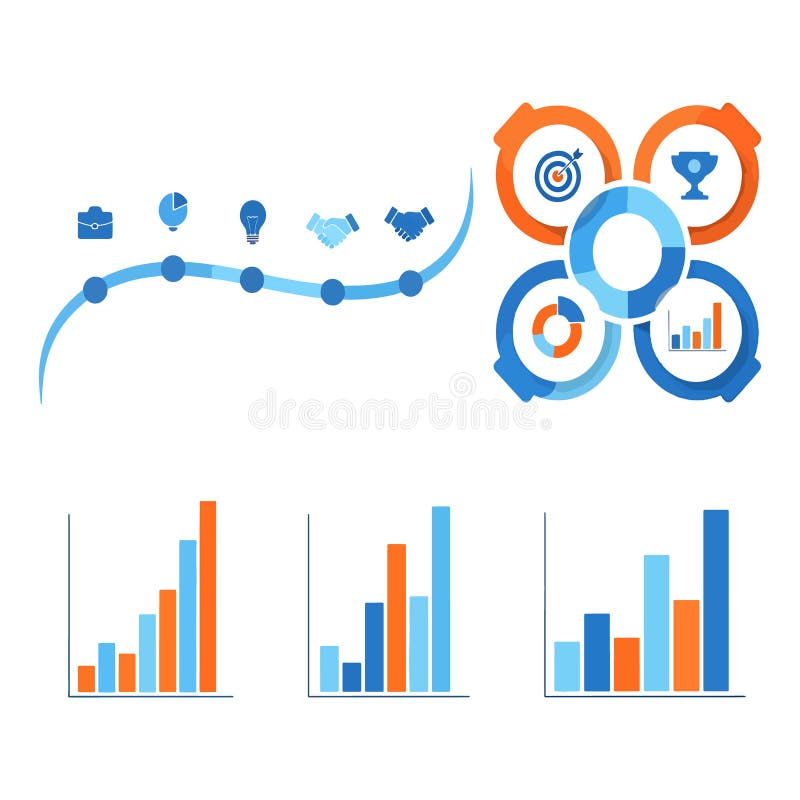
Free with trial This image displays a set of professional business infographic elements, including a wavy timeline with various icons representing business stages, a circular hub-and-spoke diagram featuring targets and trophies, and three distinct bar charts showing different data sets in blue and orange color palettes. Wavy timeline vectors A comprehensive collection of business infographic elements featuring growth charts and metrics. This image displays a set of professional business infographic elements, including a wavy timeline with various icons representing business stages, a circular hub-and-spoke diagram featuring targets and trophies, and three distinct bar charts showing different data sets in blue and orange color palettes.
Free with trial Timeline vector made of 3d standing, colorful signs with 12 months connected by a wavy line and space for text on a subtle gradient background made in illustrator. Wavy timeline vectors Timeline Vector Months Jan to Dec 3d Shapes Infographic. Timeline vector made of 3d standing, colorful signs with 12 months connected by a wavy line and space for text on a subtle gradient background made in illustrator
Free with trial Color vertical timeline with wavy curves template on white background. Simple minimalistic colorful vertical time line layout design template. Wavy timeline vectors Color vertical timeline with wavy curves template
Free with trial Color horizontal timeline with wavy curves template on white background. Simple minimalistic colorful vertical time line layout design template. Wavy timeline vectors Color horizontal timeline with wavy curves template
Free with trial Color horizontal timeline with wavy curves template on dark gray background. Simple minimalistic colorful vertical time line layout design template. Wavy timeline vectors Color horizontal timeline with wavy curves template on dark background. Color horizontal timeline with wavy curves template on dark gray background. Simple minimalistic colorful vertical time line layout design template
Free with trial A minimalistic timeline illustration depicting historical progress. It features a wavy line with icons representing various technological and architectural advancements. From left to right: Egyptian pyramids, Roman aqueducts, a wheel, a factory, an atomic model, a computer, and a WiFi symbol. Each icon is evenly spaced along the curve, symbolizing different eras of human development, including ancient, industrial, and digital ages. The background is white, emphasizing the clean and simple depiction of historical evolution. Wavy timeline illustrations A minimalistic timeline illustration depicting historical progress
Free with trial Linear infographic timeline design featuring a wavy road, milestones, and a colorful, professional theme. Ideal for presentations, business plans, and project visualizations. Wavy timeline vectors Linear infographic timeline design featuring a wavy road, milestones, and a colorful, professional theme. Ideal for presentations
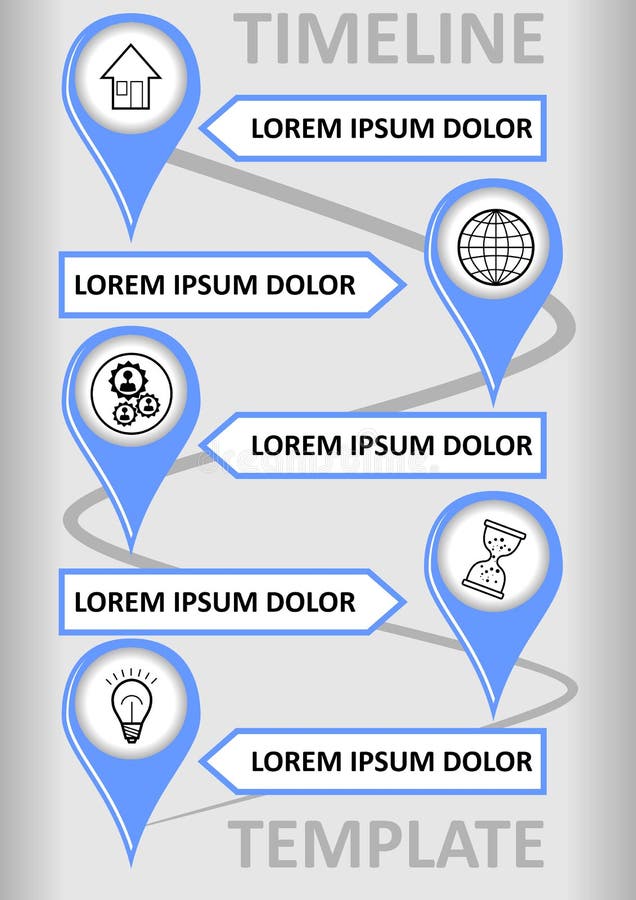
Free with trial Modern infographic timeline template with place markers on the wavy path, text boxes for custom captions. Modern simple design, blue marks on the background with light gray gradient. Vector infographic template. Wavy timeline vectors Modern infographic timeline template with place markers on the wavy path, text boxes for custom captions. Modern simple
Free with trial Infographic Roadmap with Wavy Path Design and Colorful Timeline Steps Vector Illustration. Wavy timeline vectors Infographic Roadmap Illustration with Wavy Path Design and Colorful Timeline Steps. Infographic Roadmap with Wavy Path Design and Colorful Timeline Steps Vector Illustration
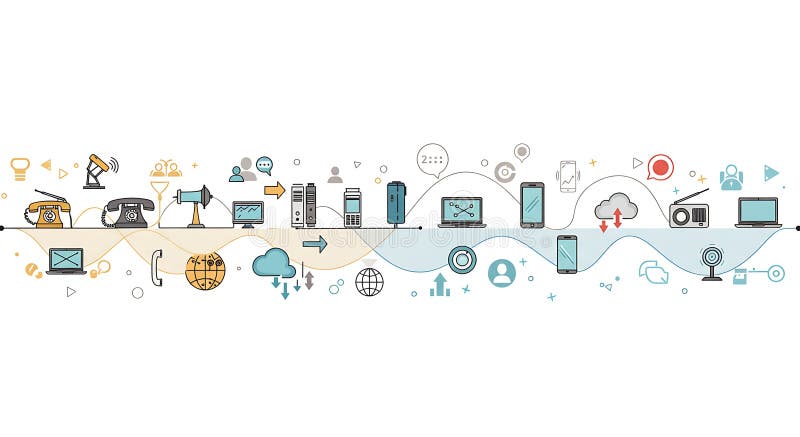
Free with trial A timeline illustration depicting the evolution of communication technology. It features hand-drawn icons of devices from different eras, including a telegram, rotary phone, radio, modern smartphones, tablets, and laptops. The sequence illustrates technological advancement, with arrows indicating progression. Various elements represent internet and cloud connectivity, such as globes, servers, and cloud icons. Light bulb and satellite dish icons symbolize innovation and broadcasting. The design uses a muted color palette with blue, yellow, and gray tones, arranged in a dynamic wavy pattern. Wavy timeline illustrations A timeline illustration depicting the evolution of communication technology. It
Free with trial A vibrant digital timeline visualizes the journey from past to future, with a glowing wavy line connecting diverse technology icons on a dark, abstract background, symbolizing progress. Wavy timeline illustrations Dynamic Digital Timeline - Wavy Data Flow from Past to Future with Luminous Technology Icons on Dark Background. A vibrant digital timeline visualizes the journey from past to future, with a glowing wavy line connecting diverse technology icons on a dark, abstract background, symbolizing progress
Free with trial Railway journey infographic template. Vector wavy train tracks with location pins, symbolizing route map, travel timeline, and railroad transportation navigation concept. Wavy timeline vectors Railway journey infographic template. Vector wavy train tracks with location pins, symbolizing route map, travel
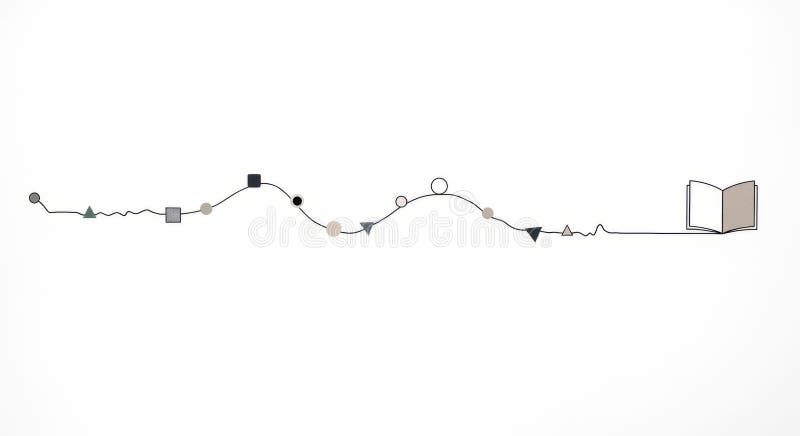
Free with trial A minimalist vector illustration depicting an abstract learning or development journey. A continuous black line forms a wavy path, marked by various geometric shapes like circles, squares, and triangles in shades of grey and black. This visual timeline represents progression, steps, or stages, culminating in an open book icon on the right, symbolizing knowledge, education, or the completion of a learning process. The clean design and ample white space make it suitable for infographics, educational materials, presentations, or illustrating concepts of growth and discovery. Wavy timeline illustrations Abstract Learning Journey Timeline with Geometric Shapes. A minimalist vector illustration depicting an abstract learning or development journey. A continuous black line forms a wavy path, marked by various geometric shapes like circles, squares, and triangles in shades of grey and black. This visual timeline represents progression, steps, or stages, culminating in an open book icon on the right, symbolizing knowledge, education, or the completion of a learning process. The clean design and ample white space make it suitable for infographics, educational materials, presentations, or illustrating concepts of growth and discovery.
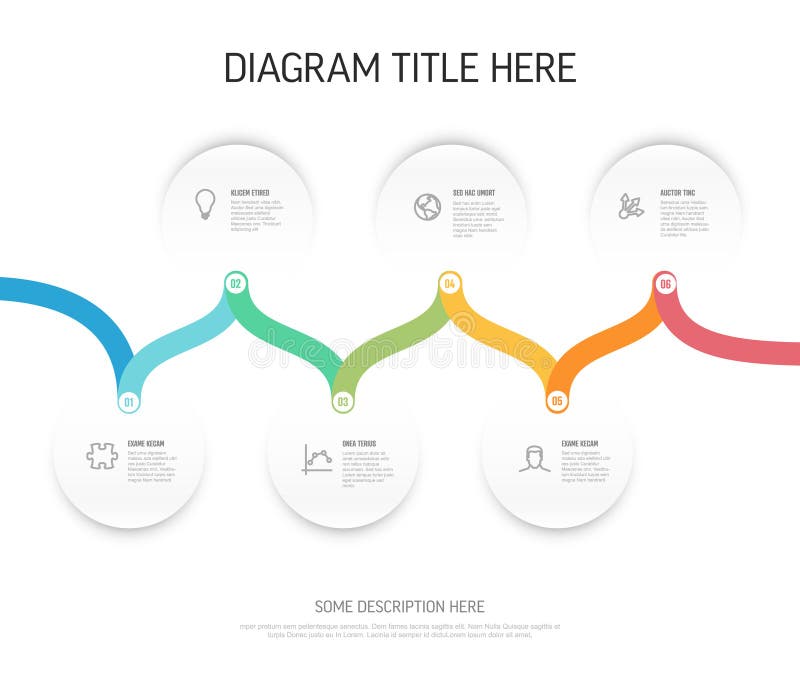
Free with trial A modern timeline diagram infographic with a wavy path connecting six circular elements. This infographic timeline visually represents a process or sequence of events with distinct stages. Wavy timeline vectors Modern Timeline Diagram Infographic with Wavy Path. A modern timeline diagram infographic with a wavy path connecting six circular elements. This infographic timeline visually represents a process or sequence of events with distinct stages
Free with trial Infographic template featuring wavy, colorful design elements with embedded icons and text placeholders, ideal for presenting information. Perfect for various business and educational presentations. Wavy timeline vectors Creative Infographic Template with Wavy Colorful Elements and Icons. Infographic template featuring wavy, colorful design elements with embedded icons and text placeholders, ideal for presenting information. Perfect for various business and educational presentations
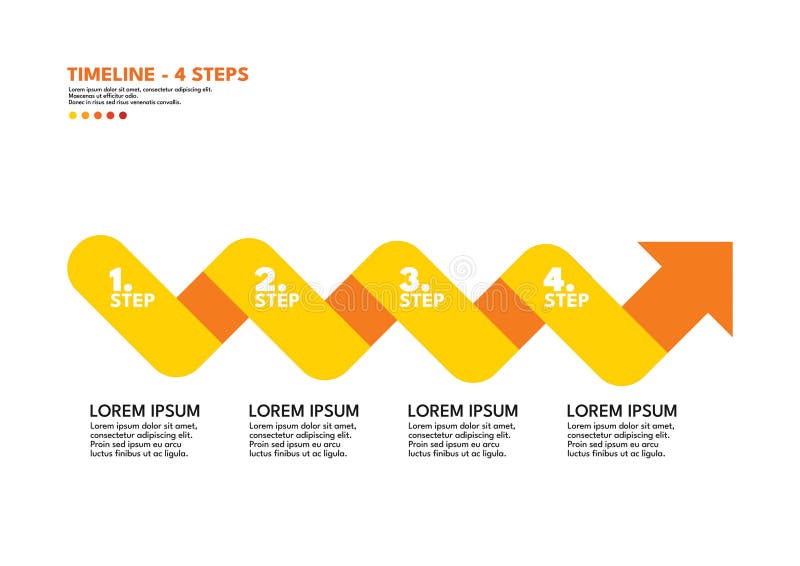
Free with trial Four steps timeline infographic with a wavy path design. Modern flat vector template showing sequential process or workflow with colorful markers and icons along a curved line. Suitable for business presentation, project planning, milestones, or progress visualization. Clean and minimal infographic layout. Wavy timeline vectors Timeline 4 steps wave path infographic template. Four steps timeline infographic with a wavy path design. Modern flat vector template showing sequential process or workflow with colorful markers and icons along a curved line. Suitable for business presentation, project planning, milestones, or progress visualization. Clean and minimal infographic layout.
Free with trial Wavy highway flat line illustration. Vector outline pictogram of horizontal winding asphalt road with yellow dashed lane markings, symbolizing seamless travel route and journey path. Wavy timeline vectors Wavy highway flat line illustration. Vector outline pictogram of horizontal winding asphalt road with yellow dashed lane
Free with trial Clean and modern timeline infographic showcasing a process flow. This versatile timeline diagram visually represents sequence of events or steps. Wavy timeline vectors Timeline Infographic Design with Numbered Steps and Wavy Flow. Clean and modern timeline infographic showcasing a process flow. This versatile timeline diagram visually represents sequence of events or steps