Royalty-Free AI generated

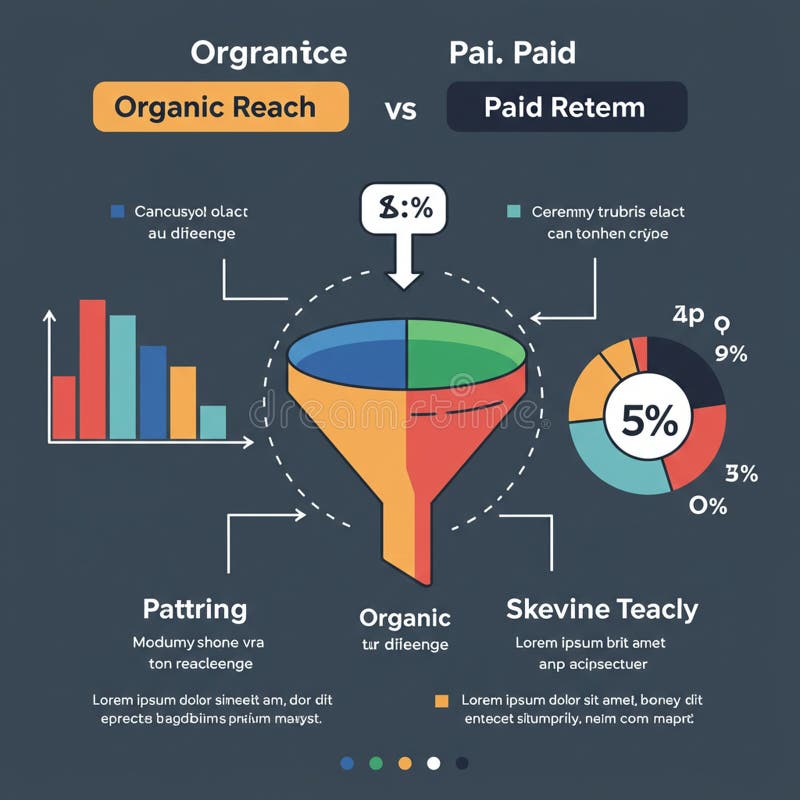
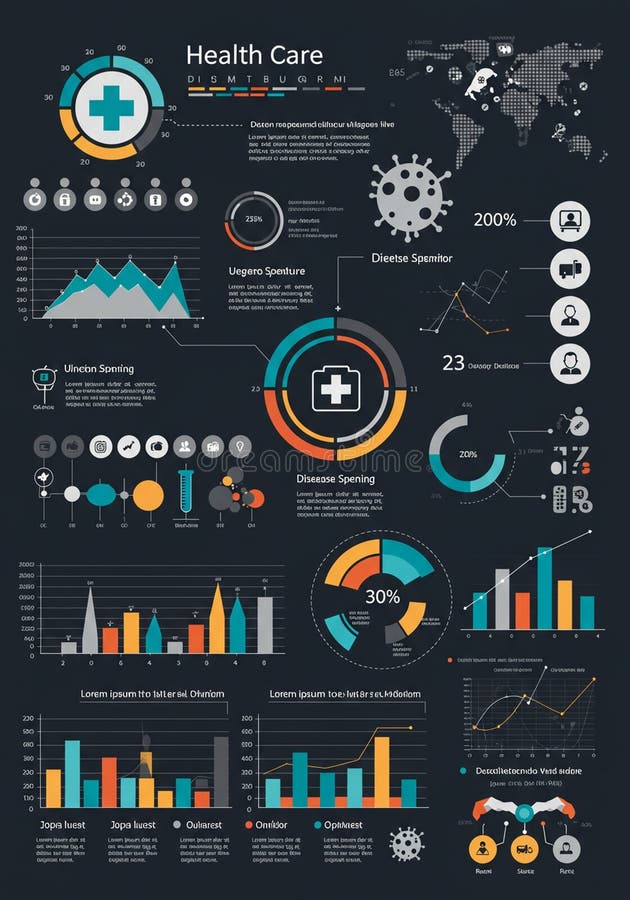
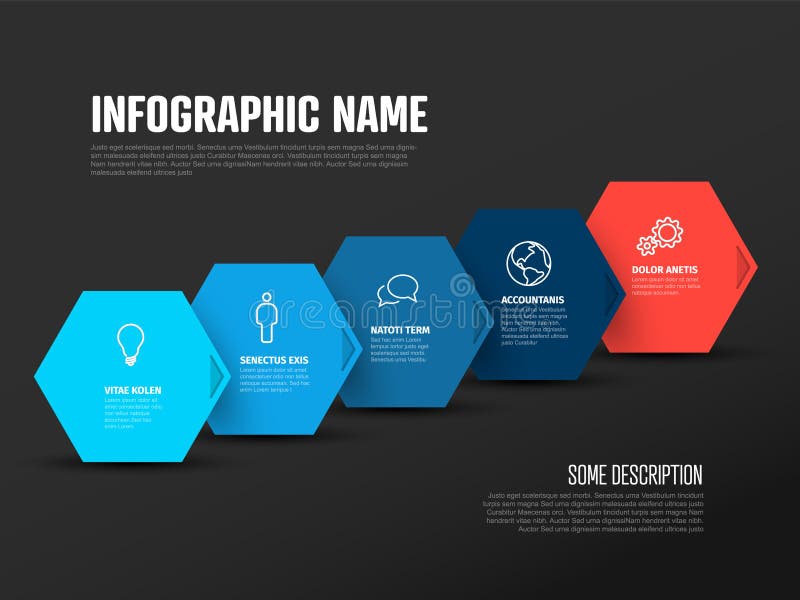
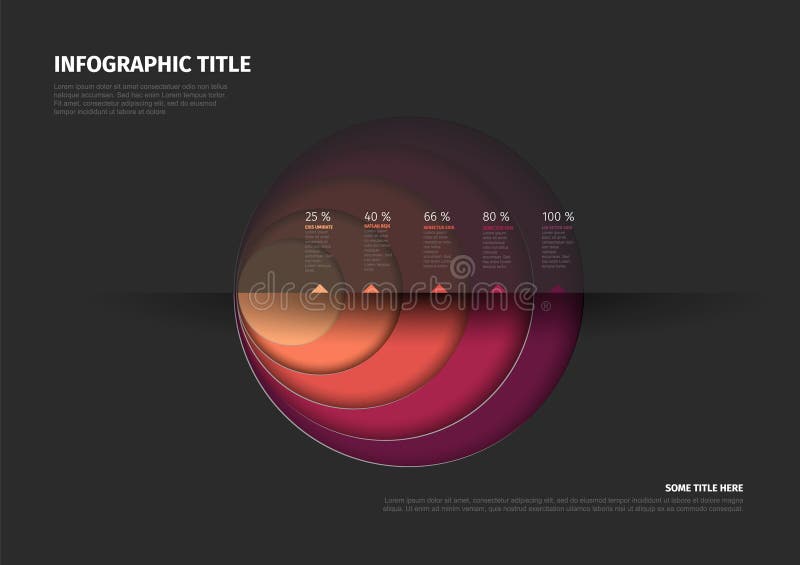
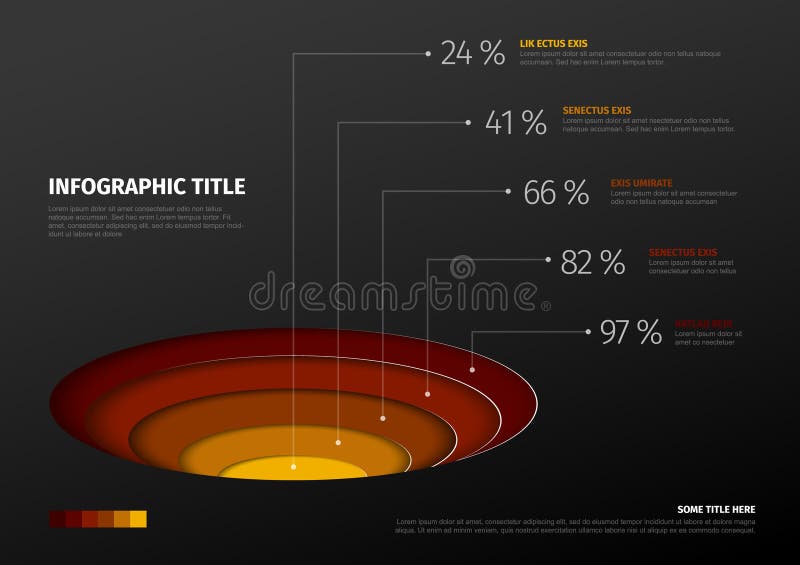
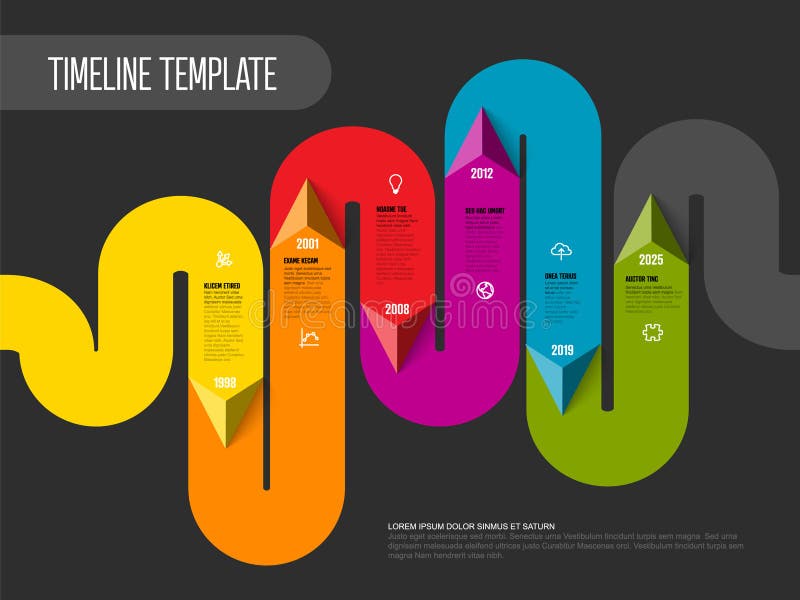
An infographic with a dark background displaying various data visualizations. At the top is a 3D pie chart with segments in orange, red, and teal, labeled with numerical values. Below, colorful bar graphs and circular icons represent different data metrics. Circular progress charts and line graphs are included, with placeholder text labels. The layout combines charts, graphs, and icons to convey statistical information visually.
Exclusively on Dreamstime
- ?
$62.50USD
$150.00USD
$250.00USD
Size MAX
4473x8200px •
14.9" x 27.3" • @300dpi •
6.3MB • jpg
Author credit line
Image keywords
More similar stock illustrations


More stock photos from Mahir Hussain's portfolio