Free with trial Simple Set of Measure Related Vector Line Icons. Contains such Icons as Radius, Diameter, Depth, Axis, Area and more. Editable Stroke. 48x48 Pixel Perfect. Axis area vectors Line Measure Icons. Simple Set of Measure Related Vector Line Icons. Contains such Icons as Radius, Diameter, Depth, Axis, Area and more. Editable Stroke. 48x48. Simple Set of Measure Related Vector Line Icons. Contains such Icons as Radius, Diameter, Depth, Axis, Area and more. Editable Stroke. 48x48 Pixel Perfect.
Free with trial Geometry math theory and mathematical formula doodle handwriting icon in white background with hand drawn geometric model used for school education and document decoration, create by vector. Axis area vectors Geometry math theory and mathematical formula doodle handwriting. Icon in white background with hand drawn geometric model used for school education and. Geometry math theory and mathematical formula doodle handwriting icon in white background with hand drawn geometric model used for school education and document decoration, create by vector
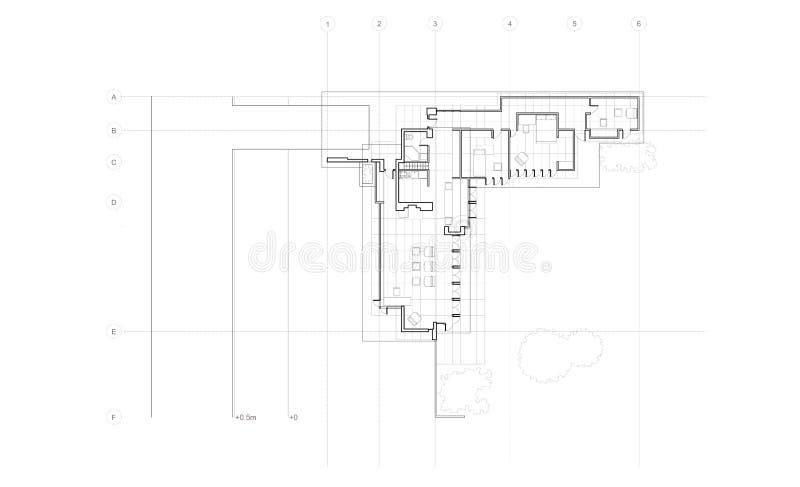
Free with trial Jacobs House Detailed Plan. Very Detailed plan of the modern house (Jacobs' House) for the architect Frank Lloyd Wright. Axis area vectors Jacobs House Detailed Plan. Very Detailed plan of the modern house (Jacobs' House) for the architect Frank Lloyd Wright
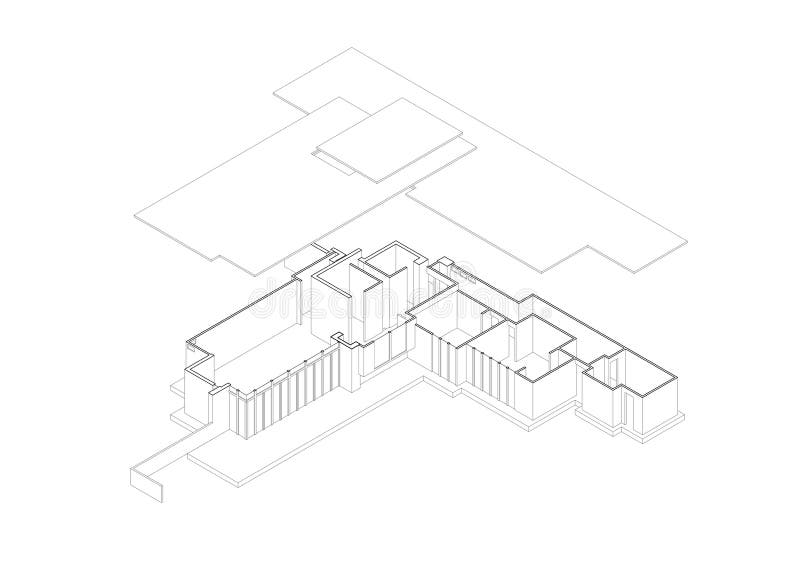
Free with trial Jacobs' House Exploded Isometric Drawing that illustrate the interior divisions in an artistic way, this house is designed by the famous architect Frank Lloyd Wright. Axis area vectors Jacobs' House Exploded Isometric Drawing. That illustrate the interior divisions in an artistic way, this house is designed by the famous architect Frank Lloyd
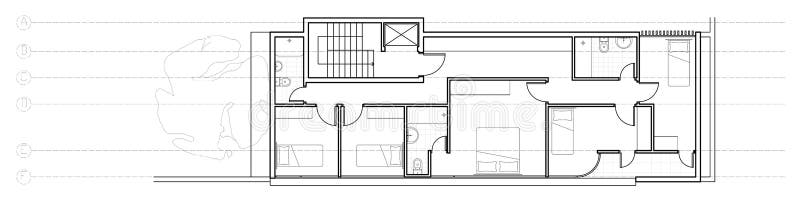
Free with trial Modern house second floor plan. Plan of the second floor of a modern house that contains 5 rooms and 3 toilets. Axis area vectors Modern house second floor plan. Plan of the second floor of a modern house that contains 5 rooms and 3 toilets
Free with trial Focal length and angle of view guide. On white. Axis area vectors Focal length and angle of view guide. On white
Free with trial Lens focal length vector flat illustrations. Different focal distances vector table, focal length, area captured by DSLR, SLR cameras. Lens with a long focal length. Axis area vectors Lens focal length on white background. Lens focal length vector flat illustrations. Different focal distances vector table, focal length, area captured by DSLR. Lens focal length vector flat illustrations. Different focal distances vector table, focal length, area captured by DSLR, SLR cameras. Lens with a long focal length.
Free with trial Wind farm is a series of wind generators set in the area to provide people with renewable green energy. Sketch style drawing isolated on a white background. EPS10 vector illustration. Axis area vectors Wind farm is a series of wind generators set in the area to provide people with renewable green energy. Sketch style drawing isolated on a white background
Free with trial Focal length and angle of view. Guide. Axis area vectors Focal length and angle of view. Guide
Free with trial Vector mathematical icons. In white background, isolated. Axis area vectors Vector mathematical icons. In white background, isolated
Free with trial Kepler's laws of planetary motion. Set of three diagrams. The orbit of a planet is an ellipse with the Sun. Vector illustration. Axis area vectors Kepler\'s laws of planetary motion. Kepler's laws of planetary motion. Set of three diagrams. The orbit of a planet is an ellipse with the Sun. Vector. Kepler's laws of planetary motion. Set of three diagrams. The orbit of a planet is an ellipse with the Sun. Vector illustration
Free with trial Measure symbols flat line icons set. Contains such icons as Radius, Diameter, Depth, Axis, Area and more. Simple flat vector illustration for web site or mobile app. Axis area vectors Measure symbols flat line icons set. Contains such icons as Radius, Diameter, Depth, Axis, Area and more. Simple flat vector. Illustration for web site or
Free with trial Coriolis effect. Earth with continents, equator, axis and arrows that show direction of rotation, Actual and Expected path. vector illustration. Axis area vectors Coriolis effect. Earth with continents, equator, axis and arrows that show direction of rotation, Actual and Expected path. Vector illustration
Free with trial Area under a curve. In mathematical graph. Axis area vectors Area under a curve. In mathematical graph
Free with trial Axis icon vector isolated on white background for your web and mobile app design, Axis logo concept. Axis area vectors Axis icon vector sign and symbol isolated on white background, A. Axis icon vector isolated on white background for your web and mobile app design, Axis logo. Axis icon vector isolated on white background for your web and mobile app design, Axis logo concept
Free with trial Grid, Graph, Drawing, area, software Icons. Flat and Line Filled Icon Set Vector Blue Background. Axis area vectors Grid, Graph, Drawing, area, software Icons. Flat and Line Filled Icon Set Vector Blue Background
Free with trial Axis icon in different style vector illustration. two colored and black axis vector icons designed in filled, outline, line and stroke style can be used for web, mobile, ui. Axis area vectors Axis icon in different style vector illustration. two colored and black axis vector icons designed in filled, outline, line and. Stroke style can be used for
Free with trial Size flexible ruler line measure icon. Distance ruler area distance metric vector thin scale icon. Axis area vectors Size flexible ruler line measure icon. Distance ruler area distance metric vector thin scale icon.
Free with trial Grid, Graph, Drawing, area, software turquoise highlight circle point Vector icon. Axis area vectors Grid, Graph, Drawing, area, software turquoise highlight circle point Vector icon
Free with trial Measurement and dimension glyph icon set. Ruler, 3D axis, width, height, diameter minimal vector illustrations. Simple silhouette signs for geometry size tools. Black color. Axis area vectors Measurement and dimension glyph icon set. Ruler, 3D axis, width, height, diameter minimal vector illustrations. Simple silhouette. Signs for geometry size tools
Free with trial Mountain biomes with altitude and merriams life zones axis outline diagram. Educational climate and flora ecosystem description with labeled educational arizona vegetation types vector illustration. Axis area vectors Mountain biomes with altitude and merriams life zones axis outline diagram. Educational climate and flora ecosystem description with labeled educational
Free with trial Mathematical poster explaining CUBE (Regular Hexahedron) with formulas for volume and surface area + 4 wireframe models. Axis area vectors Mathematical poster explaining CUBE with formulas for volume and. Mathematical poster explaining CUBE (Regular Hexahedron) with formulas for volume and surface. Mathematical poster explaining CUBE (Regular Hexahedron) with formulas for volume and surface area + 4 wireframe models
Free with trial Cyclone and anticyclone difference. Atmospheric pressure. Meteorology. Weather phenomenon. Vector illustration. Axis area vectors Cyclone and anticyclone difference. Atmospheric pressure. Meteorology. Weather phenomenon. Vector illustration
Free with trial Equal Rolled Steel angle. Generic dimensions and properties of equal rolled steel angle isolated on white background. Axis area vectors Equal Rolled Steel angle. Generic dimensions and properties of equal rolled steel angle isolated on white background
Free with trial Size and distance, length and width, depth measure, scaling arrows, measurement guide line icon set. Pointers and tape, ruler with scales thin black and red outline symbols vector illustration. Axis area vectors Size and distance, length and width, depth measure, scaling arrows line icon set. Size and distance, length and width, depth measure, scaling arrows, measurement. Size and distance, length and width, depth measure, scaling arrows, measurement guide line icon set. Pointers and tape, ruler with scales thin black and red outline symbols vector illustration
Free with trial Math graph with red and blue curves, sine function y sin x and cosine function y cos x. Trigonometric functions, sine and cosine wave isolated on a white background. Axis area vectors Mathematical graph with red and blue curves, sine function y sin x and cosine function y cos x. Math graph with red and blue curves, sine function y sin x and. Math graph with red and blue curves, sine function y sin x and cosine function y cos x. Trigonometric functions, sine and cosine wave isolated on a white background.
Free with trial Mathematical graph with blue curve, sine function y sin x. Trigonometric functions, sinage. Vector is isolated on a white background. Axis area vectors Mathematical graph with blue curve, sine function y sin x. Trigonometric functions, sinage. Vector is isolated on a white background
Free with trial Neurochemical pathway in the brain anatomical poster. Serotonin, dopamine, acetylcholine and norepinephrine diagram. Neural activity in human body. Neurotransmitter function flat vector illustration. Axis area vectors Neurochemical pathway diagram. Neurochemical pathway in the brain anatomical poster. Serotonin, dopamine, acetylcholine and norepinephrine diagram. Neural. Neurochemical pathway in the brain anatomical poster. Serotonin, dopamine, acetylcholine and norepinephrine diagram. Neural activity in human body. Neurotransmitter function flat vector illustration.
Free with trial Neurochemical pathway in the brain anatomical poster. Serotonin, dopamine, acetylcholine and norepinephrine diagram. Neural activity in human body. Neurotransmitter function flat vector illustration. Axis area vectors Neurochemical pathway diagram. Neurochemical pathway in the brain anatomical poster. Serotonin, dopamine, acetylcholine and norepinephrine diagram. Neural. Neurochemical pathway in the brain anatomical poster. Serotonin, dopamine, acetylcholine and norepinephrine diagram. Neural activity in human body. Neurotransmitter function flat vector illustration.
Free with trial The road markings in three lines and double yellow. Vector illustration. Axis area vectors Road markings in three lines. The road markings in three lines and double yellow. Vector illustration. The road markings in three lines and double yellow. Vector illustration.
Free with trial The road markings in three lines and double yellow. Vector illustration. Axis area vectors Road markings in three lines. The road markings in three lines and double yellow. Vector illustration. The road markings in three lines and double yellow. Vector illustration.
Free with trial Measuirng related vector icon set. Well-crafted sign in thin line style with editable stroke. Vector symbols isolated on a white background. Simple pictograms. Axis area vectors Measuirng related vector icon set. Well-crafted sign in thin line style with editable stroke. Vector symbols isolated on a white background. Simple pictograms
Free with trial Measuring icon or logo in modern line style. High quality black outline pictogram for web site design and mobile apps. Vector illustration on a white background. Axis area vectors Measuring icon or logo in modern line style. High quality black outline pictogram for web site design and mobile apps. Vector illustration on a white
Free with trial Neurochemical pathway in the brain anatomical poster. Serotonin, dopamine, acetylcholine and norepinephrine diagram. Neural activity in human body. Neurotransmitter function flat vector illustration. Axis area vectors Neurochemical pathway diagram. Neurochemical pathway in the brain anatomical poster. Serotonin, dopamine, acetylcholine and norepinephrine diagram. Neural. Neurochemical pathway in the brain anatomical poster. Serotonin, dopamine, acetylcholine and norepinephrine diagram. Neural activity in human body. Neurotransmitter function flat vector illustration.
Free with trial Measuring icon or logo in modern line style. High quality black outline pictogram for web site design and mobile apps. Vector illustration on a white background. Axis area vectors Measuring icon or logo in modern line style. High quality black outline pictogram for web site design and mobile apps. Vector illustration on a white
Free with trial Measuring icon or logo in modern line style. High quality black outline pictogram for web site design and mobile apps. Vector illustration on a white background. Axis area vectors Measuring icon or logo in modern line style. High quality black outline pictogram for web site design and mobile apps. Vector illustration on a white
Free with trial Measure icon vector isolated on white background for your web and mobile app design, Measure logo concept. Axis area vectors Measure icon vector sign and symbol isolated on white background. Measure icon vector isolated on white background for your web and mobile app design, Measure. Measure icon vector isolated on white background for your web and mobile app design, Measure logo concept
Free with trial Measure icon vector isolated on white background for your web and mobile app design, Measure logo concept. Axis area vectors Measure icon vector sign and symbol isolated on white background. Measure icon vector isolated on white background for your web and mobile app design, Measure. Measure icon vector isolated on white background for your web and mobile app design, Measure logo concept
Free with trial Measuring tape thin line icon set. Measuring tape icon set on white background. Eps 10 stock vector. Axis area vectors Measuring tape thin line icon set. Measuring tape icon set on white background. Eps 10 stock vector
Free with trial Measuirng related vector icon set. Well-crafted sign in thin line style with editable stroke. Vector symbols isolated on a white background. Simple pictograms. Axis area vectors Measuirng related vector icon set. Well-crafted sign in thin line style with editable stroke. Vector symbols isolated on a white background. Simple pictograms
Free with trial Lens focal length icon set. Camera lens symbol collection. Lens focal length icon set on white background. Axis area vectors Lens focal length icon set. Camera lens symbol collection. Lens focal length icon set on white background. Camera lens symbol collection
Free with trial Measure precision icons set, simple style. Measure precision icons set. Simple illustration of 16 measure precision vector icons for web. Axis area vectors Measure precision icons set, simple style. Measure precision icons set. Simple illustration of 16 measure precision vector icons for web
Free with trial Icon set about length, weight and volume. Line icons on transparent background with editable stroke. Vector illustration. Axis area vectors Icon set about length, weight and volume. Line icons on transparent background with editable stroke. Vector illustration. Icon set about length, weight and
Free with trial Set of measuring icons in modern thin line style. High quality black outline measure symbols for web site design and mobile apps. Simple measuring pictograms on a white background. Axis area vectors Set of measuring icons in modern thin line style. High quality black outline measure symbols for web site design and mobile apps. Simple measuring pictograms
Free with trial Trigonometric Sin Cos Tan Function Graph Diagram. goniometric mathematical function sine, cosine, tangent graph wave vector. Illustration. Axis area vectors Trigonometric Sin Cos Tan Function Graph Diagram. goniometric mathematical function sine, cosine, tangent graph wave vector. Illustration
Free with trial Counting tools line icon concept. Counting tools vector linear illustration, sign, symbol. Axis area vectors Counting tools line icon concept. Counting tools vector linear illustration, symbol, sign. Counting tools line icon concept. Counting tools vector linear. Counting tools line icon concept. Counting tools vector linear illustration, sign, symbol
Free with trial Mathematical with Thin Line Shapes and trigonometry formula. Design Template Include Formula, Calculation, and Equation. Mathematical with Thin Line Shapes and. Axis area vectors Mathematical with Thin Line Shapes and trigonometry formula. Design Template Include Formula, Calculation, and Equation. Mathematical with Thin Line Shapes and
Free with trial Map of the city of Brasilia, capital of Brazil. Axis area vectors Map of the city of Brasilia, capital of Brazil. Vector map of the city of Brasilia, capital of Brazil
Free with trial Map of the city of Brasilia, capital of Brazil. Axis area vectors Map of the city of Brasilia, capital of Brazil. Vector map of the city of Brasilia, capital of Brazil
Free with trial Map of the city of Brasilia, capital of Brazil. Axis area vectors Map of the city of Brasilia, capital of Brazil. Vector map of the city of Brasilia, capital of Brazil
Free with trial A punched icon showing the area under a curve as a hatched region bounded below by the x-axis and on the sides by two vertical limit lines. Axis area vectors Area Under Curve Icon – Hatched Region Between Curve and X-Axis. A punched icon showing the area under a curve as a hatched region bounded below by the x-axis. A punched icon showing the area under a curve as a hatched region bounded below by the x-axis and on the sides by two vertical limit lines.
Free with trial Coordinates black icon. Geometry axis. Math space. Isolated on white background. Axis area vectors Coordinates black icon. Geometry axis. Math space. Isolated on white background
Free with trial A minimalist black and white line art icon depicting a parking space arrangement on a vertical axis. The design features six car symbols arranged in two columns, creating a compact and modern visual representation of parking infrastructure. Axis area vectors Line Art Minimalist Icon of Car Parking Space Structure on Vertical Axis. A minimalist black and white line art icon depicting a parking space arrangement on a. A minimalist black and white line art icon depicting a parking space arrangement on a vertical axis. The design features six car symbols arranged in two columns, creating a compact and modern visual representation of parking infrastructure
Free with trial Medieval concentric labyrinth with four axis and single path. Known as Chartres pattern, appearing in manuscripts as early as the 9th century. Path starting at the bottom entrance to the center area. Axis area vectors Medieval concentric labyrinth with four axis and single path. Known as Chartres pattern, appearing in manuscripts as early as the 9th century. Path starting at
Free with trial Thermodynamic Work - a minimal icon showing how a gas transfers energy by changing its volume. Molecules trapped in a horizontal cylinder press outward on a sliding piston. As they expand, that plunger travels from a dashed start line to a new position, and an arrow above measures the displacement. Because the closed end sits directly over the origin of the graph below, every location maps straight onto a volume. Dashed guides drop from the initial and final faces to two marked states on a smooth isothermal curve, where pressure falls as space grows. Hatching fills the region between those states, down to the horizontal axis: this shaded area is W ∫P dV, the work done by the gas on its surroundings. Car engines, steam turbines, jet compressors and refrigerators all depend on such exchanges. Drawn as one clean punched silhouette in cyan on deep teal, it stays crisp at any scale. Axis area vectors Thermodynamic Work Physics Vector Icon Piston Expansion and Area Under PV Curve. Thermodynamic Work - a minimal icon showing how a gas transfers energy by. Thermodynamic Work - a minimal icon showing how a gas transfers energy by changing its volume. Molecules trapped in a horizontal cylinder press outward on a sliding piston. As they expand, that plunger travels from a dashed start line to a new position, and an arrow above measures the displacement. Because the closed end sits directly over the origin of the graph below, every location maps straight onto a volume. Dashed guides drop from the initial and final faces to two marked states on a smooth isothermal curve, where pressure falls as space grows. Hatching fills the region between those states, down to the horizontal axis: this shaded area is W ∫P dV, the work done by the gas on its surroundings. Car engines, steam turbines, jet compressors and refrigerators all depend on such exchanges. Drawn as one clean punched silhouette in cyan on deep teal, it stays crisp at any scale.
Free with trial Blue area chart showing data trends vector illustration. Business analytics, financial growth, market research, statistical reporting, data visualization, performance tracking. Wave graph showing. Axis area vectors Blue area chart showing data trends and fluctuations on a light background vector illustration. Blue area chart showing data trends vector illustration. Business. Blue area chart showing data trends vector illustration. Business analytics, financial growth, market research, statistical reporting, data visualization, performance tracking. Wave graph showing
Free with trial Snowflakes of various shapes and sizes are scattered across the top and bottom of a transparent background, simulating a gentle snowfall. The background features a checkered pattern, commonly used to indicate transparency in digital graphics. The snowflakes are white, intricately designed, and create a festive, wintry scene suitable for Christmas or winter themes. The design is symmetrical along the horizontal axis, framing the central area, which remains clear of any snowflakes. Axis area vectors Frosty snowflakes falling on transparent background winter snowfall for christmas snow scene. Snowflakes of various shapes and sizes are scattered across the top. Snowflakes of various shapes and sizes are scattered across the top and bottom of a transparent background, simulating a gentle snowfall. The background features a checkered pattern, commonly used to indicate transparency in digital graphics. The snowflakes are white, intricately designed, and create a festive, wintry scene suitable for Christmas or winter themes. The design is symmetrical along the horizontal axis, framing the central area, which remains clear of any snowflakes.
Free with trial Geometry construction app interface with triangle diagram, angle gauge, axis data, layered planes, logs, metrics, status. Charts, and dark neon UI. Axis area vectors Geometry construction app interface with triangle diagram, angle gauge, axis data, layered planes, logs, metrics, status. Charts, and dark neon UI
Free with trial Orange area chart showing data fluctuations vector illustration. Business analytics, financial reporting, market research, performance tracking, statistics, growth. Data visualization trends. Axis area vectors Business data visualization showing orange area chart with fluctuations and axes vector illustration for reports. Orange area chart showing data fluctuations. Orange area chart showing data fluctuations vector illustration. Business analytics, financial reporting, market research, performance tracking, statistics, growth. Data visualization trends
Free with trial Colorful lines creating a modern area chart illustrate financial performance trends against a gradient background, complemented by a dark gray x axis for a sleek, professional look. Axis area vectors Colorful lines creating a modern area chart illustrate financial performance trends against a gradient background. Complemented by a dark gray x axis for a. Colorful lines creating a modern area chart illustrate financial performance trends against a gradient background, complemented by a dark gray x axis for a sleek, professional look
Free with trial Minimalist Black Line Business Growth Area Chart Analytics Symbol Icon. Axis area vectors Minimalist black area chart symbol representing statistical performance, business progress, data analysis, and financial market. Minimalist Black Line Business. Minimalist Black Line Business Growth Area Chart Analytics Symbol Icon
Free with trial Integral using area formulas in mathematics. Axis area vectors Integral using area formulas in mathematics. Integral using area formulas of mathematics
Free with trial Area between two curves by integration. Mathematic theory of area between two curves by integration. Axis area vectors Area between two curves by integration. Mathematic theory of area between two curves by integration
Free with trial A vibrant, multi-colored area chart displaying data trends against a simple axis. The graphic features distinct vertical segments in rainbow-inspired colors, illustrating statistical distribution, growth, or comparative metrics. This clean, flat-design visual is ideal for business presentations, financial reports, educational materials, and digital infographics that require a clear and accessible representation of quantitative information and analytical concepts. Axis area vectors Colorful Area Chart Representing Data Trends and Statistical Analysis. A vibrant, multi-colored area chart displaying data trends against a simple axis. The. A vibrant, multi-colored area chart displaying data trends against a simple axis. The graphic features distinct vertical segments in rainbow-inspired colors, illustrating statistical distribution, growth, or comparative metrics. This clean, flat-design visual is ideal for business presentations, financial reports, educational materials, and digital infographics that require a clear and accessible representation of quantitative information and analytical concepts.
Free with trial Image of basic axis intersection for plotting chart on notebook sheet of checkered paper. School paper sheet lined in a cage with mathematical drawing of axis intersection. Simple vector. Axis area vectors Basic Axis Intersection For Plotting Chart. Image of basic axis intersection for plotting chart on notebook sheet of checkered paper. School paper sheet lined in. Image of basic axis intersection for plotting chart on notebook sheet of checkered paper. School paper sheet lined in a cage with mathematical drawing of axis intersection. Simple vector
Free with trial Image of connecting arcs along Y axis on notebook sheet of checkered paper. School paper sheet lined in a cage with mathematical drawing of connecting arcs. Simple black and white vector. Axis area vectors Connecting Arcs Along Y Axis On Notebook Sheet. Image of connecting arcs along Y axis on notebook sheet of checkered paper. School paper sheet lined in a cage. Image of connecting arcs along Y axis on notebook sheet of checkered paper. School paper sheet lined in a cage with mathematical drawing of connecting arcs. Simple black and white vector
Free with trial 3D axis coordinate system measurement modeling space XYZ tridimensional contour outline line icon black color vector illustration image thin flat style simple. Axis area vectors 3D axis coordinate system measurement modeling space XYZ tridimensional contour outline line icon black color vector illustration. Image thin flat style simple
Free with trial Size measurement symbols showing dimensions, geometry, area and object scaling for technical drafting, education and product specification black line icons set vector illustration. Axis area vectors Size Measurement Symbols and Dimension Tools. Size measurement symbols showing dimensions, geometry, area and object scaling for technical drafting, education. Size measurement symbols showing dimensions, geometry, area and object scaling for technical drafting, education and product specification black line icons set vector illustration
Free with trial Measurement and dimension line icon set. Ruler, 3D axis, width, height, diameter minimal vector illustrations. Simple outline signs for geometry size tools. Blue duotone color. Editable Stroke. Axis area vectors Measurement and dimension line icon set. Ruler, 3D axis, width, height, diameter minimal vector illustrations. Simple outline. Signs for geometry size tools. Measurement and dimension line icon set. Ruler, 3D axis, width, height, diameter minimal vector illustrations. Simple outline signs for geometry size tools. Blue duotone color. Editable Stroke.
Free with trial Measurement and dimension line icon set. Ruler, 3D axis, width, height, diameter minimal vector illustrations. Simple outline signs for geometry size tools. Blue color. Editable Stroke. Axis area vectors Measurement and dimension line icon set. Ruler, 3D axis, width, height, diameter minimal vector illustrations. Simple outline. Signs for geometry size tools. Measurement and dimension line icon set. Ruler, 3D axis, width, height, diameter minimal vector illustrations. Simple outline signs for geometry size tools. Blue color. Editable Stroke.
Free with trial Geometry analytical circle set equations radius diameter center coordinate distance tangent secant parametric standard general discriminant condition vector area circumference. Axis area vectors Geometry analytical circle set. Equations radius diameter center coordinate distance tangent secant parametric standard general discriminant condition vector
Free with trial A professional vector icon set featuring an axis graph displaying an upward curve arrow over a shaded area chart. This design represents exponential business growth, market trend analysis, sales revenue increase, financial performance analytics, and strategic corporate success. Includes line art, solid glyph, and modern blue two-tone flat color variations. Perfect for financial reporting software, stock market apps, business consulting, and analytics dashboards. Fully editable vector illustration. Axis area vectors Exponential Growth Chart and Market Trend Analysis Icon Set. A professional vector icon set featuring an axis graph displaying an upward curve arrow over a. A professional vector icon set featuring an axis graph displaying an upward curve arrow over a shaded area chart. This design represents exponential business growth, market trend analysis, sales revenue increase, financial performance analytics, and strategic corporate success. Includes line art, solid glyph, and modern blue two-tone flat color variations. Perfect for financial reporting software, stock market apps, business consulting, and analytics dashboards. Fully editable vector illustration.
Free with trial Exponential growth area chart showing upward financial trends. Business graph. With data points on a coordinate grid. Vector illustration. Axis area vectors Exponential growth area chart showing upward financial trends. Business graph. With data points on a coordinate grid. Vector illustration
Free with trial Dark blue blueprint interface background with perspective grid, empty data area, vector grid panel, node array, scale. Track, and data field chart. Axis area vectors Dark blue blueprint interface background with perspective grid, empty data area, vector grid panel, node array, scale. Track, and data field chart
Free with trial Simple Black Line Graph Icon with Wavy Trend Line and Axis. Axis area vectors A minimalist black icon representing a line graph with fluctuating data points and clearly defined axis lines, suitable for. Simple Black Line Graph Icon with. Simple Black Line Graph Icon with Wavy Trend Line and Axis
Free with trial A comprehensive set of eight distinct data visualization elements presented on a clean white background. The collection includes various line and area graphs depicting concepts like probability distribution, trends, and event expiry, some with shaded regions highlighting specific data points. Complementing these are detailed stopwatch icons with partial fill indicators and digital readouts, suggesting time-sensitive data or deadlines. This versatile vector illustration is ideal for business presentations, financial reports, statistical analysis, UI UX design, and any project requiring clear visual representation of data, time, or probability concepts. Axis area vectors Business Data Visualization Elements: Charts, Probability Graphs, and Timers. A comprehensive set of eight distinct data visualization elements presented on a. A comprehensive set of eight distinct data visualization elements presented on a clean white background. The collection includes various line and area graphs depicting concepts like probability distribution, trends, and event expiry, some with shaded regions highlighting specific data points. Complementing these are detailed stopwatch icons with partial fill indicators and digital readouts, suggesting time-sensitive data or deadlines. This versatile vector illustration is ideal for business presentations, financial reports, statistical analysis, UI UX design, and any project requiring clear visual representation of data, time, or probability concepts.
Free with trial A comprehensive collection of flat icons illustrating various data visualization concepts, including bar charts, line graphs, area charts, scatter plots, and distribution curves. The set features directional arrows symbolizing growth, trends, and strategic planning. Designed with a clean, modern aesthetic using a palette of blue, green, yellow, and orange, these icons are ideal for business presentations, financial reports, infographics, dashboards, and corporate branding materials. Axis area vectors Flat Icon Set of Business Charts and Growth Arrows. A comprehensive collection of flat icons illustrating various data visualization concepts, including bar. A comprehensive collection of flat icons illustrating various data visualization concepts, including bar charts, line graphs, area charts, scatter plots, and distribution curves. The set features directional arrows symbolizing growth, trends, and strategic planning. Designed with a clean, modern aesthetic using a palette of blue, green, yellow, and orange, these icons are ideal for business presentations, financial reports, infographics, dashboards, and corporate branding materials.
Free with trial This image was created using Generative AI. Abstract statistical graph with red blue and yellow layers indicating increasing values over time. Perfect for business presentations and financial analysis. Axis area vectors Multicolor Stacked Area Chart Showing Data Growth Trend Analysis. This image was created using Generative AI. Abstract statistical graph with red blue and yellow. This image was created using Generative AI. Abstract statistical graph with red blue and yellow layers indicating increasing values over time. Perfect for business presentations and financial analysis
Free with trial Image of circles connected on coordinate axis to form butterfly figure with wings on notebook sheet of checkered paper. School paper sheet lined in cage mathematical drawing of butterfly figure. Axis area vectors Circles Connected On Coordinate To Butterfly Form. Image of circles connected on coordinate axis to form butterfly figure with wings on notebook sheet of. Image of circles connected on coordinate axis to form butterfly figure with wings on notebook sheet of checkered paper. School paper sheet lined in cage mathematical drawing of butterfly figure
Free with trial Notice Turbine Area Private Property Symbol Sign ,Vector Illustration, Isolate On White Background Label. EPS10. Axis area vectors Notice Turbine Area Private Property Symbol Sign ,Vector Illustration, Isolate On White Background Label. EPS10. Notice Turbine Area Private Property Symbol Sign. Notice Turbine Area Private Property Symbol Sign ,Vector Illustration, Isolate On White Background Label.EPS10
 Sign in