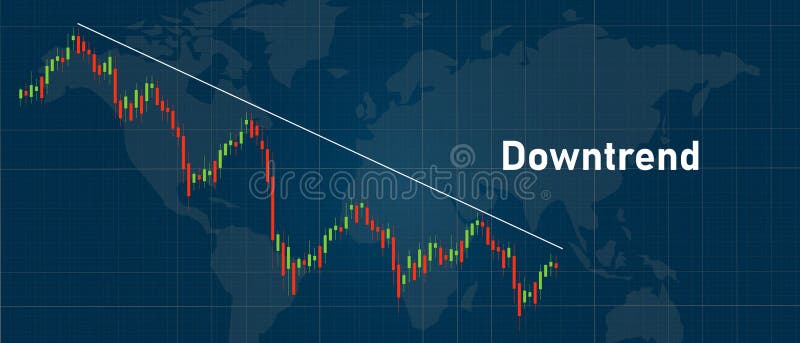
Free with trial Illustration of a bear market downtrend. Bearish vectors Bear Market in the Red. Illustration of a bear market downtrend. Illustration of a bear market downtrend.
Free with trial Bear Versus Bull Silhouette. A bear fighting a bull standing for the bears versus bulls stock market metaphor, in silhouette. Bearish vectors Bear Versus Bull Silhouette. A bear fighting a bull standing for the bears versus bulls stock market metaphor, in silhouette
Free with trial Bullish and Bearish symbols on stock market vector illustration. vector Forex or commodity charts, on abstract background. The sym. Bol of the the bull and bear. Bearish vectors Bullish and Bearish symbols on stock market vector illustration. vector Forex or commodity charts, on abstract background. The sym. Bol of the the bull and bear
Free with trial Artwork illustration depicts a graph to show the various emotions and feeling of people throughout the cycle in share market. Bearish vectors The Cycle of Stock Market Emotions. Artwork illustration depicts a graph to show the various emotions and feeling of people throughout the cycle in share market. Artwork illustration depicts a graph to show the various emotions and feeling of people throughout the cycle in share market.
Free with trial Trading background. Trading candles chart on a white background. Bearish vectors Trading background. Trading candles chart on a white background
Free with trial Vector black silhouette bull and bear financial icons depicting the market trends of stocks and shares on the bourse vector illustration isolated on white. Bearish vectors Vector bull and bear financial icons. Vector black silhouette bull and bear financial icons depicting the market trends of stocks and shares on the bourse vector. Vector black silhouette bull and bear financial icons depicting the market trends of stocks and shares on the bourse vector illustration isolated on white
Free with trial StockMarketConcept. Concept of stock market exchange or financial technology, polygon bull and bear with futuristic element. Bearish vectors StockMarketConcept. Concept of stock market exchange or financial technology, polygon bull and bear with futuristic element
Free with trial Stock market concept bull vs bear with up and down arrow. Bearish vectors Stock market concept bull vs bear with up and down arrow. Stock exchange market concept bull vs bear with up and down arrow
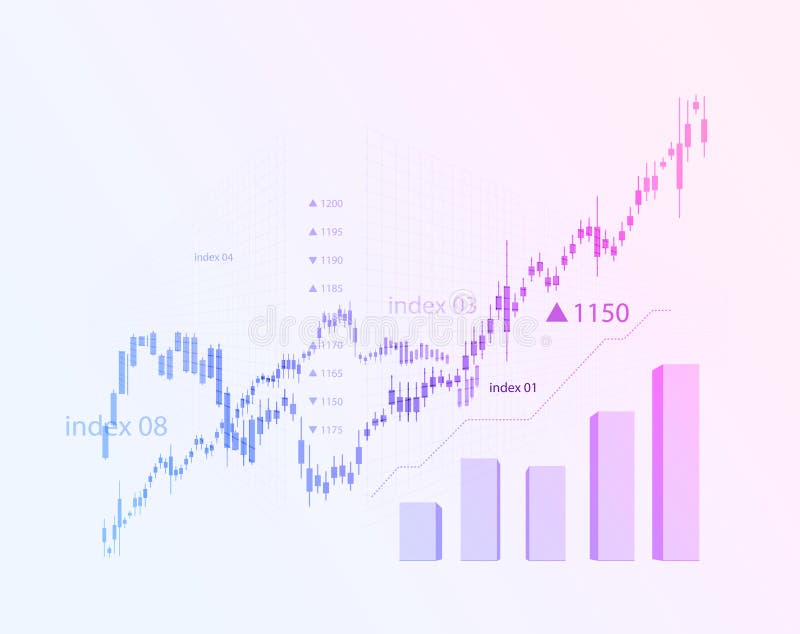
Free with trial Financial and business abstract background with candle stick graph chart. Stock market investment vector concept. Finance investment stock market exchange graph and chart illustration. Bearish vectors Financial and business abstract background with candle stick graph chart. Stock market investment vector concept. Finance investment stock market exchange
Free with trial Bull vs Bear Stock Exchange Concept Finance. Business Graph Vector Illustration. Bearish vectors Bull vs Bear Stock Exchange Concept Finance. Business Graph Vector Illustration
Free with trial Deal with Bearish Market. Detailed Vector Illustration. Bearish vectors Deal with Bearish Market. Detailed Vector Illustration
Free with trial Magnifying glass over bearish chart. Magnifying glass over bearish sentiment trade chart. Bearish vectors Magnifying glass over bearish chart. Magnifying glass over bearish sentiment trade chart
Free with trial Bullish and Bearish symbols on stock market vector illustration. vector Forex or commodity charts, on abstract background. The sym. Bol of the the bull and bear. Bearish vectors Bullish and Bearish symbols on stock market vector illustration. vector Forex or commodity charts, on abstract background. The sym. Bol of the the bull and bear
Free with trial Sensex down, stock market down bear market vector illustration concept, bearish graph, inflation graph vector. graph going down. Bearish vectors Sensex down, stock market down bear market vector illustration concept, bearish graph, inflation graph vector. Graph going down
Free with trial Bullish And Bearish Markets. Silhouette of a bull and a bear in front of trending arrows in between of them. Vector. Silhouette of. Bearish vectors Bullish And Bearish Markets. Silhouette of a bull and a bear in front of trending arrows in between of them. Vector. Bullish And Bearish Markets. Silhouette of
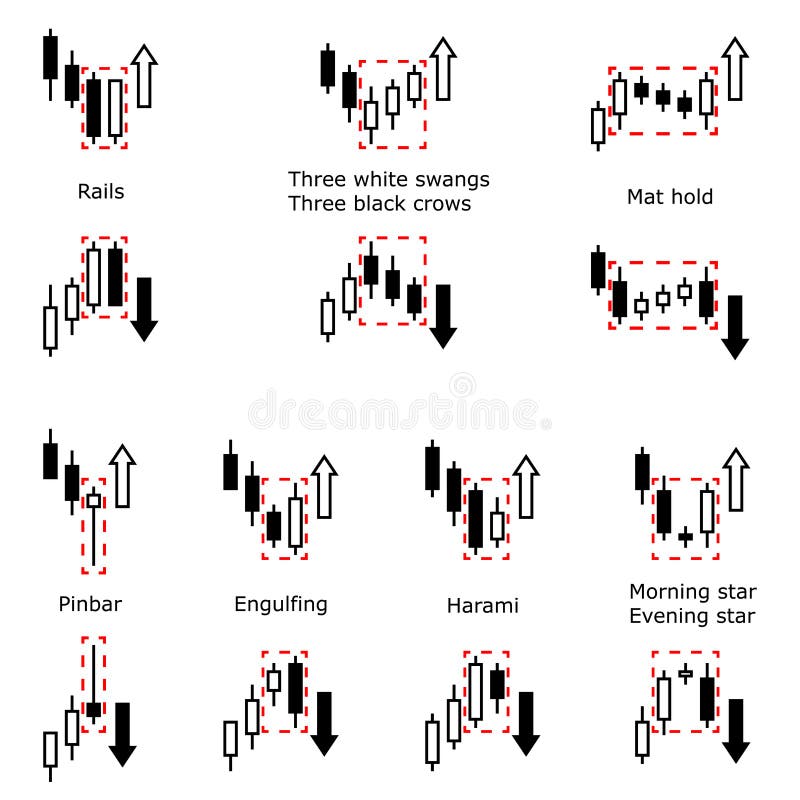
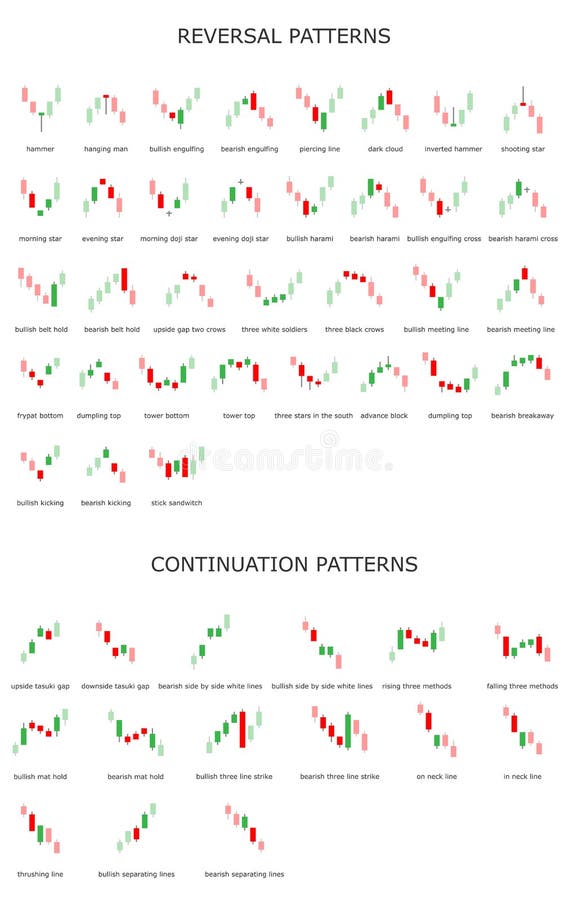
Free with trial Forex stock trading candle stick patterns and indicators collection. Dark cloud cover, Morning Doji star, Rising sun, Hanging man, Shooting star and other examples in bullish and bearish price swings. Bearish vectors Forex stock trading candle stick patterns vector collection. Forex stock trading candle stick patterns and indicators collection. Dark cloud cover, Morning Doji. Forex stock trading candle stick patterns and indicators collection. Dark cloud cover, Morning Doji star, Rising sun, Hanging man, Shooting star and other examples in bullish and bearish price swings
Free with trial Forex stock market investment trading concept, Candlestick pattern with bullish and bearish is a style of financial chart, Suitable for describe price movements of a security, derivative, or currency. Bearish vectors Forex stock market investment trading concept. Candlestick pattern with bullish and bearish is a style of financial chart, Suitable for describe price. Forex stock market investment trading concept, Candlestick pattern with bullish and bearish is a style of financial chart, Suitable for describe price movements of a security, derivative, or currency.
Free with trial Candlestick patterns is a style of financial chart, Suitable for forex stock market investment trading concept and used to describe price movements of a security, derivative, or currency. Bearish vectors Candlestick strategy indicator with bullish and bearish engulfing pattern. Candlestick patterns is a style of financial chart, Suitable for forex stock market. Candlestick patterns is a style of financial chart, Suitable for forex stock market investment trading concept and used to describe price movements of a security, derivative, or currency.
Free with trial Forex stock market investment trading concept, Candlestick pattern with bullish and bearish is a style of financial chart, Suitable for describe price movements of a security, derivative, or currency. Bearish vectors Forex stock market investment trading concept. Candlestick pattern with bullish and bearish is a style of financial chart, Suitable for describe price. Forex stock market investment trading concept, Candlestick pattern with bullish and bearish is a style of financial chart, Suitable for describe price movements of a security, derivative, or currency.
Free with trial Vector illustration ideal for printing on apparel clothes. Bearish vectors Dreamland. Vector illustration ideal for printing on apparel clothes. Vector illustration ideal for printing on apparel clothes .
Free with trial Breakdown. Conceptual breakdown chart isolated over white background. Bearish vectors Breakdown. Conceptual breakdown chart isolated over white background
Free with trial Bear market. A vector illustration of a bear chasing business people down the chart, can be used for bear market concept. Bearish vectors Bear market. A vector illustration of a bear chasing business people down the chart, can be used for bear market concept
Free with trial Trading on line. On lcd and white background. Bearish vectors Trading on line. On lcd and white background
Free with trial Cartoon funny bears. Vector illustration. Bearish vectors Cartoon funny bears. Vector illustration
Free with trial Stock Exchange low-poly wireframe vector illustration. Digital graphics. Technology art image of World or Stock Market. Bull and Bear with arrows. Finance and business concept. Bearish vectors Bull and bear stock Exchange low poly. Stock Exchange low-poly wireframe vector illustration. Digital graphics. Technology art image of World or Stock Market. Stock Exchange low-poly wireframe vector illustration. Digital graphics. Technology art image of World or Stock Market. Bull and Bear with arrows. Finance and business concept.
Free with trial Financial crisis, with fake financial news background. Bearish vectors Financial crisis. With fake financial news background
Free with trial Bear Versus Bull Silhouette Concept. A bear versus a bull standing for the bears versus bulls financial stock market metaphor. Bearish vectors Bear Versus Bull Silhouette Concept. A bear versus a bull standing for the bears versus bulls financial stock market metaphor
Free with trial Business symbols for economy situation. Bearish vectors Share market monitor. Business symbols for economy situation. Business symbols for economy situation.
Free with trial Bear Versus Bull Concept. A cartoon bear fighting a cartoon bull mascot character standing for the bears versus bulls stock market metaphor. Bearish vectors Bear Versus Bull Concept. A cartoon bear fighting a cartoon bull mascot character standing for the bears versus bulls stock market metaphor
Free with trial Set trading icons. On a white background. Bearish vectors Set trading icons. On a white background
Free with trial Bears Versus Bulls Stock Market Concept. A cartoon bear fighting a cartoon bull mascot character standing for the bears versus bulls stock market metaphor. Bearish vectors Bears Versus Bulls Stock Market Concept. A cartoon bear fighting a cartoon bull mascot character standing for the bears versus bulls stock market metaphor
Free with trial Stock market concept bull and bear. Are facing. Bearish vectors Stock market concept bull and bear. Are facing
Free with trial Recession dampens the economic climate. Conceptual illustration suggesting how the recession has adversely affected the mood of businessmen and executives. Bearish vectors Recession dampens the economic climate. Conceptual illustration suggesting how the recession has adversely affected the mood of businessmen and executives
Free with trial Bitcoin crypto currency stick graph chart of stock market investment trading, Bullish point, Bearish point. trend of graph vector desig. Bearish vectors Bitcoin crypto currency stick graph chart of stock market investment trading. Bullish point, Bearish point. trend of graph vector desig
Free with trial Stock Market. Concept of stock market exchange, graphic of bull and bear combined with candlestick. Bearish vectors Stock Market. Concept of stock market exchange, graphic of bull and bear combined with candlestick
Free with trial The schedule for changing the stock market graph in a positive direction. The investment economy and the development of new financial tools for trade online. Vector illustration. Bearish vectors The schedule for changing the stock market graph in a positive direction. The investment economy and the development of. New financial tools for trade online
Free with trial Business candlestick and financial graph chart suitable for Forex stock market investment trading concept, Global network connection and Business analytics on abstract background. Bearish vectors Business candlestick and financial graph chart suitable for Forex stock market investment trading concept. Business candlestick and financial graph chart. Business candlestick and financial graph chart suitable for Forex stock market investment trading concept, Global network connection and Business analytics on abstract background.
Free with trial Business candlestick and financial graph chart suitable for Forex stock market investment trading concept, Global network connection and Business analytics on abstract background. Bearish vectors Business candlestick and financial graph chart suitable for Forex stock market investment trading concept. Business candlestick and financial graph chart. Business candlestick and financial graph chart suitable for Forex stock market investment trading concept, Global network connection and Business analytics on abstract background.
Free with trial Vector of bull and bear symbols of stock market trends. The growing and falling market. Wild Animals. Bearish vectors Vector of bull and bear symbols of stock market trends. The growing and falling market. Wild Animals
Free with trial Bear and bull trading logo template, animal vector and business finance modern design template inspiration. Bearish vectors Bear and bull trading logo template. Animal vector and business finance modern design template inspiration
Free with trial Vector of bull and bear symbols of stock market trends. Stock market and business concept. The growing and falling market. Wild Animals. Bearish vectors Vector of bull and bear symbols of stock market trends. Stock market and business concept. The growing and falling market. Wild. Animals
Free with trial Chart with forex or stock candles graphic. Set of various indicators for forex trade. Vector illustration. Bearish vectors Forex stock chart. Chart with forex or stock candles graphic. Set of various indicators for forex trade. Vector illustration. Chart with forex or stock candles graphic. Set of various indicators for forex trade. Vector illustration.
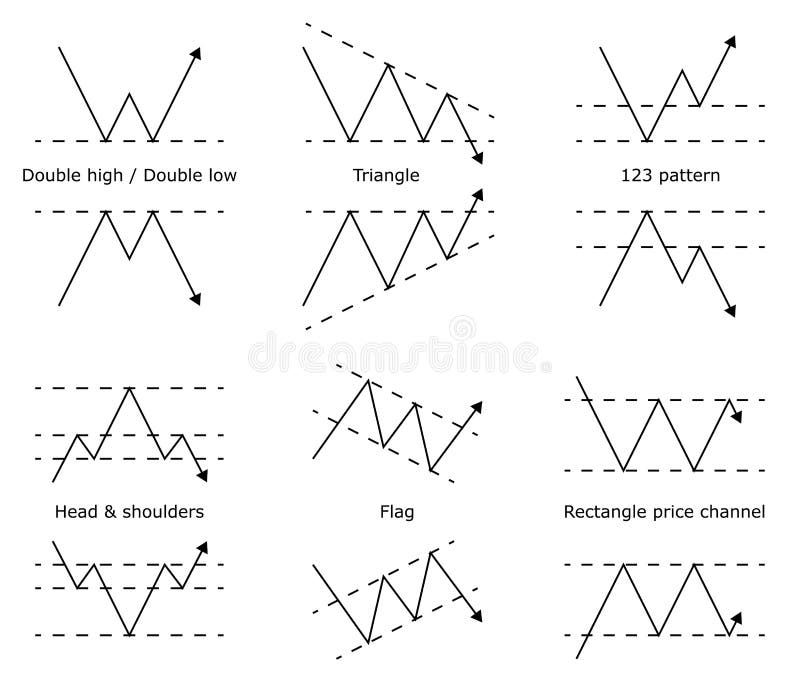
Free with trial Forex stock trade pattern. Forex stock graphic models. Price prediction. Trading signal. Candlestick patters. Vector illustration. Bearish vectors Forex stock trade pattern. Trading signal. Candlestick patters. Forex stock trade pattern. Forex stock graphic models. Price prediction. Trading signal. Forex stock trade pattern. Forex stock graphic models. Price prediction. Trading signal. Candlestick patters. Vector illustration.
Free with trial Forex stock trade pattern. Forex stock graphic models. Price prediction. Trading signal. Vector illustration. Bearish vectors Forex stock trade pattern. Price prediction model. Forex stock trade pattern. Forex stock graphic models. Price prediction. Trading signal. Vector illustration. Forex stock trade pattern. Forex stock graphic models. Price prediction. Trading signal. Vector illustration.
Free with trial Forex stock trade pattern. Forex stock graphic models. Price prediction. Trading signal. Candlestick patters. Vector illustration. Bearish vectors Forex stock trade pattern. Trading signal. Candlestick patters. Forex stock trade pattern. Forex stock graphic models. Price prediction. Trading signal. Forex stock trade pattern. Forex stock graphic models. Price prediction. Trading signal. Candlestick patters. Vector illustration.
Free with trial Neon silhouette of bull and bear heads with japanese candlestick symbol on black background. Stock market concept. Vector 10 eps illustration. Bearish vectors Neon silhouette of bull and bear heads with japanese candlestick symbol on black background. Stock market concept. Vector 10 eps illustration
Free with trial Stock market. Bullish schedule. Bear schedule. Players on Exchange. Bulls and bears traders on a stock market. Vector. Bear. Bearish vectors Stock market. Bullish schedule. Bear schedule. Players on Exchange. Bulls and bears traders on a stock market. Vector. Stock market. Bullish schedule. Bear
Free with trial Vector abstract illustration. Financial market data. Forex trading concept. Stock exchange symbol. 3D Vector illustration. Financial. Bearish vectors Vector abstract illustration. Financial market data. Forex trading concept. Stock exchange symbol.3D Vector illustration. Vector abstract illustration. Financial
Free with trial Bull vs bear symbol of stock market trend on white background Illustration. Vector. Bearish vectors Bull vs bear symbol of stock market trend on white background Illustration. Vector
Free with trial Market down stock bearish. Illustration vector recesion economy. Bearish vectors Market down stock bearish. Illustration vector recesion economy
Free with trial Bitcoin bearish market vector concept with bear pushing bitcoin off a cliff. Symbol of downturn, selling blockchain cryptocurrency and virtual exchange. Eps10 illustration. Bearish vectors Bitcoin bearish market vector concept with bear pushing bitcoin off a cliff. Symbol of downturn, selling blockchain. Cryptocurrency and virtual exchange. Eps10
Free with trial Stock candlestick chart icon illustration vector set. Contains such icon as Bullish, Bearish, Doji, Graph, and more. Expanded Stroke. Bearish vectors Stock candlestick chart icon vector set. Contains such icon as Bullish, Bearish, Doji, Graph trend, and more. Expanded. Stock candlestick chart icon illustration. Stock candlestick chart icon illustration vector set. Contains such icon as Bullish, Bearish, Doji, Graph, and more. Expanded Stroke
Free with trial Bearish trend on financial market with bear pushing dollar off a cliff. Stock market, recession, selling strategy symbol, trade on stock exchange. Eps10 illustration. Bearish vectors Bearish trend on financial market with bear pushing dollar off a cliff. Stock market, recession, selling strategy symbol. Trade on stock exchange. Eps10
Free with trial Candlestick strategy indicator with bullish and bearish engulfing pattern is a style of financial chart, Suitable for forex stock market investment trading concept. Bearish vectors Candlestick strategy indicator with bullish and bearish engulfing pattern. Candlestick strategy indicator with bullish and bearish engulfing pattern is a style. Candlestick strategy indicator with bullish and bearish engulfing pattern is a style of financial chart, Suitable for forex stock market investment trading concept.
Free with trial Candlestick strategy indicator with bullish and bearish engulfing pattern is a style of financial chart, Suitable for forex stock market investment trading concept, Blurred photo for an example. Bearish vectors Candlestick strategy indicator with bullish and bearish engulfing pattern. Candlestick strategy indicator with bullish and bearish engulfing pattern is a style. Candlestick strategy indicator with bullish and bearish engulfing pattern is a style of financial chart, Suitable for forex stock market investment trading concept, Blurred photo for an example
Free with trial Bullish and Bearish chart. Stock chart show Bullish trend and Bearish trend. Bearish vectors Bullish and Bearish chart. Stock chart show Bullish trend and Bearish trend
Free with trial Bearish trend concept. Candlestick graph of bearish trend. Break the resistance level. Stock market analysis, forex, online trading concept. Bearish vectors Bearish trend concept. Candlestick graph of bearish trend. Break the resistance level. Stock market analysis, forex, online trading concept
Free with trial Candle chart. Growth graph investment finance business marketing trends bearish accounting price digital trade index, stock and market statistic vector design. Bearish vectors Candle chart. Growth graph investment finance business marketing trends bearish accounting price digital trade index. Stock and market statistic vector design
Free with trial Downtrend bearish stock market candle stick chart going down loss. Vector. Bearish vectors Downtrend bearish stock market candle stick chart going down loss. Vector
Free with trial Bullish and bearish symbols. Stock market trends. Bearish vectors Bullish and bearish symbols. Stock market trends
Free with trial Bullish vs bearish. Illustration of market that presented in Bullish vs bearish. Bearish vectors Bullish vs bearish. Illustration of market that presented in Bullish vs bearish
Free with trial Bullish and Bearish symbols on stock market vector illustration. vector Forex or commodity charts, on abstract background. The sym. Bol of the the bull and bear. Bearish vectors Bullish and Bearish symbols on stock market vector illustration. vector Forex or commodity charts, on abstract background. The sym. Bol of the the bull and bear
Free with trial Bull and Bear abstract vector illustration. graphic design concept of stock market Bullish and Bearish trend. Bearish vectors Bull and Bear abstract vector illustration. graphic design concept of stock market Bullish and Bearish trend.
Free with trial Bearish symbols on stock market vector illustration. vector Forex or commodity charts, on abstract background. The symbol of the the Bear. The stock market down turn. Bearish vectors Bearish symbols on stock market vector illustration. vector Forex or commodity charts, on abstract background. The symbol of the t. He Bear. The stock market
Free with trial Bullish and bearish symbols. Stock market trends. Bearish vectors Bullish and bearish symbols. Stock market trends
Free with trial Bull and Bear abstract vector illustration. graphic design concept of stock market Bullish and Bearish trend. Bearish vectors Bull and Bear abstract vector illustration. graphic design concept of stock market Bullish and Bearish trend.
Free with trial Grizzly bear in geometric Paper cut bearish trend, technology trading for stock market, vector art and illustration. Bearish vectors Grizzly bear in geometric Paper cut bearish trend, technology trading for stock market, vector art and illustration.
Free with trial Ascending Broadening Wedge Pattern - bearish formation figure, chart technical analysis. Vector stock, cryptocurrency graph, forex analytics, trading market price breakouts icon. Bearish vectors Ascending Broadening Wedge Pattern - bearish formation figure, chart technical analysis. Vector stock, cryptocurrency graph, forex analytics, trading market
Free with trial Silhouette of bearish symbols. Bearish symbols. Stock market trends. The falling market. Bearish vectors Silhouette of bearish symbols. Bearish symbols. Stock market trends. The falling market
Free with trial Bearish Rectangle - continuation price chart pattern figure technical analysis. Strong uptrend between two parallel levels. Stock, cryptocurrency graph, forex analytics, trading market breakouts icon. Bearish vectors Bearish Rectangle - continuation price chart pattern vector icon. Technical analysis. Strong uptrend between two parallel levels. Bearish Rectangle. Bearish Rectangle - continuation price chart pattern figure technical analysis. Strong uptrend between two parallel levels. Stock, cryptocurrency graph, forex analytics, trading market breakouts icon
Free with trial Business concept vector illustration of a depression businessmen with candlestick chart, concept of bearish stock market. Bearish vectors Business concept vector illustration of a depression businessmen with candlestick chart, concept of bearish stock market.
Free with trial Bear market sign. Bear run. Bearish symbol. Stocks or cryptocurrency downtrend. Financial crash. Candlestick chart. Bubble. Economic crisis. Bearish vectors Bear market sign. Bear run. Bearish symbol. Stocks or cryptocurrency downtrend. Financial crash. Candlestick chart. Bubble. Economic crisis
Free with trial Bullish and Bearish symbols on stock market vector illustration. The symbol of the bear and the bull. The growing and falling market. Bearish vectors Bullish and Bearish symbols on the stock market. Bullish and Bearish symbols on stock market vector illustration. The symbol of the bear and the bull. The. Bullish and Bearish symbols on stock market vector illustration. The symbol of the bear and the bull. The growing and falling market.
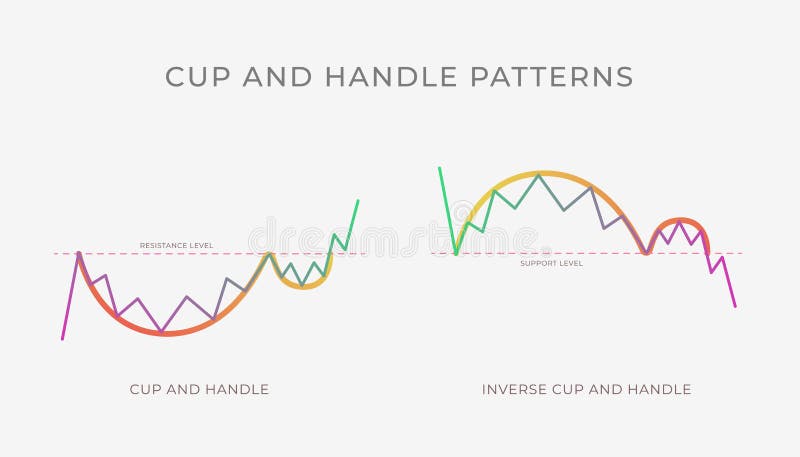
Free with trial Cup and Handle chart pattern formation - bullish or bearish technical analysis reversal or continuation trend figure. Vector stock, cryptocurrency graph, forex, trading market price breakouts icon. Bearish vectors Cup and Handle chart pattern formation - bullish or bearish technical analysis reversal or continuation trend figure. Vector stock, cryptocurrency graph, forex
Free with trial Bearish 5-0 - Harmonic Patterns with bearish formation price figure, chart technical analysis. Vector stock, cryptocurrency graph, forex analytics, trading market price breakouts icon. Bearish vectors Bearish 5-0 - Harmonic Patterns with bearish formation price figure, chart technical analysis. Vector stock, cryptocurrency graph, forex analytics, trading
Free with trial Bullish and Bearish symbols on stock market vector illustration. The symbol of the bear and the bull. The growing and falling market. Bearish vectors Bullish and Bearish symbols on stock market vector illustration. The symbol of the bear and the bull. The growing and falling market
Free with trial Triple Top and Bottom chart pattern formation - bullish or bearish technical analysis reversal or continuation trend figure. Vector stock, cryptocurrency graph, forex, trading market price breakouts. Bearish vectors Triple Top and Bottom chart pattern formation - bullish or bearish technical analysis reversal or continuation trend figure. Vector stock, cryptocurrency graph
Free with trial Descending triangle pattern figure technical analysis. Vector stock and cryptocurrency exchange graph, forex analytics and trading market chart. Descending bearish triangle breakouts flat vector icon. Bearish vectors Descending bearish triangle breakouts flat icon. Vector stock and cryptocurrency exchange graph forex analytics and trading market. Descending triangle pattern. Descending triangle pattern figure technical analysis. Vector stock and cryptocurrency exchange graph, forex analytics and trading market chart. Descending bearish triangle breakouts flat vector icon
Free with trial Rounding Top and Bottom chart pattern formation - bullish or bearish technical analysis reversal or continuation trend figure. Vector stock, crypto graph, forex, trading market price breakouts. Bearish vectors Rounding Top and Bottom chart pattern formation - bullish or bearish technical analysis reversal or continuation trend figure. Vector stock, crypto graph
Free with trial Downtrend trend definition flat icon with laptop and text - bearish chart pattern figure technical analysis. Vector stock and cryptocurrency exchange graph, forex analytics, trading market price. Bearish vectors Downtrend trend definition flat icon with laptop and text - bearish chart pattern figure technical analysis. Vector stock and cryptocurrency exchange graph
 Sign in