Free with trial A practical vector illustration of a person pushing a broken car, symbolizing roadside assistance and vehicle breakdowns. Ideal for automotive services, emergency support, or themes related to overcoming unexpected challenges on the road. Represents perseverance and a need for help, vector design Generative AI. Breakdowns vectors Person pushing broken car, roadside assistance and vehicle breakdown, urgent repair, vector design Generative AI. A practical vector illustration of a person. A practical vector illustration of a person pushing a broken car, symbolizing roadside assistance and vehicle breakdowns. Ideal for automotive services, emergency support, or themes related to overcoming unexpected challenges on the road. Represents perseverance and a need for help, vector design Generative AI
Free with trial A clear flat vector illustration of a pie chart, symbolizing data distribution, segments, and statistical analysis. Ideal for business reports, demographic studies, market research, or educational materials. This versatile chart effectively communicates proportions and shares, perfect for demonstrating categorical breakdowns and insights, vector design Generative AI. Breakdowns vectors Pie Chart Data Distribution Segments, Statistical Analysis Info, vector design Generative AI. A clear flat vector illustration of a pie chart, symbolizing data. A clear flat vector illustration of a pie chart, symbolizing data distribution, segments, and statistical analysis. Ideal for business reports, demographic studies, market research, or educational materials. This versatile chart effectively communicates proportions and shares, perfect for demonstrating categorical breakdowns and insights, vector design Generative AI
Free with trial An abstract flat vector illustration of broken glass cracks, creating a shattered surface effect. This design is perfect for technological breakdowns, accident reports, conceptual art, and graphic overlays, symbolizing disruption, fragility, and impactful events, suitable for various dynamic projects, vector design Generative AI. Breakdowns vectors Abstract Broken Glass Cracks Shattered Surface Effect, vector design Generative AI. An abstract flat vector illustration of broken glass cracks, creating a. An abstract flat vector illustration of broken glass cracks, creating a shattered surface effect. This design is perfect for technological breakdowns, accident reports, conceptual art, and graphic overlays, symbolizing disruption, fragility, and impactful events, suitable for various dynamic projects, vector design Generative AI
Free with trial A visual flat vector icon combining an hourglass with a pie chart, symbolizing time allocation, budget distribution over time, or activity breakdowns. This analytical design is ideal for financial reports, project management, or personal time tracking, offering clear data visualization, vector design Generative AI. Breakdowns vectors Hourglass with Pie Chart, Time Allocation Vector Generative AI. A visual flat vector icon combining an hourglass with a pie chart, symbolizing time allocation. A visual flat vector icon combining an hourglass with a pie chart, symbolizing time allocation, budget distribution over time, or activity breakdowns. This analytical design is ideal for financial reports, project management, or personal time tracking, offering clear data visualization, vector design Generative AI
Free with trial An illustration of a person distressed by a distorted television screen and a communication tower, symbolizing technological problems, misinformation, or communication breakdowns. Ideal for digital detox, cybersecurity, or media-related themes, vector design Generative AI. Breakdowns vectors Person Troubled by Distorted Technology, Communication Issues, vector design Generative AI. An illustration of a person distressed by a distorted television. An illustration of a person distressed by a distorted television screen and a communication tower, symbolizing technological problems, misinformation, or communication breakdowns. Ideal for digital detox, cybersecurity, or media-related themes, vector design Generative AI
Free with trial A flat icon of a pie chart divided into segments, colored green. Represents data visualization, statistics, proportions, or analysis results. Essential for dashboards, reports, or presentations illustrating data distribution and quantitative breakdowns, providing a clear graphic representation, vector design Generative AI. Breakdowns vectors Segmented Pie Chart Flat Icon (Green).jpg for Data Visualization, vector design Generative AI. A flat icon of a pie chart divided into segments, colored green. A flat icon of a pie chart divided into segments, colored green. Represents data visualization, statistics, proportions, or analysis results. Essential for dashboards, reports, or presentations illustrating data distribution and quantitative breakdowns, providing a clear graphic representation, vector design Generative AI
Free with trial A powerful vector icon of a person cutting a cable, symbolizing disconnection, interruption, or a network problem. Ideal for IT support, cybersecurity warnings, or projects emphasizing communication breakdowns and system failures. It conveys sabotage or damage, vector design Generative AI. Breakdowns vectors Disconnection Interruption Signal, Network Problem Cable Cut, vector design Generative AI. A powerful vector icon of a person cutting a cable, symbolizing. A powerful vector icon of a person cutting a cable, symbolizing disconnection, interruption, or a network problem. Ideal for IT support, cybersecurity warnings, or projects emphasizing communication breakdowns and system failures. It conveys sabotage or damage, vector design Generative AI
Free with trial A cloudbased platform that tracks the maintenance needs of each farm equipment providing timely reminders and preventing costly breakdowns.. Vector illustration. Breakdowns vectors A cloudbased platform that tracks the maintenance needs of each farm equipment providing timely reminders and preventing. Costly breakdowns.. Vector
Free with trial A clean line-art illustration of a complete pie chart, representing comprehensive data distribution, clear proportions, and detailed statistical analysis. This image is ideal for business reports, financial presentations, educational materials, and infographics. Perfect for effectively visualizing percentages and breakdowns of information. vector design Generative AI. Breakdowns vectors Full pie chart, representing data distribution and statistics. vector design Generative AI. A clean line-art illustration of a complete pie chart, representing. A clean line-art illustration of a complete pie chart, representing comprehensive data distribution, clear proportions, and detailed statistical analysis. This image is ideal for business reports, financial presentations, educational materials, and infographics. Perfect for effectively visualizing percentages and breakdowns of information. vector design Generative AI
Free with trial An isometric vector illustration of a pie chart with one slice separated, emphasizing data segmentation and individual components. This image is excellent for business analytics, market share reports, educational data breakdowns, or designs requiring a dynamic and clear view of proportional data, vector design Generative AI. Breakdowns vectors Isometric Pie Chart with Separated Slice, Data Segmentation, vector design Generative AI. An isometric vector illustration of a pie chart with one slice. An isometric vector illustration of a pie chart with one slice separated, emphasizing data segmentation and individual components. This image is excellent for business analytics, market share reports, educational data breakdowns, or designs requiring a dynamic and clear view of proportional data, vector design Generative AI
Free with trial A simple line art vector set showing an adjustable desk lamp and its lampshade as a separate, detached component. This is great for assembly instructions, product breakdowns, and customizable design concepts in catalogs or websites, vector design Generative AI. Breakdowns vectors Adjustable Desk Lamp and Separate Shade Line Art Vector Component Set, vector design Generative AI. A simple line art vector set showing an adjustable desk lamp. A simple line art vector set showing an adjustable desk lamp and its lampshade as a separate, detached component. This is great for assembly instructions, product breakdowns, and customizable design concepts in catalogs or websites, vector design Generative AI
Free with trial A dynamic vector illustration of a car towing another vehicle on a winding road, symbolizing roadside assistance, breakdowns, and rescue services. Perfect for automotive clubs, insurance companies, or emergency services. This graphic conveys support and reliability, ideal for illustrating prompt help and efficient recovery in challenging situations, vector design Generative AI. Breakdowns vectors Car Towing Another Vehicle on Road for Roadside Assistance, vector design Generative AI. A dynamic vector illustration of a car towing another vehicle on a. A dynamic vector illustration of a car towing another vehicle on a winding road, symbolizing roadside assistance, breakdowns, and rescue services. Perfect for automotive clubs, insurance companies, or emergency services. This graphic conveys support and reliability, ideal for illustrating prompt help and efficient recovery in challenging situations, vector design Generative AI
Free with trial Visualize the cost per engagement for missiles versus lasers, highlighting key component expenses and energy costs for strategic decision-making. Breakdowns vectors Comparing engagement costs missile versus laser technology with detailed cost breakdowns. Visualize the cost per engagement for missiles versus lasers. Visualize the cost per engagement for missiles versus lasers, highlighting key component expenses and energy costs for strategic decision-making
Free with trial An intricate vector icon showing a camera with a screwdriver and visible internal gears, representing camera disassembly, internal mechanisms, or detailed repair. Useful for technical manuals, engineering diagrams, product breakdowns, or specialized repair services. Detailed and informative. vector design Generative AI. Breakdowns vectors Camera Disassembly & Internal Mechanism Icon, vector design Generative AI. An intricate vector icon showing a camera with a screwdriver and visible internal. An intricate vector icon showing a camera with a screwdriver and visible internal gears, representing camera disassembly, internal mechanisms, or detailed repair. Useful for technical manuals, engineering diagrams, product breakdowns, or specialized repair services. Detailed and informative. vector design Generative AI
Free with trial An isometric illustration showcasing an exploded view of abstract geometric layers. This design represents architectural structures, data segmentation, or complex system breakdowns. Ideal for tech, engineering, or design presentations, emphasizing detail and depth, vector design Generative AI. Breakdowns vectors Exploded view of abstract geometric layers, architectural composition, vector design Generative AI. An isometric illustration showcasing an exploded view of. An isometric illustration showcasing an exploded view of abstract geometric layers. This design represents architectural structures, data segmentation, or complex system breakdowns. Ideal for tech, engineering, or design presentations, emphasizing detail and depth, vector design Generative AI
Free with trial An isometric vector illustration providing an exploded view of a bicycle, showcasing its various mechanical components. This technical depiction is excellent for demonstrating bike engineering, repair tutorials, or product breakdowns. Ideal for cycling enthusiasts, mechanics, or educational content, highlighting the intricate workings of a bicycle, vector design Generative AI. Breakdowns vectors Exploded View of Bicycle Mechanical Components, vector design Generative AI. An isometric vector illustration providing an exploded view of a bicycle, showcasing. An isometric vector illustration providing an exploded view of a bicycle, showcasing its various mechanical components. This technical depiction is excellent for demonstrating bike engineering, repair tutorials, or product breakdowns. Ideal for cycling enthusiasts, mechanics, or educational content, highlighting the intricate workings of a bicycle, vector design Generative AI
Free with trial A striking vector illustration of a computer keyboard with a dynamic glitch effect, symbolizing digital errors, cyber disruptions, or a futuristic aesthetic. This graphic is ideal for cybersecurity themes, tech art, or concepts of virtual reality breakdowns, conveying a sense of digital instability and modern technology's imperfections, vector design Generative AI. Breakdowns vectors Glitched Keyboard Effect, Digital Error Aesthetic, vector design Generative AI. A striking vector illustration of a computer keyboard with a dynamic glitch. A striking vector illustration of a computer keyboard with a dynamic glitch effect, symbolizing digital errors, cyber disruptions, or a futuristic aesthetic. This graphic is ideal for cybersecurity themes, tech art, or concepts of virtual reality breakdowns, conveying a sense of digital instability and modern technology's imperfections, vector design Generative AI
Free with trial A vibrant stacked pyramid chart displaying proportional data layers with percentages. Ideal for illustrating demographic breakdowns, resource distribution, or hierarchical importance. High-resolution vector for clear and insightful data visualization, vector design Generative AI. Breakdowns vectors Stacked Pyramid Chart - Proportional Data Layers, vector design Generative AI. A vibrant stacked pyramid chart displaying proportional data layers with. A vibrant stacked pyramid chart displaying proportional data layers with percentages. Ideal for illustrating demographic breakdowns, resource distribution, or hierarchical importance. High-resolution vector for clear and insightful data visualization, vector design Generative AI
Free with trial Explore a historical scientific diagram showcasing rocket propulsion systems, detailed component breakdowns, and explanatory text, offering insights into early rocketry technology and its fundamental principles. Breakdowns vectors Vintage scientific diagram of rocketry and propellants detailed technical illustration and explanations. Explore a historical scientific diagram showcasing. Explore a historical scientific diagram showcasing rocket propulsion systems, detailed component breakdowns, and explanatory text, offering insights into early rocketry technology and its fundamental principles
Free with trial A dynamic donut chart with colorful segments, representing data visualization, segmented information, and percentage breakdowns in a modern, clear style vector design Generative AI. Breakdowns vectors Dynamic donut chart, colorful segments data visualization design vector design Generative AI. A dynamic donut chart with colorful segments, representing data. A dynamic donut chart with colorful segments, representing data visualization, segmented information, and percentage breakdowns in a modern, clear style vector design Generative AI
Free with trial A clear and colorful vector illustration of a segmented bar chart, showcasing different categories or stages of data. This versatile infographic is perfect for presenting survey results, project breakdowns, or any information requiring distinct and visually appealing data representation, vector design Generative AI. Breakdowns vectors Segmented bar chart, colorful data representation, vector design Generative AI. A clear and colorful vector illustration of a segmented bar chart, showcasing. A clear and colorful vector illustration of a segmented bar chart, showcasing different categories or stages of data. This versatile infographic is perfect for presenting survey results, project breakdowns, or any information requiring distinct and visually appealing data representation, vector design Generative AI
Free with trial A finely detailed vector illustration of a single gear component, emphasizing mechanical precision and intricate design. Ideal for engineering diagrams, product breakdowns, or industrial branding. The clear rendering of teeth and structure conveys quality and technical expertise, perfect for illustrating individual parts and the complexity of machinery, ensuring accuracy, vector design Generative. Breakdowns vectors Detailed Gear Component: Mechanical Precision Element, vector design Generative AI. A finely detailed vector illustration of a single gear component, emphasizing. A finely detailed vector illustration of a single gear component, emphasizing mechanical precision and intricate design. Ideal for engineering diagrams, product breakdowns, or industrial branding. The clear rendering of teeth and structure conveys quality and technical expertise, perfect for illustrating individual parts and the complexity of machinery, ensuring accuracy, vector design Generative
Free with trial A whimsical vector illustration of a pizza with one slice removed, symbolizing a portion, percentage, or financial allocation. This creative graphic is ideal for budget breakdowns, sales distribution, or any data visualization needing an engaging, approachable metaphor. Fun and relatable for diverse applications, vector design Generative AI. Breakdowns vectors Pizza Slice with Percentage for Financial Allocation, vector design Generative AI. A whimsical vector illustration of a pizza with one slice removed, symbolizing. A whimsical vector illustration of a pizza with one slice removed, symbolizing a portion, percentage, or financial allocation. This creative graphic is ideal for budget breakdowns, sales distribution, or any data visualization needing an engaging, approachable metaphor. Fun and relatable for diverse applications, vector design Generative AI
Free with trial A detailed vector illustration of a comprehensive business report dashboard, featuring various charts, graphs, and percentage breakdowns for data analysis. This infographic is ideal for corporate presentations, financial reviews, or performance tracking, effectively visualizing complex business intelligence in a clear and organized format, vector design Generative AI. Breakdowns vectors Comprehensive Business Report Dashboard Infographic, vector design Generative AI. A detailed vector illustration of a comprehensive business report dashboard. A detailed vector illustration of a comprehensive business report dashboard, featuring various charts, graphs, and percentage breakdowns for data analysis. This infographic is ideal for corporate presentations, financial reviews, or performance tracking, effectively visualizing complex business intelligence in a clear and organized format, vector design Generative AI
Free with trial A standard 3D pie chart graphic divided into blue, orange, and yellow segments. This icon symbolizes data distribution, percentages, surveys, or financial breakdowns. Useful for reports, presentations, or any visual representation of proportional data png transparent image Generative AI. Breakdowns vectors Colorful pie chart, representing data distribution and analysis png transparent image Generative AI. A standard 3D pie chart graphic divided into blue, orange. A standard 3D pie chart graphic divided into blue, orange, and yellow segments. This icon symbolizes data distribution, percentages, surveys, or financial breakdowns. Useful for reports, presentations, or any visual representation of proportional data png transparent image Generative AI
Free with trial A concise vector illustration of a horizontal bar chart displaying percentage breakdowns for categories A and B, along with a total percentage symbol. This infographic is ideal for presenting survey results, market share, or any data distribution in a clear, easy-to-understand format for reports and presentations. vector design Generative AI. Breakdowns vectors Percentage Breakdown Chart, Data Distribution, vector design Generative AI. A concise vector illustration of a horizontal bar chart displaying percentage. A concise vector illustration of a horizontal bar chart displaying percentage breakdowns for categories A and B, along with a total percentage symbol. This infographic is ideal for presenting survey results, market share, or any data distribution in a clear, easy-to-understand format for reports and presentations. vector design Generative AI
Free with trial A concise vector illustration of a circular infographic displaying percentage breakdowns. Perfect for reports, presentations, or dashboards to clearly visualize data distribution and proportions, offering a professional and easily digestible summary of information, vector design Generative AI. Breakdowns vectors Circular Percentage Breakdown Infographic, vector design Generative AI. A concise vector illustration of a circular infographic displaying percentage breakdowns. A concise vector illustration of a circular infographic displaying percentage breakdowns. Perfect for reports, presentations, or dashboards to clearly visualize data distribution and proportions, offering a professional and easily digestible summary of information, vector design Generative AI
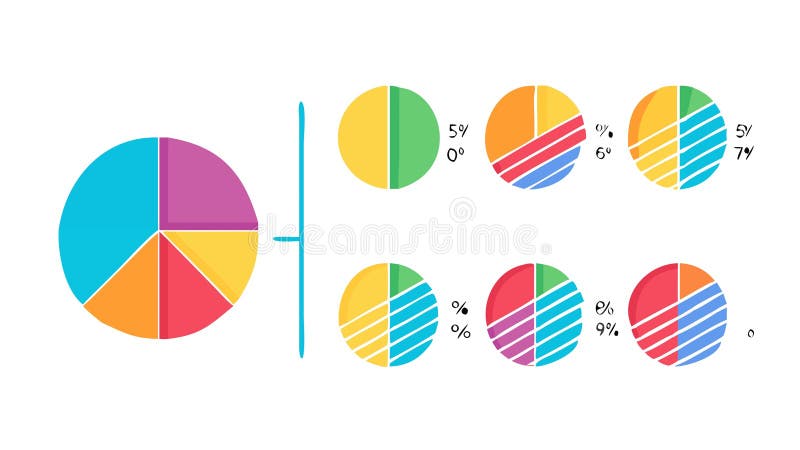
Free with trial An infographic featuring multiple pie charts for comparative data analysis and distribution. Ideal for presenting market segments, demographic breakdowns, or survey results across different categories. High-resolution vector for versatile data visualization, vector design Generative AI. Breakdowns vectors Multi-Pie Chart Infographic - Comparative Data Analysis, vector design Generative AI. An infographic featuring multiple pie charts for comparative data analysis. An infographic featuring multiple pie charts for comparative data analysis and distribution. Ideal for presenting market segments, demographic breakdowns, or survey results across different categories. High-resolution vector for versatile data visualization, vector design Generative AI
Free with trial A clear vector illustration of a donut chart displaying various sales performance indicators as percentage breakdowns (e. g. , 6, 3, 5). jpg. This infographic is ideal for marketing reports, business analytics, or any presentation requiring a visual representation of market share or categorical distribution for strategic planning. vector design Generative AI. Breakdowns vectors Sales Performance Indicators, Percentage Breakdown, vector design Generative AI. A clear vector illustration of a donut chart displaying various sales. A clear vector illustration of a donut chart displaying various sales performance indicators as percentage breakdowns (e.g., 6, 3, 5).jpg. This infographic is ideal for marketing reports, business analytics, or any presentation requiring a visual representation of market share or categorical distribution for strategic planning. vector design Generative AI
Free with trial Clear pie chart vector design, data visualization tool, perfect for business presentations, infographic projects, statistical reports, data analysis, and effectively presenting data proportions and percentage breakdowns in visual form. vector design Generative AI. Breakdowns vectors Pie chart vector design, data visualization for business and infographic themes vector design Generative AI. Clear pie chart vector design, data visualization. Clear pie chart vector design, data visualization tool, perfect for business presentations, infographic projects, statistical reports, data analysis, and effectively presenting data proportions and percentage breakdowns in visual form. vector design Generative AI
Free with trial Pie chart representing data analysis and percentage breakdowns. Breakdowns vectors Pie chart representing data analysis and percentage breakdowns.
Free with trial A vector exploded view diagram, representing technical illustrations for engineering manuals, repair guides, and instructional content. Ideal for engineering firms, technical documentation, and designs related to mechanics and technical breakdowns and repair processes vector design Generative AI. Breakdowns vectors Exploded view diagram, technical illustration for engineering and repair manuals vector design Generative AI. A vector exploded view diagram, representing. A vector exploded view diagram, representing technical illustrations for engineering manuals, repair guides, and instructional content. Ideal for engineering firms, technical documentation, and designs related to mechanics and technical breakdowns and repair processes vector design Generative AI
Free with trial A standard 3D pie chart graphic divided into blue, orange, and purple segments. This icon symbolizes data distribution, percentages, surveys, or financial breakdowns. Useful for reports, presentations, or any visual representation of proportional data png transparent image Generative AI. Breakdowns vectors Colorful pie chart graph, representing data distribution and statistics png transparent image Generative AI. A standard 3D pie chart graphic divided into blue. A standard 3D pie chart graphic divided into blue, orange, and purple segments. This icon symbolizes data distribution, percentages, surveys, or financial breakdowns. Useful for reports, presentations, or any visual representation of proportional data png transparent image Generative AI
Free with trial A standard 3D pie chart graphic divided into blue, orange, and purple segments. This icon symbolizes data distribution, percentages, surveys, or financial breakdowns. Useful for reports, presentations, or any visual representation of proportional data png transparent image Generative AI. Breakdowns vectors Colorful pie chart, representing data distribution and proportions analysis png transparent image Generative AI. A standard 3D pie chart graphic divided into. A standard 3D pie chart graphic divided into blue, orange, and purple segments. This icon symbolizes data distribution, percentages, surveys, or financial breakdowns. Useful for reports, presentations, or any visual representation of proportional data png transparent image Generative AI
Free with trial Detailed blueprint illustration showing multiple views of a vintage light aircraft. includes technical schematics of wings, engine, and cockpit layout. perfect for engineering and aviation enthusiasts. Breakdowns vectors Technical Blueprint Illustration of a Vintage Light Aircraft Showing Detailed Schematic Views and Component Breakdowns. Detailed blueprint illustration showing. detailed blueprint illustration showing multiple views of a vintage light aircraft. includes technical schematics of wings, engine, and cockpit layout. perfect for engineering and aviation enthusiasts
Free with trial A technician expertly calibrates a machine ensuring that it is running at maximum efficiency to minimize the risk of. Future breakdowns and AI generated. Breakdowns vectors A technician expertly calibrates a machine ensuring that it is running at maximum efficiency to minimize the risk of. Future breakdowns and AI generated
Free with trial A car with smoke showing protection against vehicle breakdowns. Breakdowns vectors A car with smoke showing protection against vehicle breakdowns.
Free with trial A mining operation using realtime data from its drilling equipment to predict wear on critical parts and prevent costly. Breakdowns.. Vector illustration AI. Breakdowns vectors A mining operation using realtime data from its drilling equipment to predict wear on critical parts and prevent costly. Breakdowns.. Vector illustration AI
Free with trial Customizable alerts and notifications keeping farmers informed about important events such as rainfall market price changes or machinery breakdowns.. Vector illustration. Breakdowns vectors Customizable alerts and notifications keeping farmers informed about important events such as rainfall market price. Changes or machinery breakdowns.. Vector
Free with trial A dramatic vector graphic depicting a severely broken pipe with large cracks, indicating significant damage. This icon is perfect for illustrating major infrastructure failures, repair needs, or critical system breakdowns, suitable for construction or utility industries, vector design Generative AI. Breakdowns vectors Severely Broken Pipe, Major Damage, vector design Generative AI. A dramatic vector graphic depicting a severely broken pipe with large cracks, indicating. A dramatic vector graphic depicting a severely broken pipe with large cracks, indicating significant damage. This icon is perfect for illustrating major infrastructure failures, repair needs, or critical system breakdowns, suitable for construction or utility industries, vector design Generative AI
Free with trial A clear vector illustration showing two sad individuals, representing conflict, disagreement, or emotional distress in relationships. Perfect for themes of interpersonal issues, relationship challenges, communication breakdowns, and the impact of negative emotions. Simple yet impactful, vector design Generative AI. Breakdowns vectors Conflict Disagreement: Sad People Icon, vector design Generative AI. A clear vector illustration showing two sad individuals, representing conflict, disagreement. A clear vector illustration showing two sad individuals, representing conflict, disagreement, or emotional distress in relationships. Perfect for themes of interpersonal issues, relationship challenges, communication breakdowns, and the impact of negative emotions. Simple yet impactful, vector design Generative AI
Free with trial A direct vector icon depicting two angry individuals, symbolizing relationship conflict, frustration, and negative interactions. Ideal for illustrating interpersonal challenges, emotional distress, and communication breakdowns. A simple yet powerful visual for difficult emotions, vector design Generative AI. Breakdowns vectors Relationship Conflict: Angry People Icon, vector design Generative AI. A direct vector icon depicting two angry individuals, symbolizing relationship conflict. A direct vector icon depicting two angry individuals, symbolizing relationship conflict, frustration, and negative interactions. Ideal for illustrating interpersonal challenges, emotional distress, and communication breakdowns. A simple yet powerful visual for difficult emotions, vector design Generative AI
Free with trial A striking vector illustration of a robotic arm sparking and malfunctioning, symbolizing industrial errors, system failures, or technological breakdowns. This image is ideal for cybersecurity, factory automation issues, or maintenance services. It conveys a sense of disruption and repair need, vector design Generative AI. Breakdowns vectors Robotic Arm Malfunction, Industrial Error, vector design Generative AI. A striking vector illustration of a robotic arm sparking and malfunctioning, symbolizing. A striking vector illustration of a robotic arm sparking and malfunctioning, symbolizing industrial errors, system failures, or technological breakdowns. This image is ideal for cybersecurity, factory automation issues, or maintenance services. It conveys a sense of disruption and repair need, vector design Generative AI
Free with trial A stark vector illustration of a broken VR headset with a shattered lens, symbolizing virtual reality failure or technical issues. This icon is perfect for themes of hardware malfunction, digital errors, tech challenges, or system breakdowns. Its impactful imagery is ideal for tech support, repair services, or warning messages, vector design Generative AI. Breakdowns vectors Broken VR Headset, Virtual Reality Failure, vector design Generative AI. A stark vector illustration of a broken VR headset with a shattered lens, symbolizing. A stark vector illustration of a broken VR headset with a shattered lens, symbolizing virtual reality failure or technical issues. This icon is perfect for themes of hardware malfunction, digital errors, tech challenges, or system breakdowns. Its impactful imagery is ideal for tech support, repair services, or warning messages, vector design Generative AI
Free with trial Flat vector icon featuring three pie charts with varying colors and distributions. Represents data analysis, statistics, market share, or diverse categorical data. Suitable for reports, infographics, dashboards, or illustrating various data breakdowns. Shows varied data proportions, vector design Generative AI. Breakdowns vectors Colorful Pie Charts Data Distribution Icons, vector design Generative AI. Flat vector icon featuring three pie charts with varying colors and distributions. Flat vector icon featuring three pie charts with varying colors and distributions. Represents data analysis, statistics, market share, or diverse categorical data. Suitable for reports, infographics, dashboards, or illustrating various data breakdowns. Shows varied data proportions, vector design Generative AI
Free with trial A powerful black-and-white vector illustration showing a meteor or comet splitting into multiple pieces upon entry or impact. This icon represents celestial events, atmospheric phenomena, or dramatic breakdowns. Ideal for astronomy, disaster preparedness, or sci-fi themes involving cosmic threats, vector design Generative AI. Breakdowns vectors Meteor Split: Celestial Impact Atmospheric Entry, vector design Generative AI. A powerful black-and-white vector illustration showing a meteor or comet splitting. A powerful black-and-white vector illustration showing a meteor or comet splitting into multiple pieces upon entry or impact. This icon represents celestial events, atmospheric phenomena, or dramatic breakdowns. Ideal for astronomy, disaster preparedness, or sci-fi themes involving cosmic threats, vector design Generative AI
Free with trial A vector illustration of a broken computer server, symbolizing data loss, system failure, and technological malfunction. This design is perfect for themes of IT disaster recovery, cybersecurity incidents, and hardware issues. It represents the critical impact of system breakdowns on digital operations, vector design Generative AI. Breakdowns vectors Broken Computer Server, Data Loss, System Failure, vector design Generative AI. A vector illustration of a broken computer server, symbolizing data loss, system. A vector illustration of a broken computer server, symbolizing data loss, system failure, and technological malfunction. This design is perfect for themes of IT disaster recovery, cybersecurity incidents, and hardware issues. It represents the critical impact of system breakdowns on digital operations, vector design Generative AI
Free with trial A vector illustration of a robot arm breaking a circuit board, symbolizing robot malfunction, system error, or AI failure. This design is perfect for themes of technological glitches, unexpected automation issues, and industrial breakdowns. It highlights the potential risks and challenges of complex robotic systems, vector design Generative AI. Breakdowns vectors Robot Malfunction, System Error, AI Failure, vector design Generative AI. A vector illustration of a robot arm breaking a circuit board, symbolizing robot. A vector illustration of a robot arm breaking a circuit board, symbolizing robot malfunction, system error, or AI failure. This design is perfect for themes of technological glitches, unexpected automation issues, and industrial breakdowns. It highlights the potential risks and challenges of complex robotic systems, vector design Generative AI
Free with trial An abstract illustration of a broken digital link or connection, symbolizing disconnection, system failure, and technological issues. Ideal for IT, network problems, and communication breakdowns, vector design Generative AI. Breakdowns vectors Broken Digital Link for Disconnection and System Failure, vector design Generative AI. An abstract illustration of a broken digital link or connection. An abstract illustration of a broken digital link or connection, symbolizing disconnection, system failure, and technological issues. Ideal for IT, network problems, and communication breakdowns, vector design Generative AI
Free with trial A vintage television displaying downward arrows, indicating signal loss or a broadcast interruption. This illustration effectively conveys themes of technical difficulties, communication breakdowns, or the limitations of older technology. Perfect for depicting moments of frustration with electronics or a lost connection, vector design Generative AI. Breakdowns vectors Vintage TV with Signal Loss Arrows, Broadcast Interruption, vector design Generative AI. A vintage television displaying downward arrows, indicating signal loss. A vintage television displaying downward arrows, indicating signal loss or a broadcast interruption. This illustration effectively conveys themes of technical difficulties, communication breakdowns, or the limitations of older technology. Perfect for depicting moments of frustration with electronics or a lost connection, vector design Generative AI
Free with trial A vibrant vector illustration of a pie chart, symbolizing data analytics, statistics, and business reporting. This image is perfect for financial presentations, marketing analysis, and educational materials. It conveys clear breakdowns of information, insights, and quantitative data visualization, making it ideal for professional use, vector design Generative AI. Breakdowns vectors Colorful Pie Chart Data Analytics Vector Illustration, Business, Report, vector design Generative AI. A vibrant vector illustration of a pie chart, symbolizing. A vibrant vector illustration of a pie chart, symbolizing data analytics, statistics, and business reporting. This image is perfect for financial presentations, marketing analysis, and educational materials. It conveys clear breakdowns of information, insights, and quantitative data visualization, making it ideal for professional use, vector design Generative AI
Free with trial A dynamic pie chart displays data distribution with percentage labels. Features vibrant gradient colors, ideal for presentations, reports, and visualizing financial or demographic breakdowns. Breakdowns vectors Colorful gradient pie chart visualizing data percentages for business and marketing analysis. A dynamic pie chart displays data distribution with percentage. A dynamic pie chart displays data distribution with percentage labels. Features vibrant gradient colors, ideal for presentations, reports, and visualizing financial or demographic breakdowns
Free with trial A comprehensive vector illustration of a detailed checklist with multiple items and checkmarks. This icon is perfect for extensive to-do lists, project breakdowns, or complex task management systems, ensuring clarity in organization, vector design Generative AI. Breakdowns vectors Detailed checklist icon vector for comprehensive task lists, organization, vector design Generative AI. A comprehensive vector illustration of a detailed. A comprehensive vector illustration of a detailed checklist with multiple items and checkmarks. This icon is perfect for extensive to-do lists, project breakdowns, or complex task management systems, ensuring clarity in organization, vector design Generative AI
Free with trial A clear vector illustration of a stacked bar chart with distinct colorcoded segments and percentage labels 50, 40, 30, 20, 70. jpg. This graphic is ideal for showcasing proportional data, demographic breakdowns, or survey results. Professional and informative for comprehensive data visualization, vector design Generative AI. Breakdowns vectors Stacked Bar Chart with Percentage Labels, vector design Generative AI. A clear vector illustration of a stacked bar chart with distinct colorcoded segments and. A clear vector illustration of a stacked bar chart with distinct colorcoded segments and percentage labels 50, 40, 30, 20, 70.jpg. This graphic is ideal for showcasing proportional data, demographic breakdowns, or survey results. Professional and informative for comprehensive data visualization, vector design Generative AI
Free with trial A detailed vector infographic showcasing a pyramid diagram segmented with various percentage breakdowns, indicating different levels or categories. This analytical graphic is perfect for financial reports, marketing analysis, or demographic studies. It effectively visualizes proportional data and hierarchical distribution, enhancing clarity for complex information, vector design Generative AI. Breakdowns vectors Percentage Breakdown Pyramid Infographic, vector design Generative AI. A detailed vector infographic showcasing a pyramid diagram segmented with various. A detailed vector infographic showcasing a pyramid diagram segmented with various percentage breakdowns, indicating different levels or categories. This analytical graphic is perfect for financial reports, marketing analysis, or demographic studies. It effectively visualizes proportional data and hierarchical distribution, enhancing clarity for complex information, vector design Generative AI
Free with trial A clear vector illustration of multiple multisegment pie charts and small square icons, visualizing data distribution and statistical breakdowns. This graphic is ideal for business reports, market analysis, or any presentation requiring a concise and colorful representation of percentages and categories, vector design Generative AI. Breakdowns vectors MultiSegment Pie Charts Vector, Data Distribution, vector design Generative AI. A clear vector illustration of multiple multisegment pie charts and small square. A clear vector illustration of multiple multisegment pie charts and small square icons, visualizing data distribution and statistical breakdowns. This graphic is ideal for business reports, market analysis, or any presentation requiring a concise and colorful representation of percentages and categories, vector design Generative AI
Free with trial A vibrant infographic featuring a circular pie chart segmented into diverse categories, with central icons representing financial allocation. Perfect for presenting budget breakdowns, resource distribution, or investment portfolio analysis in a clear, visual format, vector design Generative AI. Breakdowns vectors Diverse Financial Allocation Infographic Pie Chart with Central Icons, vector design Generative AI. A vibrant infographic featuring a circular pie chart. A vibrant infographic featuring a circular pie chart segmented into diverse categories, with central icons representing financial allocation. Perfect for presenting budget breakdowns, resource distribution, or investment portfolio analysis in a clear, visual format, vector design Generative AI
Free with trial A straightforward vector illustration of a two-segment pie chart, clearly labeled with 70 and 50, highlighting numerical distribution. This image is perfect for displaying percentage breakdowns, comparing two metrics, or visualizing simple data ratios in presentations and reports, vector design Generative AI. Breakdowns vectors Percentage Breakdown: Clear Data Visualization, vector design Generative AI. A straightforward vector illustration of a two-segment pie chart, clearly labeled. A straightforward vector illustration of a two-segment pie chart, clearly labeled with 70 and 50, highlighting numerical distribution. This image is perfect for displaying percentage breakdowns, comparing two metrics, or visualizing simple data ratios in presentations and reports, vector design Generative AI
Free with trial Informative pie chart graphic, a data visualization tool perfect for statistics, analysis reports, and data breakdowns in business presentations, infographics, and analytical dashboards for education and business png transparent image Generative AI. Breakdowns vectors Pie chart, data visualization for statistics and analysis reports png transparent image Generative AI. Informative pie chart graphic, a data visualization tool. Informative pie chart graphic, a data visualization tool perfect for statistics, analysis reports, and data breakdowns in business presentations, infographics, and analytical dashboards for education and business png transparent image Generative AI
Free with trial A flowchart with nested elements, illustrating a hierarchical process or sub-processes within a larger workflow. This detailed graphic is ideal for software engineering, complex system design, or organizational charting. It provides a clear way to visualize intricate relationships and dependencies, enhancing clarity in complex operational breakdowns, vector design Generative AI. Breakdowns vectors Nested Flowchart Structure, Hierarchical Process Mapping, vector design Generative AI. A flowchart with nested elements, illustrating a hierarchical process or. A flowchart with nested elements, illustrating a hierarchical process or sub-processes within a larger workflow. This detailed graphic is ideal for software engineering, complex system design, or organizational charting. It provides a clear way to visualize intricate relationships and dependencies, enhancing clarity in complex operational breakdowns, vector design Generative AI
Free with trial An innovative isometric vector illustration showing a compact digital camera deconstructed into its main components, offering an exploded view. Ideal for technology education, repair guides, product breakdowns, or DIY electronics. Highlights the internal structure and various parts of a modern digital camera with clarity and precision, vector design Generative AI. Breakdowns vectors Deconstructed Compact Digital Camera in Isometric Exploded View, vector design Generative AI. An innovative isometric vector illustration showing a compact. An innovative isometric vector illustration showing a compact digital camera deconstructed into its main components, offering an exploded view. Ideal for technology education, repair guides, product breakdowns, or DIY electronics. Highlights the internal structure and various parts of a modern digital camera with clarity and precision, vector design Generative AI
Free with trial Mechanic repair auto electrician. Repairmen fix breakdowns of automobile engine. Men examine car with open hood. Maintenance in garage of service center, workshop station. Flat vector illustration. Breakdowns vectors Mechanic repair auto electrician. Repairmen fix breakdowns of automobile engine. Men examine car with open hood. Maintenance in garage of service center
Free with trial Mechanics fix breakdowns, examine suspension, change wheels with car lift. Repairmen do maintenance in auto service station. Men repair automobile, do bodywork in garage. Flat vector illustration. Breakdowns vectors Mechanics fix breakdowns, examine suspension, change wheels with car lift. Repairmen do maintenance in auto service. Station. Men repair automobile, do bodywork. Mechanics fix breakdowns, examine suspension, change wheels with car lift. Repairmen do maintenance in auto service station. Men repair automobile, do bodywork in garage. Flat vector illustration.
Free with trial Vibrant infographic of a marketing funnel chart showing multiple color-coded stages with percentage breakdowns. The design illustrates conversion rates and customer journey steps with icons and label. Breakdowns vectors Colorful Marketing Funnel Chart with Percentage Stages. Vibrant infographic of a marketing funnel chart showing multiple color-coded stages with percentage. Vibrant infographic of a marketing funnel chart showing multiple color-coded stages with percentage breakdowns. The design illustrates conversion rates and customer journey steps with icons and label
Free with trial Woman traffic controller shows stop gesture, standing near traffic light for cars. Girl inspector happily helps drivers avoid accidents on roads that cause injuries and breakdowns of automobiles. Breakdowns vectors Woman traffic controller shows stop gesture, standing near traffic light for cars. Girl inspector happily helps drivers avoid accidents on roads that cause
Free with trial Simple flat vector illustration of a young couple arguing, yelling, and pointing at each other, depicting relationship conflict, communication issues, and emotional tension. Breakdowns vectors Cartoon Flat Couple Yelling Pointing Each Other. Simple flat vector illustration of a young couple arguing, yelling, and pointing at each other, depicting. Simple flat vector illustration of a young couple arguing, yelling, and pointing at each other, depicting relationship conflict, communication issues, and emotional tension
Free with trial Modern pie charts collection. Vector isolated dimensional segments. Data analysis or statistics with breakdowns. Finance reports, investor pitch decks or market trends presentations set. Breakdowns vectors Dimensional segments of charts in modern type. Modern pie charts collection. Vector isolated dimensional segments. Data analysis or statistics with breakdowns. Modern pie charts collection. Vector isolated dimensional segments. Data analysis or statistics with breakdowns. Finance reports, investor pitch decks or market trends presentations set
Free with trial Line and Glyph Vector Illustrations. A Device That Stops Machines to Prevent Injuries or Breakdowns. A Person in a Risk Zone at a Production Plant. Autonomous Logistics Concept. Breakdowns vectors Collision Detection Sensor Icons. Line and Glyph Vector Illustrations. A Device That Stops Machines to Prevent Injuries or Breakdowns. A Person in a Risk Zone. Line and Glyph Vector Illustrations. A Device That Stops Machines to Prevent Injuries or Breakdowns. A Person in a Risk Zone at a Production Plant. Autonomous Logistics Concept
Free with trial Vector Illustration. A Device That Stops Machines to Prevent Injuries or Breakdowns. A Person in a Risk Zone at a Production Plant. Autonomous Logistics Concept. Breakdowns vectors Purple Collision Detection Sensor Icon. Vector Illustration. A Device That Stops Machines to Prevent Injuries or Breakdowns. A Person in a Risk Zone at a. Vector Illustration. A Device That Stops Machines to Prevent Injuries or Breakdowns. A Person in a Risk Zone at a Production Plant. Autonomous Logistics Concept
Free with trial Isometric warning triangle for vehicle emergencies. The reflective red and yellow design is used to signal road hazards, breakdowns, or accidents. Red plastic warning triangle. Breakdowns vectors Isometric warning triangle for vehicle emergencies. The reflective red and yellow design is used to signal road hazards. Breakdowns, or accidents. Red plastic
Free with trial A collection of black and white vector illustrations depicting various scenes of anger, conflict, and frustration. The set includes a couple arguing and pointing fingers, two women yelling at each other, a man expressing extreme frustration with raised hands, a man walking away angrily, and individuals showing upset or displeased expressions. These versatile illustrations are ideal for conveying concepts related to relationship problems, communication breakdowns, stress, emotional distress, and workplace disputes in articles, presentations, or digital media. Breakdowns vectors Anger and Conflict Vector Illustrations Set. A collection of black and white vector illustrations depicting various scenes of anger, conflict, and frustration. A collection of black and white vector illustrations depicting various scenes of anger, conflict, and frustration. The set includes a couple arguing and pointing fingers, two women yelling at each other, a man expressing extreme frustration with raised hands, a man walking away angrily, and individuals showing upset or displeased expressions. These versatile illustrations are ideal for conveying concepts related to relationship problems, communication breakdowns, stress, emotional distress, and workplace disputes in articles, presentations, or digital media.
Free with trial Professional presentation template featuring five pastel colored vertical pillars with icons and text spaces. Great for team performance metrics, business strategy overviews, and project task breakdowns. Breakdowns vectors Five step business template for strategic planning. Professional presentation template featuring five pastel colored vertical pillars with icons and text spaces. Professional presentation template featuring five pastel colored vertical pillars with icons and text spaces. Great for team performance metrics, business strategy overviews, and project task breakdowns.
Free with trial Data loss concept. A cloud icon, downward arrow, and sad face technological failure, cloud service downtime, or loss. For technology, cloud services, emotions data storage digital issues. Breakdowns vectors Cloud Depiction with Downward Arrow and Sad Face Data Loss or Downtime. Data loss concept. A cloud icon, downward arrow, and sad face technological failure. Data loss concept. A cloud icon, downward arrow, and sad face technological failure, cloud service downtime, or loss. For technology, cloud services, emotions data storage digital issues
Free with trial Auto repair, vehicle maintenance, breakdowns, battery life, transportation concerns, car diagnostics. Blue car front view with sad face and low battery bars. Auto repair and vehicle maintenance. Breakdowns vectors Car Front View with Sad Face Icon and Low Battery Bars Vehicle Issues. Auto repair, vehicle maintenance, breakdowns, battery life, transportation concerns, car. Auto repair, vehicle maintenance, breakdowns, battery life, transportation concerns, car diagnostics. Blue car front view with sad face and low battery bars. Auto repair and vehicle maintenance
Free with trial The image depicts a digital failure with the word FAIL prominently displayed behind a shattered glass effect. This visual metaphor represents system crashes, errors, or technological breakdowns, emphasizing the fragility and vulnerability of digital interfaces. Breakdowns vectors Broken digital display showing failure with shattered glass effect. The image depicts a digital failure with the word FAIL prominently displayed behind a. The image depicts a digital failure with the word FAIL prominently displayed behind a shattered glass effect. This visual metaphor represents system crashes, errors, or technological breakdowns, emphasizing the fragility and vulnerability of digital interfaces
Free with trial Professional presentation template featuring five colorful numbered ring elements lined up horizontally. Ideal for team task breakdowns, product release stages, and company metrics overview. Breakdowns vectors Five step circular process diagram for strategic goals. Professional presentation template featuring five colorful numbered ring elements lined up horizontally. Professional presentation template featuring five colorful numbered ring elements lined up horizontally. Ideal for team task breakdowns, product release stages, and company metrics overview
Free with trial Automotive jump starter with booster cables and clamps providing essential emergency power for vehicle battery maintenance and unexpected breakdowns, symbolizing roadside assistance and reliability. Breakdowns vectors Automotive jump starter providing emergency power illustration. Automotive jump starter with booster cables and clamps providing essential emergency power for. Automotive jump starter with booster cables and clamps providing essential emergency power for vehicle battery maintenance and unexpected breakdowns, symbolizing roadside assistance and reliability
Free with trial Clean vertical layout presenting five colorful numbered oval badges linked together. Ideal for company task breakdowns, product launch stages, and office project management reports. Breakdowns vectors Five step serpentine business process diagram for strategic goals. Clean vertical layout presenting five colorful numbered oval badges linked together. Ideal for. Clean vertical layout presenting five colorful numbered oval badges linked together. Ideal for company task breakdowns, product launch stages, and office project management reports
Free with trial Reduce AI expenses with this cost optimization control tower. Features compute spend tracking, API cost breakdowns, storage expense monitoring, training budget analysis, inference cost per request, vendor comparison views, and savings opportunity alerts. Includes forecasting and budget variance indicators. Perfect for FinOps teams, budget owners, cloud architects, and finance managers. Breakdowns vectors AI Cost Optimization Control Tower Dashboard Budget Efficiency Vector. Reduce AI expenses with this cost optimization control tower. Features compute spend. Reduce AI expenses with this cost optimization control tower. Features compute spend tracking, API cost breakdowns, storage expense monitoring, training budget analysis, inference cost per request, vendor comparison views, and savings opportunity alerts. Includes forecasting and budget variance indicators. Perfect for FinOps teams, budget owners, cloud architects, and finance managers.
Free with trial An economic data charts icons set collection exploring negative asset trends protective fund mechanisms alternative digital profits or trading breakdowns. Illustration eps10. Breakdowns vectors Cryptocurrency mining risk evaluation and financial losses icons set collection including market crashes power outages or. An economic data charts icons set. An economic data charts icons set collection exploring negative asset trends protective fund mechanisms alternative digital profits or trading breakdowns. Illustration eps10
 Sign in