Free with trial Graph paper background with vector blue plotting millimeter ruler line guide grid texture for engineering or mechanical drawing layout. Checkered A4 notebook, copybook background. Chart plotting vectors Graph paper background with vector blue plotting millimeter ruler line guide grid texture for engineering or mechanical drawing. Layout. Checkered A4 notebook
Free with trial Graph paper. seamless pattern. architect background. blue millimeter grid template. vector illustration. Chart plotting vectors Graph paper. seamless pattern. architect backgound. millimeter grid. vector. Graph paper. seamless pattern. architect background. blue millimeter grid template. Graph paper. seamless pattern. architect background. blue millimeter grid template. vector illustration
Free with trial Jamaica map. Illustration of a detailed political map of Jamaica, with its main cities, mountains and rivers. Chart plotting vectors Jamaica map. Illustration of a detailed political map of Jamaica, with its main cities, mountains and rivers
Free with trial Isometric graph paper background with plotting triangular and hexagonal ruler guide line grid texture for engineering mechanical drawing. Vector A4 graph paper template background. Chart plotting vectors Isometric graph paper background with plotting triangular and hexagonal ruler guide line grid texture for engineering mechanical. Drawing. Vector A4 graph paper
Free with trial Collection of several styles of charts and graphs in red, white and blue. Chart plotting vectors Charts and graphs. Collection of several styles of charts and graphs in red, white and blue. Collection of several styles of charts and graphs in red, white and blue.
Free with trial Inch and centimeter. Actual precision ruler of inch and centimeter for file, plus compass and protractor. Chart plotting vectors Inch and centimeter. Actual precision ruler of inch and centimeter for file, plus compass and protractor
Free with trial Electrocardiogram ( ECG , EKG ) of Ischemic Heart Disease ( Myocardial Infarction ) and Anatomy of heart icon. Chart plotting vectors Electrocardiogram ( ECG , EKG ) of Ischemic Heart Disease ( Myocardial Infarction ) and Anatomy of heart icon
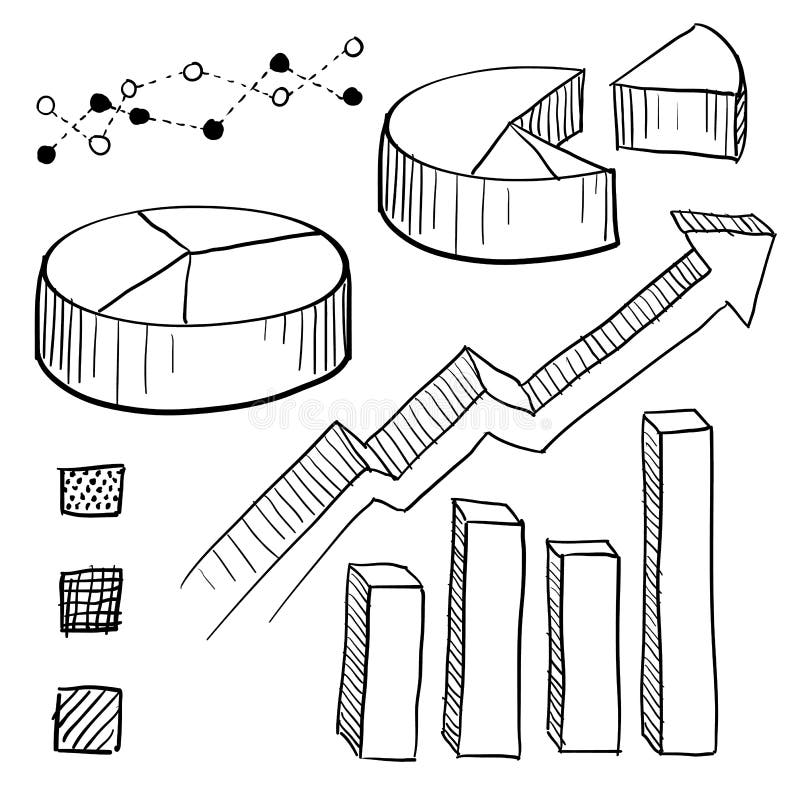
Free with trial Doodle style charts, graphs, and plotting components illustration in vector format. Set includes parts for pie charts, bar graphs, line plots, and legends. Chart plotting vectors Graph and chart elements sketch. Doodle style charts, graphs, and plotting components illustration in vector format. Set includes parts for pie charts, bar. Doodle style charts, graphs, and plotting components illustration in vector format. Set includes parts for pie charts, bar graphs, line plots, and legends.
Free with trial Vector and illustration: Data science line icon set. Included icons as big data, graph, AI, application, graph plotting, graph relation and more. Chart plotting vectors Data science line icon set. Included icons as big data, graph, AI, application, graph plotting, graph relation and more. Vector and illustration: Data science. Vector and illustration: Data science line icon set. Included icons as big data, graph, AI, application, graph plotting, graph relation and more.
Free with trial Mechanical seamless pattern II (background). Chart plotting vectors Mechanical seamless pattern II. (background
Free with trial Colored Graph Paper. Seamless pattern. Vector Grid Template. Real size. Chart plotting vectors Colored Graph Paper. Seamless pattern. Vector Grid Template. Real size
Free with trial Simple sine wave drawing. One, two and three period with 3 different width. Chart plotting vectors Simple sine wave drawing. One, two and three period with 3 different width. Simple sine wave drawing. One, two and three period with 3 different width
Free with trial Dotted graph paper background with plotting dots ruler guide grid texture for calligraphy drawing layout. Vector graph paper background 4A template. Chart plotting vectors Dotted graph paper background plotting dots ruler guide grid calligraphy drawing layout. Dotted graph paper background with plotting dots ruler guide grid. Dotted graph paper background with plotting dots ruler guide grid texture for calligraphy drawing layout. Vector graph paper background 4A template
Free with trial Isometric graph paper background with plotting triangular and hexagonal ruler guide line grid texture for engineering or mechanical layout drawing. Vector A4 graph paper template background. Chart plotting vectors Isometric graph paper background plotting triangular vector ruler line grid engineering drawing. Isometric graph paper background with plotting triangular and. Isometric graph paper background with plotting triangular and hexagonal ruler guide line grid texture for engineering or mechanical layout drawing. Vector A4 graph paper template background
Free with trial Vector graph paper background with plotting millimeter ruler line quide grid texture for engineering mechanical drawing. Chart plotting vectors Dotted graph paper background plotting dots ruler guide grid calligraphy drawing layout. Vector graph paper background with plotting millimeter ruler line quide. Vector graph paper background with plotting millimeter ruler line quide grid texture for engineering mechanical drawing
Free with trial Graph paper background with vector blue plotting millimeter ruler guide line. Grid texture for engineering or mechanical drawing layout or checkered A4 notebook, copybook background. Chart plotting vectors Graph paper background with vector blue plotting millimeter ruler guide line. Grid texture for engineering or mechanical drawing layout or checkered A4
Free with trial Graph paper background with vector blue plotting millimeter ruler line guide grid texture for engineering mechanical drawing. Checkered A4 notebook, copybook background. Chart plotting vectors Graph paper background with vector blue plotting millimeter ruler line guide grid texture for engineering mechanical drawing. Checkered A4 notebook, copybook
Free with trial Graph plotting grid paper. Millimeter paper. Simple blank sheet in cells. Squared grating background. Vector seamless pattern. Geometric checkered texture. Square grid for design prints architect plan. Chart plotting vectors Graph plotting grid paper. Millimeter paper. Simple blank sheet in cells. Squared grating background. Vector seamless pattern. Geo. Metric checkered texture. Graph plotting grid paper. Millimeter paper. Simple blank sheet in cells. Squared grating background. Vector seamless pattern. Geometric checkered texture. Square grid for design prints architect plan
Free with trial Graphing calculator, math equation, geometry figures, algebra calculator, plotting. Mobile app onboarding screens. Vector banner template for website mobile development. Web site design illustration. Chart plotting vectors Graphing calculator, math equation, geometry figures, algebra calculator, plotting. Mobile app onboarding screens. Vector banner template for website mobile
Free with trial Isometric graph paper background. Measured grid. Graph plotting grid. Corner ruler with measurement isolated on the white background. Vector graph paper template background. Chart plotting vectors Isometric graph paper background. Measured grid. Graph plotting grid. Corner ruler with measurement isolated on the. White background. Vector graph paper
Free with trial Isometric graph paper background. Measured grid. Graph plotting grid. Corner ruler with measurement isolated on the white background. Vector graph paper template background. Chart plotting vectors Isometric graph paper background. Measured grid. Graph plotting grid. Corner ruler with measurement isolated on the. White background. Vector graph paper
Free with trial Criss-cross, bisect, crosshatch lines grid, mesh. Regular graph-paper, drafting paper pattern for plotting, measurement. Squared texture. Cellular guidelines, ruler lines. Wire-frame lattice, grating - Royalty free vector illustration. Chart plotting vectors Criss-cross, bisect, crosshatch lines grid, mesh. Regular graph-paper, drafting paper pattern for plotting, measurement. Squared. Texture. Cellular guidelines. Criss-cross, bisect, crosshatch lines grid, mesh. Regular graph-paper, drafting paper pattern for plotting, measurement. Squared texture. Cellular guidelines, ruler lines. Wire-frame lattice, grating - Royalty free vector illustration
Free with trial Criss-cross, bisect, crosshatch lines grid, mesh. Regular graph-paper, drafting paper pattern for plotting, measurement. Squared texture. Cellular guidelines, ruler lines. Wire-frame lattice, grating - Royalty free vector illustration. Chart plotting vectors Criss-cross, bisect, crosshatch lines grid, mesh. Regular graph-paper, drafting paper pattern for plotting, measurement. Squared. Texture. Cellular guidelines. Criss-cross, bisect, crosshatch lines grid, mesh. Regular graph-paper, drafting paper pattern for plotting, measurement. Squared texture. Cellular guidelines, ruler lines. Wire-frame lattice, grating - Royalty free vector illustration
Free with trial Criss-cross, bisect, crosshatch lines grid, mesh. Regular graph-paper, drafting paper pattern for plotting, measurement. Squared texture. Cellular guidelines, ruler lines. Wire-frame lattice, grating - Royalty free vector illustration. Chart plotting vectors Criss-cross, bisect, crosshatch lines grid, mesh. Regular graph-paper, drafting paper pattern for plotting, measurement. Squared. Texture. Cellular guidelines. Criss-cross, bisect, crosshatch lines grid, mesh. Regular graph-paper, drafting paper pattern for plotting, measurement. Squared texture. Cellular guidelines, ruler lines. Wire-frame lattice, grating - Royalty free vector illustration
Free with trial Red line of ECG chart. On the background of bended plotting paper. Chart plotting vectors Red line of ECG chart. On the background of bended plotting paper
Free with trial Graph paper. Abstract grid color squared background. Geometric plotting paper for school education, wallpaper, textures, notebook. Lined sheet blank. Vector seamless pattern. Chart plotting vectors Graph paper. Abstract grid color squared background. Geometric plotting paper for school education, wallpaper, textures. Notebook. Lined sheet blank. Vector
Free with trial Graph paper. Abstract grid color squared background. Geometric plotting paper for school education, wallpaper, textures, notebook. Lined sheet blank. Vector seamless pattern. Chart plotting vectors Graph paper. Abstract grid color squared background. Geometric plotting paper for school education, wallpaper, textures. Notebook. Lined sheet blank. Vector
Free with trial Blueprint grid texture. Blank worksheet template for cutting mat, office work, memos, mechanics schemes, drawing, drafting, plotting, engineering or architecting measuring. Vector illustration. Chart plotting vectors Blueprint grid texture. Blank worksheet template for cutting mat, office work, memos, mechanics schemes, drawing. Drafting, plotting, engineering or. Blueprint grid texture. Blank worksheet template for cutting mat, office work, memos, mechanics schemes, drawing, drafting, plotting, engineering or architecting measuring. Vector illustration
Free with trial Paper Graph Grid. Seamless pattern vector background. Chart plotting vectors Paper Graph Grid. Seamless pattern vector background
Free with trial Mechanical pattern set. Mechanical colored seamless pattern set. Chart plotting vectors Mechanical pattern set. Mechanical colored seamless pattern set
Free with trial Mechanical colored seamless pattern II (background). Chart plotting vectors Mechanical colored seamless pattern II. (background
Free with trial Graph Paper. Seamless pattern. Vector Grid Template. Real size. Chart plotting vectors Graph Paper. Seamless pattern. Vector Grid Template. Real size
Free with trial Mechanical seamless pattern II. Mechanical colored seamless pattern II Winter version. Chart plotting vectors Mechanical seamless pattern II. Mechanical colored seamless pattern II Winter version
Free with trial Blueprint grid set Line Cross matrix geometry, four scale variations. Wide medium dense micro spacing comparison, engineering layouts dashboards notebook pages interface planning systems graphics. Chart plotting vectors Blueprint grid set Line Cross matrix geometry, four scale variations. Wide medium dense micro spacing comparison,. Engineering layouts dashboards notebook pages. Blueprint grid set Line Cross matrix geometry, four scale variations. Wide medium dense micro spacing comparison, engineering layouts dashboards notebook pages interface planning systems graphics.
Free with trial Graph paper. A4 sheet with millimeter grid. Chart plotting vectors Graph paper. A4 sheet with millimeter grid
Free with trial Graph paper. A5 sheet with millimeter grid. Chart plotting vectors Graph paper. A5 sheet with millimeter grid
Free with trial Millimeter graph paper grid. Abstract squared background. Geometric pattern for school, technical engineering line scale measurement. Lined blank for education isolated on transparent background. Chart plotting vectors Millimeter graph paper grid. Abstract squared background. Geometric pattern for school, technical engineering line scale. Measurement. Lined blank for education. Millimeter graph paper grid. Abstract squared background. Geometric pattern for school, technical engineering line scale measurement. Lined blank for education isolated on transparent background.
Free with trial Dashed line grid paper with white pattern background vector illustration eps10. Chart plotting vectors Dashed line grid paper with white pattern background vector illustration eps10.
Free with trial Flat Design Infographic Elements. Vector Graphics EPS 10. Chart plotting vectors Infographic Elements. Flat Design Infographic Elements. Vector Graphics EPS 10. Flat Design Infographic Elements. Vector Graphics EPS 10.
Free with trial Graph paper sheet. Blue grid. White background. Vector illustration. EPS 10. Chart plotting vectors Graph paper sheet. Blue grid. White background. Vector illustration. EPS 10
Free with trial Sheet graph paper background. Architect background. Millimeter paper sheet grid. Geometry concept. Vector illustration. Chart plotting vectors Sheet graph paper background. Architect background. Millimeter paper sheet grid. Geometry concept. Vector illustration
Free with trial Millimeter graph paper grid. Abstract squared background. Geometric pattern for school, technical engineering line scale measurement. Lined blank for education isolated on transparent background. Chart plotting vectors Millimeter graph paper grid. Abstract squared background. Geometric pattern for school, technical engineering line scale. Measurement. Lined blank for education. Millimeter graph paper grid. Abstract squared background. Geometric pattern for school, technical engineering line scale measurement. Lined blank for education isolated on transparent background.
Free with trial Inch graph paper grid. Blue pattern for drawings, engineering, projects, architects. Background for education, training, universities, colleges and schools. Chart plotting vectors Inch graph paper grid. Blue pattern for drawings, engineering, projects, architects. Background for education, training, universities, colleges and schools
Free with trial Millimeter graph paper grid. Abstract squared background. Geometric pattern for school, technical engineering line scale measurement. Lined blank for education isolated on transparent background. Chart plotting vectors Millimeter graph paper grid. Abstract squared background. Geometric pattern for school, technical engineering line scale. Measurement. Lined blank for education. Millimeter graph paper grid. Abstract squared background. Geometric pattern for school, technical engineering line scale measurement. Lined blank for education isolated on transparent background.
Free with trial Millimeter graph paper grid. Abstract squared background. Geometric pattern for school, technical engineering line scale measurement. Lined blank for education isolated on transparent background. Chart plotting vectors Millimeter graph paper grid. Abstract squared background. Geometric pattern for school, technical engineering line scale. Measurement. Lined blank for education. Millimeter graph paper grid. Abstract squared background. Geometric pattern for school, technical engineering line scale measurement. Lined blank for education isolated on transparent background.
Free with trial Sheet of graph paper with grid. Millimeter paper texture, geometric pattern. Gray lined blank for drawing, studying, technical engineering or scale measurement. Vector illustration. Chart plotting vectors Sheet of graph paper with grid. Millimeter paper texture, geometric pattern. Gray lined blank for drawing, studying. Technical engineering or scale measurement
Free with trial Millimeter graph paper grid. Abstract squared background. Geometric pattern for school, technical engineering line scale measurement. Lined blank for education isolated on transparent background. Chart plotting vectors Millimeter graph paper grid. Abstract squared background. Geometric pattern for school, technical engineering line scale. Measurement. Lined blank for education. Millimeter graph paper grid. Abstract squared background. Geometric pattern for school, technical engineering line scale measurement. Lined blank for education isolated on transparent background.
Free with trial Image of basic axis intersection for plotting chart on notebook sheet of checkered paper. School paper sheet lined in a cage with mathematical drawing of axis intersection. Simple vector. Chart plotting vectors Basic Axis Intersection For Plotting Chart. Image of basic axis intersection for plotting chart on notebook sheet of checkered paper. School paper sheet lined in. Image of basic axis intersection for plotting chart on notebook sheet of checkered paper. School paper sheet lined in a cage with mathematical drawing of axis intersection. Simple vector
Free with trial Chart and graph set featuring data. Statistics analysis visualization diagram report dashboard business analytics metrics distribution histogram scatter column. Chart plotting vectors Chart and graph set featuring data. Statistics analysis visualization diagram report dashboard business analytics metrics distribution histogram scatter column
Free with trial Chart and graph set featuring data. Statistics analysis visualization diagram report dashboard business analytics metrics distribution histogram scatter column. Chart plotting vectors Chart and graph set featuring data. Statistics analysis visualization diagram report dashboard business analytics metrics distribution histogram scatter column
Free with trial Line infographic chart template. Plotting data points. Value changes over continuous time. Process displaying dashboard. Pitch deck presentation slide. Data visualization. Lexend font used. Chart plotting vectors Line infographic chart template. Plotting data points. Value changes over continuous time. Process displaying dashboard. Pitch deck presentation slide. Data
Free with trial Woman pointing to a chart showcasing four plant growth stages seed, sprout, young plant, and mature tree. Ideal for education, research, biology, analytics strategy growth progress. Simple flat. Chart plotting vectors Woman Analyzing Plant Growth Stages on a Chart with Data Visualization. Woman pointing to a chart showcasing four plant growth stages seed, sprout, young plant. Woman pointing to a chart showcasing four plant growth stages seed, sprout, young plant, and mature tree. Ideal for education, research, biology, analytics strategy growth progress. Simple flat
Free with trial Chart and graph set featuring data. Statistics analysis visualization diagram report dashboard business analytics metrics distribution histogram scatter column. Chart plotting vectors Chart and graph set featuring data. Statistics analysis visualization diagram report dashboard business analytics metrics distribution histogram scatter column
Free with trial Educational area chart illustration displaying connected data points with a shaded region beneath the line. Useful for statistics, business reporting, data visualization, analytics, financial analysis, research presentations, and educational materials. Chart plotting vectors Area Chart with Data Points and Line Graph for Statistics and Data Analysis. Educational area chart illustration displaying connected data points with a shaded. Educational area chart illustration displaying connected data points with a shaded region beneath the line. Useful for statistics, business reporting, data visualization, analytics, financial analysis, research presentations, and educational materials.
Free with trial Business growth, data analysis, agriculture, development, progress tracking, research. Visual chart showing plant growth stages and checkmark symbol. Business growth and data analysis concept. Chart plotting vectors Growth and Development Stages Chart with Graphical Indicators for Analysis and Evaluation. Business growth, data analysis, agriculture, development, progress. Business growth, data analysis, agriculture, development, progress tracking, research. Visual chart showing plant growth stages and checkmark symbol. Business growth and data analysis concept
Free with trial Bubble chart illustration displaying data points of varying sizes on a coordinate system. Suitable for statistics, analytics, business intelligence, research presentations, and educational content. Chart plotting vectors Bubble Chart with Multiple Data Points for Statistics and Data Visualization. Bubble chart illustration displaying data points of varying sizes on a coordinate. Bubble chart illustration displaying data points of varying sizes on a coordinate system. Suitable for statistics, analytics, business intelligence, research presentations, and educational content.
Free with trial Scientific bar chart illustration featuring error bars for data variability and measurement uncertainty. Ideal for research publications, laboratory reports, statistics, data analysis, and educational resources. Chart plotting vectors Bar Chart with Error Bars for Scientific Research and Statistical Analysis. Scientific bar chart illustration featuring error bars for data variability and. Scientific bar chart illustration featuring error bars for data variability and measurement uncertainty. Ideal for research publications, laboratory reports, statistics, data analysis, and educational resources.
Free with trial Bar chart illustration featuring grouped columns for comparing multiple categories and datasets. Suitable for business reports, statistics, research presentations, dashboards, and educational materials. Chart plotting vectors Grouped Bar Chart Illustration for Statistical Comparison and Data Analysis. Bar chart illustration featuring grouped columns for comparing multiple categories. Bar chart illustration featuring grouped columns for comparing multiple categories and datasets. Suitable for business reports, statistics, research presentations, dashboards, and educational materials.
Free with trial Stacked bar chart showing category proportions within multiple groups. Ideal for business reporting, statistical analysis, dashboards, educational materials, and research presentations. Chart plotting vectors Stacked Bar Chart Illustration for Category Composition and Data Comparison. Stacked bar chart showing category proportions within multiple groups. Ideal for. Stacked bar chart showing category proportions within multiple groups. Ideal for business reporting, statistical analysis, dashboards, educational materials, and research presentations
Free with trial Red line of ECG chart on the background of bended plotting paper, vector illustration. Chart plotting vectors Red line of ECG chart on the background of plotting paper, vector illustration. Red line of ECG chart on the background of bended plotting paper, vector. Red line of ECG chart on the background of bended plotting paper, vector illustration
Free with trial A red line graph is displayed on a white grid background. The line oscillates up and down across the chart, resembling a waveform or an ECG (electrocardiogram) output. The grid appears to consist of small, evenly spaced squares, suggesting it is used for precise plotting of the waveform data. The overall aesthetic is clean and technical, indicating analysis or monitoring. Chart plotting vectors Heartbeat on an ECG graph. A red line graph is displayed on a white grid background. The line oscillates up and down across the chart, resembling a waveform or. A red line graph is displayed on a white grid background. The line oscillates up and down across the chart, resembling a waveform or an ECG (electrocardiogram) output. The grid appears to consist of small, evenly spaced squares, suggesting it is used for precise plotting of the waveform data. The overall aesthetic is clean and technical, indicating analysis or monitoring.
Free with trial A technical drawing featuring a circular polar coordinate system and an octagonal radar chart with a blue plotted data line. Chart plotting vectors Hand-drawn diagrams showing a polar coordinate grid system and a spiderweb radar chart data illustration. A technical drawing featuring a circular polar. A technical drawing featuring a circular polar coordinate system and an octagonal radar chart with a blue plotted data line
Free with trial Data analysis concept. Data analysis with graph chart, user working on a tablet, and phone communication icon. Data analysis for business, communication, reporting, technology, and statistics. Chart plotting vectors Data Analysis and Communication Concept with Graph Chart, Tablet User, and Phone Icon. Data analysis concept. Data analysis with graph chart, user working on a. Data analysis concept. Data analysis with graph chart, user working on a tablet, and phone communication icon. Data analysis for business, communication, reporting, technology, and statistics
Free with trial Pie chart, bar graph, and icons of users with trendline plotting statistics and behavior. Ideal for data analysis, business growth, decision-making, research, reports, user insights performance. Chart plotting vectors Data Analytics with Pie Chart, Bar Graph, and User Activity Tracking. Pie chart, bar graph, and icons of users with trendline plotting statistics and behavior. Pie chart, bar graph, and icons of users with trendline plotting statistics and behavior. Ideal for data analysis, business growth, decision-making, research, reports, user insights performance
Free with trial Artificial intelligence, data analysis, innovation, robotic technology, future concepts, and creativity. Robot viewing a pie chart with a stylized lotus pattern. Artificial intelligence and data. Chart plotting vectors Futuristic Robot Analyzing Data with Pie Chart and Lotus Shape Technology and Innovation. Artificial intelligence, data analysis, innovation, robotic technology. Artificial intelligence, data analysis, innovation, robotic technology, future concepts, and creativity. Robot viewing a pie chart with a stylized lotus pattern. Artificial intelligence and data
Free with trial Black and white icon of a pencil ruler and graph chart on a white background , urban background. Chart plotting vectors Black and white icon of a pencil ruler and graph chart on a white background for business and education concepts s. Black and white icon of a pencil ruler and. Black and white icon of a pencil ruler and graph chart on a white background , urban background
Free with trial Set of Abstract Trend Arrows and Curved Data Lines. Graph Chart Stages Elements for Growth, Decline, Progress Presentation. Photo. Chart plotting vectors Set of Abstract Trend Arrows and Curved Data Lines. Graph Chart Stages Elements for Growth, Decline, Progress Presentation. Photo
Free with trial This advanced nautical chart visualizes complex marine data including depth soundings and navigation pathways, offering a glimpse into future maritime technology and exploration capabilities. Chart plotting vectors Advanced nautical chart displaying marine depth data and navigation routes for future sea exploration. This advanced nautical chart visualizes complex marine. This advanced nautical chart visualizes complex marine data including depth soundings and navigation pathways, offering a glimpse into future maritime technology and exploration capabilities
Free with trial Data analysis, business strategy, market trends, location tracking, financial growth, and decision-making. Pie chart and line graph near a location pin. Data analysis and business strategy visual. Chart plotting vectors Data Visualization with Graphs, Pie Chart, Line Connections, and Map Pin for Business Analytics. Data analysis, business strategy, market trends, location. Data analysis, business strategy, market trends, location tracking, financial growth, and decision-making. Pie chart and line graph near a location pin. Data analysis and business strategy visual
Free with trial A simple transparent and white icon showing a line graph, a pie chart and a bar graph with an arrow pointing upwards. Chart plotting vectors A graph and a pie chart with an arrow pointing up. A simple transparent and white icon showing a line graph, a pie chart and a bar graph with an arrow pointing. a simple transparent and white icon showing a line graph, a pie chart and a bar graph with an arrow pointing upwards
Free with trial Graph Diagram Chart, icon in line design. Graph, diagram, chart, data, analysis, growth, statistics on white background vector. Graph Diagram Chart editable stroke icon. Chart plotting vectors Graph Diagram Chart, icon in line design. Graph, diagram, chart, data, analysis, growth, statistics on white background. Vector. Graph Diagram Chart editable
Free with trial This finance economy vector pack presents bar chart, bull, scale and bank as bold black silhouettes with smooth edges and balanced proportions. the grid of icons shares a uniform stroke weight and spacing, which keeps the set tidy, readable and easy to combine in a single project. you also get money bag, tax, bear and loan, giving you a wide range of ready-to-use graphic elements for different themes and layouts. these glyphs work well for websites, mobile apps, user interfaces, infographics, menus, flyers, posters, banners, labels, packaging and presentations. the monochrome look makes it simple to change colors, add gradients or place the symbols over photos and backgrounds. cut files, vinyl plotting, laser engraving, embroidery patterns and screen printing also benefit from the clear silhouette shapes. add this finance economy set to your library and create attractive, consistent visuals for any project. Chart plotting vectors Finance economy glyph icons, coin, calculator, gold bar, bar chart. This finance economy vector pack presents bar chart, bull, scale and bank as bold black. This finance economy vector pack presents bar chart, bull, scale and bank as bold black silhouettes with smooth edges and balanced proportions. the grid of icons shares a uniform stroke weight and spacing, which keeps the set tidy, readable and easy to combine in a single project. you also get money bag, tax, bear and loan, giving you a wide range of ready-to-use graphic elements for different themes and layouts. these glyphs work well for websites, mobile apps, user interfaces, infographics, menus, flyers, posters, banners, labels, packaging and presentations. the monochrome look makes it simple to change colors, add gradients or place the symbols over photos and backgrounds. cut files, vinyl plotting, laser engraving, embroidery patterns and screen printing also benefit from the clear silhouette shapes. add this finance economy set to your library and create attractive, consistent visuals for any project.
Free with trial Area Chart Icon linear logo isolated. Area Chart Icon Flat thin line vector illustration art outline set. Chart plotting vectors Area Chart Icon linear logo isolated. Area Chart Icon Flat thin line vector illustration art outline set
Free with trial This finance economy vector pack presents safe, piggy bank, bar chart and bull as bold black silhouettes with smooth edges and balanced proportions. the grid of icons shares a uniform stroke weight and spacing, which keeps the set tidy, readable and easy to combine in a single project. you also get bear, coin, bank and investment, giving you a wide range of ready-to-use graphic elements for different themes and layouts. use them in logo design, branding, signage, stickers, print materials, greeting cards, social graphics, educational material and editorial layouts. because the shapes are simple and high contrast, they remain legible at small sizes and look equally good when scaled up for large prints. cut files, vinyl plotting, laser engraving, embroidery patterns and screen printing also benefit from the clear silhouette shapes. download this finance economy collection and speed up your creative workflow with reliable, professional graphic elements. Chart plotting vectors Finance economy silhouette collection with calculator, pie chart. This finance economy vector pack presents safe, piggy bank, bar chart and bull as bold black. This finance economy vector pack presents safe, piggy bank, bar chart and bull as bold black silhouettes with smooth edges and balanced proportions. the grid of icons shares a uniform stroke weight and spacing, which keeps the set tidy, readable and easy to combine in a single project. you also get bear, coin, bank and investment, giving you a wide range of ready-to-use graphic elements for different themes and layouts. use them in logo design, branding, signage, stickers, print materials, greeting cards, social graphics, educational material and editorial layouts. because the shapes are simple and high contrast, they remain legible at small sizes and look equally good when scaled up for large prints. cut files, vinyl plotting, laser engraving, embroidery patterns and screen printing also benefit from the clear silhouette shapes. download this finance economy collection and speed up your creative workflow with reliable, professional graphic elements.
Free with trial Black finance economy symbols featuring gold bar, bear, piggy bank and loan, built from clean shapes that stay sharp at any size. every symbol in this collection follows the same visual weight, corner treatment and level of detail, so the icons sit together naturally in one layout. you also get tax, bull, bar chart and safe, giving you a wide range of ready-to-use graphic elements for different themes and layouts. they are suitable for app buttons, web navigation, brochures, business cards, product labels, wall art, merchandise designs and digital publications. the solid black artwork is easy to recolor, resize and combine with text, which makes it flexible for both digital and print production. cut files, vinyl plotting, laser engraving, embroidery patterns and screen printing also benefit from the clear silhouette shapes. add this finance economy set to your library and create attractive, consistent visuals for any project. Chart plotting vectors Finance economy glyph icons, investment, pie chart, scale, gold bar. Black finance economy symbols featuring gold bar, bear, piggy bank and loan, built from. Black finance economy symbols featuring gold bar, bear, piggy bank and loan, built from clean shapes that stay sharp at any size. every symbol in this collection follows the same visual weight, corner treatment and level of detail, so the icons sit together naturally in one layout. you also get tax, bull, bar chart and safe, giving you a wide range of ready-to-use graphic elements for different themes and layouts. they are suitable for app buttons, web navigation, brochures, business cards, product labels, wall art, merchandise designs and digital publications. the solid black artwork is easy to recolor, resize and combine with text, which makes it flexible for both digital and print production. cut files, vinyl plotting, laser engraving, embroidery patterns and screen printing also benefit from the clear silhouette shapes. add this finance economy set to your library and create attractive, consistent visuals for any project.
Free with trial Area Chart Icon Flat simple outline set. Area Chart Icon set in thin line outline style and linear vector sign. Chart plotting vectors Area Chart Icon Flat simple outline set. Area Chart Icon set in thin line outline style and linear vector sign
Free with trial Finance economy icon collection with bar chart, pie chart, coin and gold bar, drawn as crisp black solid glyphs on a clean white background. the grid of icons shares a uniform stroke weight and spacing, which keeps the set tidy, readable and easy to combine in a single project. you also get bear, piggy bank, tax and bull, giving you a wide range of ready-to-use graphic elements for different themes and layouts. these glyphs work well for websites, mobile apps, user interfaces, infographics, menus, flyers, posters, banners, labels, packaging and presentations. because the shapes are simple and high contrast, they remain legible at small sizes and look equally good when scaled up for large prints. cut files, vinyl plotting, laser engraving, embroidery patterns and screen printing also benefit from the clear silhouette shapes. download this finance economy collection and speed up your creative workflow with reliable, professional graphic elements. Chart plotting vectors Finance economy glyph icons, safe, investment, stock market, bar chart. Finance economy icon collection with bar chart, pie chart, coin and gold bar, drawn as. Finance economy icon collection with bar chart, pie chart, coin and gold bar, drawn as crisp black solid glyphs on a clean white background. the grid of icons shares a uniform stroke weight and spacing, which keeps the set tidy, readable and easy to combine in a single project. you also get bear, piggy bank, tax and bull, giving you a wide range of ready-to-use graphic elements for different themes and layouts. these glyphs work well for websites, mobile apps, user interfaces, infographics, menus, flyers, posters, banners, labels, packaging and presentations. because the shapes are simple and high contrast, they remain legible at small sizes and look equally good when scaled up for large prints. cut files, vinyl plotting, laser engraving, embroidery patterns and screen printing also benefit from the clear silhouette shapes. download this finance economy collection and speed up your creative workflow with reliable, professional graphic elements.
Free with trial Area Chart Icon Symbol mark in filled style. Area Chart Icon Vector symbol or sign set collection in black and white outline. Chart plotting vectors Area Chart Icon Symbol mark in filled style. Area Chart Icon Vector symbol or sign set collection in black and white outline
Free with trial A versatile four-quadrant split grid chart featuring intersecting axes with arrows, representing coordinate systems, growth, strategy, or data organization. Includes ample copy space for text, labels, and business presentation infographics. Chart plotting vectors Four Quadrant Split Chart Grid with Arrows Indicating Growth and Directional Axis. A versatile four-quadrant split grid chart featuring intersecting axes with. A versatile four-quadrant split grid chart featuring intersecting axes with arrows, representing coordinate systems, growth, strategy, or data organization. Includes ample copy space for text, labels, and business presentation infographics.
Free with trial This finance economy vector pack presents coin, gold bar, stock market and bar chart as bold black silhouettes with smooth edges and balanced proportions. the grid of icons shares a uniform stroke weight and spacing, which keeps the set tidy, readable and easy to combine in a single project. the sheet continues with money bag, tax, bull and investment, so one download covers many different concepts and scenes. they are suitable for app buttons, web navigation, brochures, business cards, product labels, wall art, merchandise designs and digital publications. because the shapes are simple and high contrast, they remain legible at small sizes and look equally good when scaled up for large prints. cut files, vinyl plotting, laser engraving, embroidery patterns and screen printing also benefit from the clear silhouette shapes. download this finance economy collection and speed up your creative workflow with reliable, professional graphic elements. Chart plotting vectors Finance economy icon set, pie chart, bank, bear black vector silhouette glyph collection. This finance economy vector pack presents coin, gold bar, stock market. This finance economy vector pack presents coin, gold bar, stock market and bar chart as bold black silhouettes with smooth edges and balanced proportions. the grid of icons shares a uniform stroke weight and spacing, which keeps the set tidy, readable and easy to combine in a single project. the sheet continues with money bag, tax, bull and investment, so one download covers many different concepts and scenes. they are suitable for app buttons, web navigation, brochures, business cards, product labels, wall art, merchandise designs and digital publications. because the shapes are simple and high contrast, they remain legible at small sizes and look equally good when scaled up for large prints. cut files, vinyl plotting, laser engraving, embroidery patterns and screen printing also benefit from the clear silhouette shapes. download this finance economy collection and speed up your creative workflow with reliable, professional graphic elements.
 Sign in