Free with trial Solution. Solid in liquid. Solution is a homogeneous mixture. Substance dissolved in another substance. Constant temperature vectors Solution. Solid in liquid. Solution is a homogeneous mixture. Substance dissolved in another substance. Solid in liquid
Free with trial Body temperature and thermoregulation. Normal, Cold, and Hot. The core remains largely constant in temperature, the temperature of the body shell is subject to external and internal influences. Constant temperature vectors Body temperature and thermoregulation. Normal, Cold, and Hot. The core remains largely constant in temperature, the temperature of the body shell is subject to
Free with trial Gay lussac law infographic diagram example ideal gas constant volume pressure absolute temperature cold boiling water relationship physics dynamics mechanics education vector chart illustration. Constant temperature vectors Gay lussac law infographic diagram example. Ideal gas constant volume pressure absolute temperature cold boiling water relationship physics dynamics mechanics. Gay lussac law infographic diagram example ideal gas constant volume pressure absolute temperature cold boiling water relationship physics dynamics mechanics education vector chart illustration
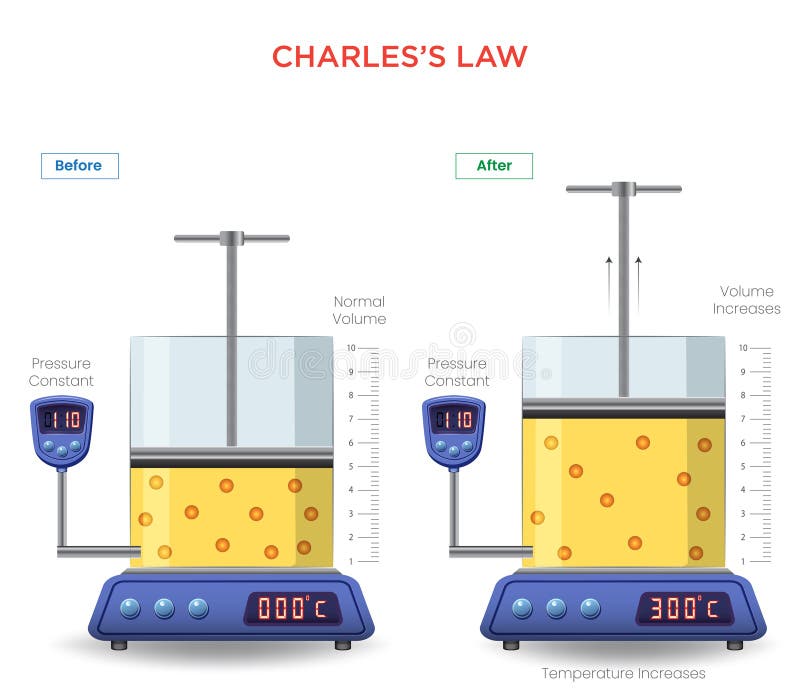
Free with trial Charles law infographic diagram example expand heat compress cold ideal gas experiment lab pressure temperature relationship physics dynamics mechanics education vector chart illustration. Constant temperature vectors Charles law infographic diagram example expand heat compress cold ideal gas experiment. Lab pressure temperature relationship physics dynamics mechanics. Charles law infographic diagram example expand heat compress cold ideal gas experiment lab pressure temperature relationship physics dynamics mechanics education vector chart illustration
Free with trial Boyle's Law, Relationship between pressure and volume of gas at constant temperature. Boyle's law diagram (relationship between pressure and volume. Constant temperature vectors Boyle\'s Law, Relationship between pressure and volume of gas at constant temperature. Boyle's Law, Relationship between pressure and volume of gas at constant. Boyle's Law, Relationship between pressure and volume of gas at constant temperature. Boyle's law diagram (relationship between pressure and volume
Free with trial Boyle's Law states that the pressure of a gas is inversely proportional to its volume at constant temperature, meaning as volume increases, pressure decreases. Constant temperature vectors Boyle\'s Law Relationship Between Pressure and Volume of Gases at Constant Temperature. Boyle's Law states that the pressure of a gas is inversely proportional. Boyle's Law states that the pressure of a gas is inversely proportional to its volume at constant temperature, meaning as volume increases, pressure decreases
Free with trial Charles's law. relationship between volume and temperature. Increasing the temperature of a gas at constant pressure increases its volume. Explanation of the action of the law of volumes on the example of two balloons. Vector poster for education. Constant temperature vectors Charles\'s law. relationship between volume and temperature. Charles's law. relationship between volume and temperature. Increasing the temperature of a gas at. Charles's law. relationship between volume and temperature. Increasing the temperature of a gas at constant pressure increases its volume. Explanation of the action of the law of volumes on the example of two balloons. Vector poster for education
Free with trial Charles's Law states that the volume of a gas increases with temperature, provided pressure is constant, showing a direct relationship between volume and temperature. Constant temperature vectors Understanding Charles\'s Law The Relationship Between Gas Volume and Temperature. Charles's Law states that the volume of a gas increases with temperature. Charles's Law states that the volume of a gas increases with temperature, provided pressure is constant, showing a direct relationship between volume and temperature
Free with trial Avogadro Law Infographic Diagram with example of nitrogen oxygen and carbon dioxide balloon. volume number of molecule quantity mass constant temperature and pressure atom substance for physics science education vector. Constant temperature vectors Avogadro Law Infographic Diagram with example. Of nitrogen oxygen and carbon dioxide balloon. volume number of molecule quantity mass constant temperature and. Avogadro Law Infographic Diagram with example of nitrogen oxygen and carbon dioxide balloon. volume number of molecule quantity mass constant temperature and pressure atom substance for physics science education vector
Free with trial Charles Law Infographic Diagram with example of helium balloon when volume increase temperature increase then crumble gas amount pressure constant experiment and observation for physics science education vector. Constant temperature vectors Charles Law Infographic Diagram with example of helium balloon. When volume increase temperature increase then crumble gas amount pressure constant experiment. Charles Law Infographic Diagram with example of helium balloon when volume increase temperature increase then crumble gas amount pressure constant experiment and observation for physics science education vector
Free with trial Boyle law infographic diagram absolute pressure ideal gas volume amount mass constant temperature physics dynamics mechanics education vector chart illustration scheme closed system. Constant temperature vectors Boyle law infographic diagram absolute pressure ideal gas volume amount. Mass constant temperature physics dynamics mechanics education vector chart. Boyle law infographic diagram absolute pressure ideal gas volume amount mass constant temperature physics dynamics mechanics education vector chart illustration scheme closed system
Free with trial Boyle's Law, Relationship between pressure and volume of gas at constant temperature. Boyle's law diagram (relationship between pressure and volume. Constant temperature vectors Boyle\'s law showing the Pressure and volume relationship. Boyle's Law, Relationship between pressure and volume of gas at constant temperature. Boyle's law. Boyle's Law, Relationship between pressure and volume of gas at constant temperature. Boyle's law diagram (relationship between pressure and volume
Free with trial Gay Lussac Law Infographic Diagram example of pressure cooker continuous heat applied result in continuous temperature pressure increase valve release overpressure physics science education vector. Constant temperature vectors Gay Lussac Law Infographic Diagram. Example of pressure cooker continuous heat applied result in continuous temperature pressure increase valve release. Gay Lussac Law Infographic Diagram example of pressure cooker continuous heat applied result in continuous temperature pressure increase valve release overpressure physics science education vector
Free with trial Avogadro's Law states that equal volumes of gases, at the same temperature and pressure, contain the same number of molecules, regardless of type. Constant temperature vectors Understanding Avogadro\'s Law The Relationship Between Gas Volume and Molecules. Avogadro's Law states that equal volumes of gases, at the same temperature and. Avogadro's Law states that equal volumes of gases, at the same temperature and pressure, contain the same number of molecules, regardless of type
Free with trial Gibbs free energy, denoted G, combines enthalpy and entropy into a single value. The change in free energy, ΔG, is equal to the sum of the enthalpy plus the product of the temperature and entropy of the system. Constant temperature vectors Changes in Gibbs Free Energy depicted in a reaction diagram of a thermodynamically favorable reaction. Gibbs free energy, denoted G, combines enthalpy and. Gibbs free energy, denoted G, combines enthalpy and entropy into a single value. The change in free energy, ΔG, is equal to the sum of the enthalpy plus the product of the temperature and entropy of the system
Free with trial Four black battery illustrations on a transparent background. The top left depicts a fully charged battery with four bars. The top right shows a partially charged battery with three bars. The bottom left has a battery with a lightning bolt symbol, representing charging. The bottom right displays a low battery with one bar. Each icon features a simple black outline, emphasizing different battery charge states. Constant temperature vectors Icon, 4 battery illustrations, black, transparent background. Four black battery illustrations on a transparent background. The top left depicts a fully charged. Four black battery illustrations on a transparent background. The top left depicts a fully charged battery with four bars. The top right shows a partially charged battery with three bars. The bottom left has a battery with a lightning bolt symbol, representing charging. The bottom right displays a low battery with one bar. Each icon features a simple black outline, emphasizing different battery charge states.
Free with trial Hair Dryer properties icons set - Brushless motor, Constant temperature, Low noise. Pictograms for labeling in bold line. Constant temperature vectors Hair Dryer icons - Brushless motor, Constant temperature, Low noise. in bold line. Hair Dryer properties icons set - Brushless motor, Constant temperature, Low. Hair Dryer properties icons set - Brushless motor, Constant temperature, Low noise. Pictograms for labeling in bold line
Free with trial A network of sensors installed on airplanes providing constant feedback on engine performance temperature and altitude. Vector illustration AI generated. Constant temperature vectors A network of sensors installed on airplanes providing constant feedback on engine performance temperature and altitude. Vector illustration AI generated
Free with trial Constant temperature control sensor line icon vector. constant temperature control sensor sign. isolated symbol illustration. Constant temperature vectors Constant temperature control sensor icon color illustration. Constant temperature control sensor line icon vector. constant temperature control sensor sign. constant temperature control sensor line icon vector. constant temperature control sensor sign. isolated symbol illustration
Free with trial Illustration of physics, Ohm´s Law, electrical current electric flow conductor point voltage resistance relationship temperature constant, Ohm law infographic diagram. Constant temperature vectors Illustration of physics, Ohm´s Law, electrical current electric flow. Conductor point voltage resistance relationship temperature constant, Ohm law infographic
Free with trial Pressure Volume Relationship - a minimal icon of Boyle's law, published by Robert Boyle in 1662. Hold a gas at one temperature and its pressure varies inversely with volume: halve the space and it doubles, so their product never changes. The artwork plots this as a smooth falling curve on axes marked P and V. Two solid dots sit on that isotherm, and dashed guide lines from each form rectangles of equal area, a visual proof that PV stays fixed. A chevron points from the roomier state toward the squeezed one. Directly beneath each dot is its own cylinder. The right one holds six particles spread through a tall chamber in the left one a downward force drives the piston until those same molecules crowd into one third of the room, where they strike the walls three times as often. Syringes, bicycle pumps, diving tanks and breathing lungs all follow this rule. Crisp at any scale in cyan on deep teal. Constant temperature vectors Pressure Volume Relationship Physics Vector Icon Boyle's Law Curve and Piston Cylinders. Pressure Volume Relationship - a minimal icon of Boyle's law, published. Pressure Volume Relationship - a minimal icon of Boyle's law, published by Robert Boyle in 1662. Hold a gas at one temperature and its pressure varies inversely with volume: halve the space and it doubles, so their product never changes. The artwork plots this as a smooth falling curve on axes marked P and V. Two solid dots sit on that isotherm, and dashed guide lines from each form rectangles of equal area, a visual proof that PV stays fixed. A chevron points from the roomier state toward the squeezed one. Directly beneath each dot is its own cylinder. The right one holds six particles spread through a tall chamber in the left one a downward force drives the piston until those same molecules crowd into one third of the room, where they strike the walls three times as often. Syringes, bicycle pumps, diving tanks and breathing lungs all follow this rule. Crisp at any scale in cyan on deep teal
Free with trial House roof ventilation ensuring constant air flow. Line drawing of a house with arrows showing the constant airflow and ventilation. Constant temperature vectors House roof ventilation ensuring constant air flow. Line drawing of a house with arrows showing the constant airflow and ventilation
Free with trial Bright solar flares occurring on the surface of the Sun. A powerful release of energy and plasma into outer space. The concept of astronomy, space weather, solar activity, and space exploration. Constant temperature vectors Bright solar flares occurring on the surface of the Sun. A powerful release of energy and plasma into outer space. The concept of astronomy, space weather
Free with trial A detailed notebook spread with physics and math formulas, including thermodynamics, calculus reminders, statistics, and Fourier series. Magnifying glass and a pen are on the table. Constant temperature vectors Thermodynamics and Calculus Notes. A detailed notebook spread with physics and math formulas, including thermodynamics, calculus reminders, statistics, and. A detailed notebook spread with physics and math formulas, including thermodynamics, calculus reminders, statistics, and Fourier series. Magnifying glass and a pen are on the table.
Free with trial Illustration of quantum physics and chemistry, Quarks Collision, Proton Collisions, quarks in collisions between heavy nuclei, Quark antiquark collisions, Standard Model of particle physics. Constant temperature vectors Illustration of quantum physics and chemistry, Quarks Collision, Proton Collisions. Quarks in collisions between heavy nuclei, Quark antiquark collisions. illustration of quantum physics and chemistry, Quarks Collision, Proton Collisions, quarks in collisions between heavy nuclei, Quark antiquark collisions, Standard Model of particle physics
Free with trial Water heater tank, a modern appliance ensuring a constant supply of hot water for showering, washing, and other household needs. Constant temperature vectors Water heater tank providing hot water supply for domestic needs. Water heater tank, a modern appliance ensuring a constant supply of hot water for showering. Water heater tank, a modern appliance ensuring a constant supply of hot water for showering, washing, and other household needs
Free with trial The trajectory of the Brownian motion of the particle. Vector illustration. Constant temperature vectors The trajectory of the Brownian motion of the particle. Vector illustration
Free with trial Modern electric water heater providing hot water supply. Electric water heater providing a constant supply of hot water for residential and commercial use. Constant temperature vectors Modern electric water heater providing hot water supply. Electric water heater providing a constant supply of hot water for residential and commercial use
Free with trial Constant temperature digital display magnetic stirrer diagram for experiment setup lab outline vector. Illustration. Constant temperature vectors Constant temperature digital display magnetic stirrer diagram for experiment setup lab outline vector. Illustration
Free with trial Constant temperature control sensor glyph icon vector. constant temperature control sensor sign. isolated contour symbol black illustration. Constant temperature vectors Constant temperature control sensor glyph icon vector illustration. Constant temperature control sensor glyph icon vector. constant temperature control sensor. Constant temperature control sensor glyph icon vector. constant temperature control sensor sign. isolated contour symbol black illustration
Free with trial Constant temperature control sensor color icon vector. constant temperature control sensor sign. isolated symbol illustration. Constant temperature vectors Constant temperature control sensor color icon vector illustration. Constant temperature control sensor color icon vector. constant temperature control sensor. Constant temperature control sensor color icon vector. constant temperature control sensor sign. isolated symbol illustration
Free with trial Constant temperature control sensor isometric icon vector. constant temperature control sensor sign. isolated symbol illustration. Constant temperature vectors Constant temperature control sensor isometric icon vector illustration. Constant temperature control sensor isometric icon vector. constant temperature control. Constant temperature control sensor isometric icon vector. constant temperature control sensor sign. isolated symbol illustration
Free with trial Constant temperature control sensor line icon vector. constant temperature control sensor sign. isolated contour symbol black illustration. Constant temperature vectors Constant temperature control sensor line icon vector illustration. Constant temperature control sensor line icon vector. constant temperature control sensor sign. Constant temperature control sensor line icon vector. constant temperature control sensor sign. isolated contour symbol black illustration
Free with trial Medical laboratory platelet thermostatic storage Cabinet high quality Constant temperature platelet incubator diagram for experiment setup lab outline vector illustration. Constant temperature vectors Medical laboratory platelet thermostatic storage Cabinet high quality Constant temperature platelet incubator diagram. For experiment setup lab outline vector
Free with trial Ohm law infographic diagram physics dynamics mechanics education vector chart illustration scheme electrical current electric flow conductor point voltage resistance relationship temperature constant. Constant temperature vectors Ohm law infographic diagram physics. Dynamics mechanics education vector chart illustration scheme electrical current electric flow conductor point voltage. Ohm law infographic diagram physics dynamics mechanics education vector chart illustration scheme electrical current electric flow conductor point voltage resistance relationship temperature constant
Free with trial Boyle's Law, Relationship between pressure and volume of gas at constant temperature. Boyle's law diagram (relationship between pressure and volume. Constant temperature vectors Boyle\'s law showing that Pressure and volume inversely related in a gas. Boyle's Law, Relationship between pressure and volume of gas at constant temperature. Boyle's Law, Relationship between pressure and volume of gas at constant temperature. Boyle's law diagram (relationship between pressure and volume
Free with trial Sharks - cold-blooded, or ectothermic animals. This means that the temperature of the body of sharks is regulated by environmental conditions. Mammals are warm-blooded animals. Their temperature remains constant, despite fluctuations in environmental conditions. Warm-blooded animals, also commonly called endotherms, have an adaptation that helps them maintain a constant body temperature. Such adaptations include shaking and protective wool cover. Constant temperature vectors SEA AND SHADOW SHARK logo. Sharks - cold-blooded, or ectothermic animals. This means that the temperature of the body of sharks is regulated by environmental. Sharks - cold-blooded, or ectothermic animals. This means that the temperature of the body of sharks is regulated by environmental conditions. Mammals are warm-blooded animals. Their temperature remains constant, despite fluctuations in environmental conditions. Warm-blooded animals, also commonly called endotherms, have an adaptation that helps them maintain a constant body temperature. Such adaptations include shaking and protective wool cover.
Free with trial Constant Temperature Heating vector information sign. Available in high-resolution and good quality to fit the needs of your project. Constant temperature vectors Constant Temperature Heating vector information sign. Available in high-resolution and good quality to fit the needs of your project
Free with trial Constant volume, icon. Constant volume, illustration, vector on a white background. Constant temperature vectors Constant volume, icon. Constant volume, illustration, vector on a white background
Free with trial Constant rain icon green vector. Isolated on white background. Constant temperature vectors Constant rain icon green vector. Isolated on white background
Free with trial Constant rain pattern vector orange. For any web design best. Constant temperature vectors Constant rain pattern vector orange. For any web design best
Free with trial Constant rain icons set vector color. Constant rain icons set collection vector 6 color isolated on white background. Constant temperature vectors Constant rain icons set vector color. Constant rain icons set collection vector 6 color isolated on white background
Free with trial Constant rain icons vector hexahedron. Constant rain icons vector colorful hexahedron set collection isolated on white. Constant temperature vectors Constant rain icons vector hexahedron. Constant rain icons vector colorful hexahedron set collection isolated on white
Free with trial Constant rain pattern vector seamless blue. Repeat for any use. Constant temperature vectors Constant rain pattern vector seamless blue. Repeat for any use
Free with trial Set of line icons in vector for lamp packaging, technical specifications illustration, correlated color temperature, cct and service life, power and not compatible with light dimmers. Editable stroke. Constant temperature vectors Set of line icons in vector for lamp packaging, technical specifications illustration, correlated color temperature, cct. And service life, power and not. Set of line icons in vector for lamp packaging, technical specifications illustration, correlated color temperature, cct and service life, power and not compatible with light dimmers. Editable stroke
Free with trial Third law of thermodynamics. Entropy at absolute zero. The entropy of a closed system at thermodynamic equilibrium approaches a constant value when its temperature approaches absolute zero. Vector illustration. Constant temperature vectors Third law of thermodynamics. Entropy at absolute zero. The entropy of a closed system at thermodynamic equilibrium approaches a constant value when its
Free with trial Planck's law (also Planck radiation law? ) describes the spectral density of electromagnetic radiation emitted by a black body in thermal equilibrium at a given temperature T, when there is no net flow of matter or energy between the body and its environment. Constant temperature vectors Planck\'s Law physics educational vector illustration. Planck's law (also Planck radiation law?) describes the spectral density of electromagnetic radiation. Planck's law (also Planck radiation law?) describes the spectral density of electromagnetic radiation emitted by a black body in thermal equilibrium at a given temperature T, when there is no net flow of matter or energy between the body and its environment
Free with trial In physical chemistry, the Arrhenius equation is a formula for the temperature dependence of reaction rates. Constant temperature vectors Arrhenius equation physical chemistry science vector infographic. In physical chemistry, the Arrhenius equation is a formula for the temperature dependence of. In physical chemistry, the Arrhenius equation is a formula for the temperature dependence of reaction rates
Free with trial Line icon set in vector for lamp packaging, illustration of technical specifications, soft dimming and flexible, smart control and constant led flux, turn off delay and timer. Editable stroke. Constant temperature vectors Line icon set in vector for lamp packaging, illustration of technical specifications, soft dimming and flexible, smart. Control and constant led flux, turn off. Line icon set in vector for lamp packaging, illustration of technical specifications, soft dimming and flexible, smart control and constant led flux, turn off delay and timer. Editable stroke
Free with trial Weather icons set, outline style. Weather icons set. Outline illustration of 25 weather vector icons for web. Constant temperature vectors Weather icons set, outline style. Weather icons set. Outline illustration of 25 weather vector icons for web
Free with trial Weather icons set, flat style. Weather icons set. Flat illustration of 25 weather vector icons isolated on white background. Constant temperature vectors Weather icons set, flat style. Weather icons set. Flat illustration of 25 weather vector icons isolated on white background
Free with trial Weather icons set, flat style. Weather icons set. Flat illustration of 25 weather vector icons for web. Constant temperature vectors Weather icons set, flat style. Weather icons set. Flat illustration of 25 weather vector icons for web
Free with trial Home gas water heater providing hot water for shower. Illustration of a home gas water heater, ensuring a constant supply of hot water for daily needs. Constant temperature vectors Home gas water heater providing hot water for shower. Illustration of a home gas water heater, ensuring a constant supply of hot water for daily needs
Free with trial High particle graph flat outline. A high particle graph displays elevated levels of particle concentration over time, indicating increased air pollution. Constant temperature vectors High particle graph flat color. High particle graph flat outline. A high particle graph displays elevated levels of particle concentration over time, indicating. High particle graph flat outline. A high particle graph displays elevated levels of particle concentration over time, indicating increased air pollution
Free with trial A high particle graph displays elevated levels of particle concentration over time, indicating increased air pollution or specific events that contribute to particle emissions. Constant temperature vectors High particle graph flat outline. A high particle graph displays elevated levels of particle concentration over time, indicating increased air pollution or. A high particle graph displays elevated levels of particle concentration over time, indicating increased air pollution or specific events that contribute to particle emissions.
Free with trial Weater icons set sapphirine square vector. Weater icons set vector sapphirine square isolated on white background. Constant temperature vectors Weater icons set sapphirine square vector. Weater icons set vector sapphirine square isolated on white background
Free with trial Modern water heater providing hot water for home needs. Modern electric water heater is supplying a constant flow of hot water for all household purposes. Constant temperature vectors Modern water heater providing hot water for home needs. Modern electric water heater is supplying a constant flow of hot water for all household purposes
Free with trial Isotherme property vector information sign. Available in high-resolution and good quality to fit the needs of your project. Constant temperature vectors Isotherme property vector information sign. Available in high-resolution and good quality to fit the needs of your project
Free with trial Sun part of the earth icon in line design green. Sun, part, earth, solar, system, light, energy, radiance, sunshine isolated on white background vector. Sun part of the earth editable stroke icon. Constant temperature vectors Sun part of the earth icon in line design green. Sun, part, earth, solar, system, light, energy, radiance, sunshine. Isolated on white background vector. Sun. Sun part of the earth icon in line design green. Sun, part, earth, solar, system, light, energy, radiance, sunshine isolated on white background vector. Sun part of the earth editable stroke icon
Free with trial Sun part of the earth icon in line design green. Sun, part, earth, solar, system, light, energy, radiance, sunshine isolated on white background vector. Sun part of the earth editable stroke icon. Constant temperature vectors Sun part of the earth icon in line design green. Sun, part, earth, solar, system, light, energy, radiance, sunshine. Isolated on white background vector. Sun. Sun part of the earth icon in line design green. Sun, part, earth, solar, system, light, energy, radiance, sunshine isolated on white background vector. Sun part of the earth editable stroke icon
Free with trial Weater icons set, cartoon style. Weater icons set. Cartoon illustration of 16 weater vector icons for web. Constant temperature vectors Weater icons set, cartoon style. Weater icons set. Cartoon illustration of 16 weater vector icons for web
Free with trial Weater icons set, cartoon style. Weater icons set. Cartoon illustration of 16 weater vector icons for web. Constant temperature vectors Weater icons set, cartoon style. Weater icons set. Cartoon illustration of 16 weater vector icons for web
Free with trial Weater icons set pink square vector. Weater icons set vector pink square isolated on white background. Constant temperature vectors Weater icons set pink square vector. Weater icons set vector pink square isolated on white background
Free with trial Weater icons set, flat style. Weater icons set. Flat illustration of 25 weater vector icons for web. Constant temperature vectors Weater icons set, flat style. Weater icons set. Flat illustration of 25 weater vector icons for web
Free with trial Weater icons set grey vector. Weater icons set vector white isolated on grey background. Constant temperature vectors Weater icons set grey vector. Weater icons set vector white isolated on grey background
Free with trial Weater icons set grey vector. Weater icons set vector white isolated on grey background. Constant temperature vectors Weater icons set grey vector. Weater icons set vector white isolated on grey background
Free with trial Weater icons set red vector. Weater icons set vector red circle isolated on white background. Constant temperature vectors Weater icons set red vector. Weater icons set vector red circle isolated on white background
Free with trial Weater icons set grunge vector. Weater icons set vector grunge isolated on white background. Constant temperature vectors Weater icons set grunge vector. Weater icons set vector grunge isolated on white background
Free with trial Weater icons set grunge vector. Weater icons set vector grunge isolated on white background. Constant temperature vectors Weater icons set grunge vector. Weater icons set vector grunge isolated on white background
Free with trial Weater icons set red square vector. Weater icons set vector red square isolated on white background. Constant temperature vectors Weater icons set red square vector. Weater icons set vector red square isolated on white background
Free with trial Weater icons set red square vector. Weater icons set vector red square isolated on white background. Constant temperature vectors Weater icons set red square vector. Weater icons set vector red square isolated on white background
Free with trial Weather icons set vector neon. Weather icons set. Outline illustration of 25 weather vector icons neon color on black. Constant temperature vectors Weather icons set vector neon. Weather icons set. Outline illustration of 25 weather vector icons neon color on black
Free with trial Weater icons set blue square vector. Weater icons set vector blue square isolated on white background. Constant temperature vectors Weater icons set blue square vector. Weater icons set vector blue square isolated on white background
Free with trial Weater icons set pink square vector. Weater icons set vector pink square isolated on white background. Constant temperature vectors Weater icons set pink square vector. Weater icons set vector pink square isolated on white background
Free with trial Weater icons set blue square vector. Weater icons set vector blue square isolated on white background. Constant temperature vectors Weater icons set blue square vector. Weater icons set vector blue square isolated on white background
Free with trial Weater icons set green square vector. Weater icons set vector green square isolated on white background. Constant temperature vectors Weater icons set green square vector. Weater icons set vector green square isolated on white background
Free with trial Weater icons set green square vector. Weater icons set vector green square isolated on white background. Constant temperature vectors Weater icons set green square vector. Weater icons set vector green square isolated on white background
Free with trial Weater icons set purple square vector. Weater icons set vector purple square isolated on white background. Constant temperature vectors Weater icons set purple square vector. Weater icons set vector purple square isolated on white background
Free with trial Weater icons set purple square vector. Weater icons set vector purple square isolated on white background. Constant temperature vectors Weater icons set purple square vector. Weater icons set vector purple square isolated on white background
Free with trial Weater icons set orange square vector. Weater icons set vector orange square isolated on white background. Constant temperature vectors Weater icons set orange square vector. Weater icons set vector orange square isolated on white background
 Sign in