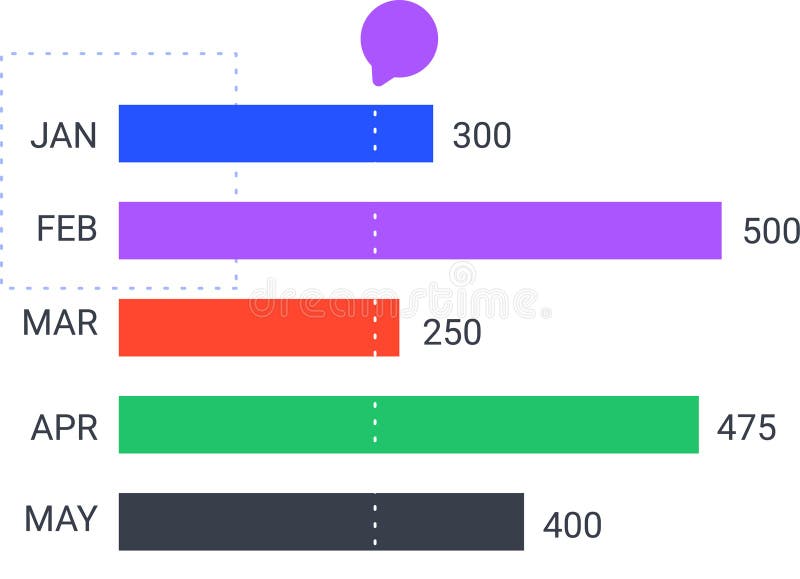
Free with trial Colorful horizontal bar chart is displaying monthly statistics from january to may, indicating trends and performance. With a speech bubble above. Decrease vectors Colorful horizontal bar chart is displaying monthly statistics from january to may, indicating trends and performance. With a speech bubble above
Free with trial Digital Thermometer Display with Temperature and Control Buttons Icon. Decrease vectors A simple, clean black and white icon representing a digital thermometer displaying 72 degrees Fahrenheit with plus and minus. Digital Thermometer Display with. Digital Thermometer Display with Temperature and Control Buttons Icon
Free with trial Hand drawn arrow black mark set. Isolated Hand-drawn arrows icons on white background. Different pointer collection. Simple drawing arrow pen. Vector illustration. Decrease vectors Colection of black hand drawn arrow signs. Vector illustration. Hand drawn arrow black mark set. Isolated Hand-drawn arrows icons on white background. Different. Hand drawn arrow black mark set. Isolated Hand-drawn arrows icons on white background. Different pointer collection. Simple drawing arrow pen. Vector illustration.
Free with trial This image depicts an abstract, symmetrical tunnel composed of multiple red arches. The arches gradually decrease in size, creating a sense of depth and perspective. The gradient shading adds dimension, enhancing the three-dimensional effect of the tunnel. The overall composition is minimalistic yet striking, with a focus on geometric shapes and color. Decrease vectors Abstract red arched tunnel. This image depicts an abstract, symmetrical tunnel composed of multiple red arches. The arches gradually decrease in size, creating a. This image depicts an abstract, symmetrical tunnel composed of multiple red arches. The arches gradually decrease in size, creating a sense of depth and perspective. The gradient shading adds dimension, enhancing the three-dimensional effect of the tunnel. The overall composition is minimalistic yet striking, with a focus on geometric shapes and color
Free with trial Solid Black Rounded Arrow Pointing Downward Directional Symbol. Decrease vectors A clean, solid black icon representing a rounded arrow pointing directly downwards, indicating direction or a downward trend. Solid Black Rounded Arrow Pointing. Solid Black Rounded Arrow Pointing Downward Directional Symbol
Free with trial Candlestick chart depicting financial data against a white background. Includes vertical bars in green and red, each representing an open, close, high, and low price within a specific time period. Green bars indicate an increase in price, while red bars show a decrease. Each bar is connected with thin lines, indicating price range fluctuations. Commonly used in stock trading and financial analysis to visualize market trends and patterns over time. Decrease vectors Green and red Japanese candlesticks showing upward trend on white stock chart. Candlestick chart depicting financial data against a white background. Includes. Candlestick chart depicting financial data against a white background. Includes vertical bars in green and red, each representing an open, close, high, and low price within a specific time period. Green bars indicate an increase in price, while red bars show a decrease. Each bar is connected with thin lines, indicating price range fluctuations. Commonly used in stock trading and financial analysis to visualize market trends and patterns over time.
Free with trial Energy consumption, renewable energy, power usage, electricity savings, sustainability, eco-friendly concepts. Electric plug with lightning bolt, arrow pointing down and cloud. Energy consumption. Decrease vectors Energy Efficiency and Consumption Symbol with Electric Plug, Lightning Bolt, and Downward Arrow. Energy consumption, renewable energy, power usage, electricity. Energy consumption, renewable energy, power usage, electricity savings, sustainability, eco-friendly concepts. Electric plug with lightning bolt, arrow pointing down and cloud. Energy consumption
Free with trial Two pink spiral diagrams are depicted against a white background. Each spiral is vertically oriented with a rod through its center, terminating in a downward-pointing arrow. The spirals have a gradient ranging from light pink at the top to darker pink at the bottom, visually illustrating a direction of movement or flow. The image lacks additional text or context. Decrease vectors Downward Spiral Ribbon Arrow Set in Pink – 3D Tape Helix Business Infographic Illustration. Two pink spiral diagrams are depicted against a white background. Two pink spiral diagrams are depicted against a white background. Each spiral is vertically oriented with a rod through its center, terminating in a downward-pointing arrow. The spirals have a gradient ranging from light pink at the top to darker pink at the bottom, visually illustrating a direction of movement or flow. The image lacks additional text or context.
Free with trial A black and white illustration features a thermometer, a warning triangle with an exclamation mark, a percentage symbol, and a downward trending arrow. Decrease vectors Warning Sign with Thermometer, Percentage Symbol, and Downward Arrow danger alert. A black and white illustration features a thermometer, a warning triangle with. A black and white illustration features a thermometer, a warning triangle with an exclamation mark, a percentage symbol, and a downward trending arrow
Free with trial Man user avatar and minus. Remove or delete profile or account. Pixel perfect, editable stroke vector icon. Decrease vectors Man user avatar and minus. Remove or delete profile or account. Pixel perfect, editable vector icon. Man user avatar and minus. Remove or delete profile or. Man user avatar and minus. Remove or delete profile or account. Pixel perfect, editable stroke vector icon
Free with trial Yellow Circle Minus Sign Symbol Icon Simple Minimalist Modern Flat Design Concept. AI generated. Decrease vectors Yellow Circle Minus Sign Symbol Icon Simple Minimalist Modern Flat Design Concept. AI generated
Free with trial A visual creation that highlights a balanced composition with interesting details and style, presenting a harmonious and aesthetic blend of elements, suitable for various creative purposes. Decrease vectors Colorful vector icons depicting growth, flow, and transition. A visual creation that highlights a balanced composition with interesting details and style. A visual creation that highlights a balanced composition with interesting details and style, presenting a harmonious and aesthetic blend of elements, suitable for various creative purposes.
Free with trial A black outline icon featuring a rectangular frame with a horizontal line in the center, symbolizing a minimize function, a minus button, or a subtraction operation. This minimalist vector graphic is isolated on a clean white background, making it versatile for web design, app interfaces, software development, and educational materials. Represents reduction, removal, or collapsing elements. Generated by AI. Decrease vectors Minimize Window Outline Icon. A black outline icon featuring a rectangular frame with a horizontal line in the center, symbolizing a minimize function, a minus. A black outline icon featuring a rectangular frame with a horizontal line in the center, symbolizing a minimize function, a minus button, or a subtraction operation. This minimalist vector graphic is isolated on a clean white background, making it versatile for web design, app interfaces, software development, and educational materials. Represents reduction, removal, or collapsing elements. Generated by AI
Free with trial Illustration depicting a financial downturn with a gold coin, dollar signs, and red arrows on a black background using a flat style. Decrease vectors Financial Decline Concept Depicted by Red Arrows and Gold Coin with Dollar Sign. Illustration depicting a financial downturn with a gold coin, dollar signs, and. Illustration depicting a financial downturn with a gold coin, dollar signs, and red arrows on a black background using a flat style.
Free with trial Abstract Black Bar Chart with Data Points and Trend Line Icon. Decrease vectors A minimalist black and white icon representing a bar chart with data points and a connected line indicating a trend, suitable for. Abstract Black Bar Chart with. Abstract Black Bar Chart with Data Points and Trend Line Icon
Free with trial Simple Circular Minus Sign Icon Symbol Shape in Black and White. Decrease vectors A clean and simple icon representing a minus sign within a circular outline. This graphic is presented in a solid black and white. Simple Circular Minus Sign. Simple Circular Minus Sign Icon Symbol Shape in Black and White
Free with trial Production Down Icon. Sing symbol. Decrease vectors Production Down Icon. Sing symbol
Free with trial Production Down Icon. Sing symbol. Decrease vectors Production Down Icon. Sing symbol
Free with trial Young girl and minus. Remove user, delete avatar. Reduce profile access. Pixel perfect, editable stroke vector icon. Decrease vectors Young girl and minus. Remove user, delete avatar. Reduce profile access. Pixel perfect vector icon. Young girl and minus. Remove user, delete avatar. Reduce. Young girl and minus. Remove user, delete avatar. Reduce profile access. Pixel perfect, editable stroke vector icon
Free with trial Stylized Downward Trend Graph with Percentage Symbol and Arrow. Decrease vectors A simplified graphic representing a financial or economic downturn, indicated by a downward trending line graph accompanied by a. Stylized Downward Trend Graph. Stylized Downward Trend Graph with Percentage Symbol and Arrow
Free with trial Shield with exclamation mark and minus. Delete alert, warning removed. Pixel perfect, editable stroke vector icon. Decrease vectors Shield with exclamation mark and minus. Delete alert, warning removed. Pixel perfect, editable vector icon. Shield with exclamation mark and minus. Delete alert. Shield with exclamation mark and minus. Delete alert, warning removed. Pixel perfect, editable stroke vector icon
Free with trial Business growth chart with red arrow and colorful bars for financial success presentation asset design layout style, corporate progress analytics visual structure graphic. Decrease vectors Business Growth Chart Vector With Red Arrow And Colorful Bars For Financial Success Presentation Asset Design Layout Style. Business growth chart with red arrow. Business growth chart with red arrow and colorful bars for financial success presentation asset design layout style, corporate progress analytics visual structure graphic
Free with trial A black and white of a minus sign or negative symbol inside a circle, isolated on a white background. Decrease vectors Black and white of a minus sign or negative symbol inside a circle on a white background. A black and white of a minus sign or negative symbol inside a circle. A black and white of a minus sign or negative symbol inside a circle, isolated on a white background
Free with trial A simple blue line graph with circular data points is displayed against a clean white background with subtle horizontal grid lines. The graph shows fluctuations and trends, making it suitable for representing data, analytics, or financial performance. Generated by AI. Decrease vectors Blue Line Graph with Data Points on White Background. A simple blue line graph with circular data points is displayed against a clean white background with. A simple blue line graph with circular data points is displayed against a clean white background with subtle horizontal grid lines. The graph shows fluctuations and trends, making it suitable for representing data, analytics, or financial performance. Generated by AI
Free with trial Outline Broken Money Bag With Falling Coins And Cash Financial Icon. Decrease vectors A minimalist linear icon illustration depicting a broken bag losing money with falling coins and banknote and a downward arrow. Outline Broken Money Bag With. Outline Broken Money Bag With Falling Coins And Cash Financial Icon
Free with trial Minimalist Linear Fire Lightning Bolt Negative Symbol Interface Icon. Decrease vectors A minimalist linear icon representing a flame with a central lightning bolt and a negative sign inside a small circle, suitable. Minimalist Linear Fire Lightning. Minimalist Linear Fire Lightning Bolt Negative Symbol Interface Icon
Free with trial Cancel video chat, remove members from conference. Pixel perfect, editable stroke vector icon. Decrease vectors Cancel video chat, remove members from conference. Pixel perfect, editable vector icon. Cancel video chat, remove members from conference. Pixel perfect. Cancel video chat, remove members from conference. Pixel perfect, editable stroke vector icon
Free with trial Black rectangle halftone pattern on white, Geometric bar size gradient, Centered black block repeat. Vector Illustration editable. Decrease vectors Black rectangle halftone pattern on white, Geometric bar size gradient, Centered black block repeat. Vector Illustration editable
Free with trial Two colorful lines are representing data points over time, creating a visual representation of trends and fluctuations, with a highlighted period marked in red. Decrease vectors Two colorful lines are representing data points over time, creating a visual representation of trends and fluctuations. With a highlighted period marked in red
Free with trial Two businessmen and brokers looking at falling market chart or stock quotes. Financial crisis or depression. Money analysis infographic. Frightened people looking at failure diagram. Vector concept. Decrease vectors Two businessmen and brokers looking at falling market chart or stock quotes. Financial depression. analysis infographic. Two businessmen and brokers looking at. Two businessmen and brokers looking at falling market chart or stock quotes. Financial crisis or depression. Money analysis infographic. Frightened people looking at failure diagram. Vector concept
Free with trial Layered Funnel Chart with Segments in Different Blue Shades. AI generated. Decrease vectors Layered Funnel Chart with Segments in Different Blue Shades. AI generated
Free with trial Reduce costs concept, business and company to keep cost low, cut spending or expense deduction in budget plan, businessman breaking the graph cost. Decrease vectors Reduce costs concept. Business and company to keep cost low, cut spending or expense deduction in budget plan, businessman breaking the graph cost
Free with trial 3D Orange Percentage Symbol with Subtle Gradient and Shadow. AI generated. Decrease vectors 3D Orange Percentage Symbol with Subtle Gradient and Shadow. AI generated
Free with trial A three-dimensional green arrow with a jagged zigzag shape pointing downwards against a white backdrop. Decrease vectors Green 3D zigzag arrow pointing down, declining trend symbol, falling growth icon. A three-dimensional green arrow with a jagged zigzag shape pointing downwards. A three-dimensional green arrow with a jagged zigzag shape pointing downwards against a white backdrop
Free with trial Rising coin wealth solid icons. A collection of solid icons depicting coin stacks and growth charts, presented isolated on a clean white background. Decrease vectors Rising coin wealth solid icons. A collection of solid icons depicting coin stacks and growth charts, presented isolated on a clean white background
Free with trial Simple Outline Magnifying Glass with Minus Symbol Icon. Decrease vectors A clean, black and white outline icon depicting a magnifying glass with a minus symbol inside the lens, representing zoom out. Simple Outline Magnifying Glass. Simple Outline Magnifying Glass with Minus Symbol Icon
Free with trial Thermometer frost vector illustration. Vector illustration thermometer with frosts in the concept of cold weather and winter. Decrease vectors Thermometer frost vector illustration. Vector illustration thermometer with frosts in the concept of cold weather and winter
Free with trial Indian man and minus. Remove user, delete avatar. Reduce profile access. Pixel perfect, editable stroke vector icon. Decrease vectors Indian man and minus. Remove user, delete avatar. Reduce profile access. Pixel perfect vector icon. Indian man and minus. Remove user, delete avatar. Reduce. Indian man and minus. Remove user, delete avatar. Reduce profile access. Pixel perfect, editable stroke vector icon
Free with trial A collection of five distinct black and white graphic representations of data. From left to right, the first is a line graph with dots, showing fluctuations. The second is a zig-zag line graph with dots and an upward arrow. The third is a series of ascending vertical bars. The fourth is a bar chart with a single dot above one of the bars. The fifth is a pie chart divided into four sections, with. Decrease vectors Collection of black and white business and data charts and graphs statistics analytics. A collection of five distinct black and white graphic representations of. A collection of five distinct black and white graphic representations of data. From left to right, the first is a line graph with dots, showing fluctuations. The second is a zig-zag line graph with dots and an upward arrow. The third is a series of ascending vertical bars. The fourth is a bar chart with a single dot above one of the bars. The fifth is a pie chart divided into four sections, with
Free with trial Subtract Symbol in Circular Shape with Shadow Effect in Gray and White Design Element. AI generated. Decrease vectors Subtract Symbol in Circular Shape with Shadow Effect in Gray and White Design Element. AI generated
Free with trial Temperature Down Icon - Cold Earth Icon. Sing symbol. Decrease vectors Temperature Down Icon - Cold Earth Icon. Sing symbol
Free with trial Sustainability, carbon reduction, eco-friendly innovation, environmental monitoring, climate change, renewable practices. Blue location pin, CO2 footprint arrow cloud. Sustainability and carbon. Decrease vectors Carbon Footprint Reduction and Environmental Awareness with Location Tracking Concept Icons. Sustainability, carbon reduction, eco-friendly innovation. Sustainability, carbon reduction, eco-friendly innovation, environmental monitoring, climate change, renewable practices. Blue location pin, CO2 footprint arrow cloud. Sustainability and carbon
Free with trial Black and white halftone gradient image creating a circular, fading effect from dark in the center to light at the edges. The pattern consists of numerous small black dots that gradually decrease in size and density outward, producing an optical illusion of depth and shading. This technique is commonly used in graphic design and printing to create smooth transitions and textures using a limited color palette. Decrease vectors Black and white halftone gradient image creating a circular, fading effect from dark in the center to light at the edges. The pattern consists of numerous
Free with trial Solid Black Pie Chart Diagram Representation Icon. Decrease vectors A simple, solid black icon representing a pie chart or graph, divided into three distinct segments to visualize proportions or. Solid Black Pie Chart Diagram. Solid Black Pie Chart Diagram Representation Icon
Free with trial Black Simple Bar Chart Graphic Element with Rounded Tops Indicating Growth Trend. Decrease vectors A simple black graphic element depicting a bar chart with rounded tops. This visual represents data progression and growth,. Black Simple Bar Chart Graphic. Black Simple Bar Chart Graphic Element with Rounded Tops Indicating Growth Trend
Free with trial Stylized Black Globe With Downward Trend Graph Icon. Decrease vectors A simplified black graphic symbol depicting a globe alongside a descending bar chart and an arrow indicating a downward trend. Stylized Black Globe With Downward. Stylized Black Globe With Downward Trend Graph Icon
Free with trial Bio energy co2 neutral symbol design. Vector. Decrease vectors Bio energy co2 neutral symbol design. Vector
Free with trial This 3D render visually represents a financial crisis or economic recession. Four stacks of gold coins, decreasing in height from left to right, are depicted. A prominent red arrow, symbolizing a downward trend, points towards the smallest coin stack, emphasizing a significant decline. The clean, minimalist background with a reflective surface enhances the focus on the financial concept. This image is ideal for illustrating concepts like market crash, investment loss, bankruptcy, or economic instability. Decrease vectors Financial Downturn: Declining Coin Stacks and Red Arrow. This 3D render visually represents a financial crisis or economic recession. Four stacks of gold coins. This 3D render visually represents a financial crisis or economic recession. Four stacks of gold coins, decreasing in height from left to right, are depicted. A prominent red arrow, symbolizing a downward trend, points towards the smallest coin stack, emphasizing a significant decline. The clean, minimalist background with a reflective surface enhances the focus on the financial concept. This image is ideal for illustrating concepts like market crash, investment loss, bankruptcy, or economic instability.
Free with trial Downward graph with red markers, sad face icon, alert envelope, and mobile payment issues. Ideal for finance, declining trends, user frustration, bad news failure loss warning signal. Simple flat. Decrease vectors Declining Graph with Sad Face, Notification Alert, and Mobile Payment Issues. Downward graph with red markers, sad face icon, alert envelope, and mobile payment. Downward graph with red markers, sad face icon, alert envelope, and mobile payment issues. Ideal for finance, declining trends, user frustration, bad news failure loss warning signal. Simple flat
Free with trial Solid Black Glyph Banknote Money Bill with Arrow Down Cash Withdrawal Icon Sign. Decrease vectors A solid black glyph icon depicting a paper banknote with a downward arrow representing cash withdrawal, financial payment, or. Solid Black Glyph Banknote Money. Solid Black Glyph Banknote Money Bill with Arrow Down Cash Withdrawal Icon Sign
Free with trial Minimalist Silhouette Carbon Dioxide Cloud Down Arrow Emission Reduction Symbol Icon. Decrease vectors Minimal black icon showing a cloud with CO2 text and a down arrow, representing carbon emission reduction and environmental. Minimalist Silhouette Carbon Dioxide. Minimalist Silhouette Carbon Dioxide Cloud Down Arrow Emission Reduction Symbol Icon
Free with trial Wallet card and minus sign. Remove payment method. Pixel perfect, editable stroke vector icon. Decrease vectors Wallet card and minus sign. Remove payment method. Pixel perfect, editable vector icon. Wallet card and minus sign. Remove payment method. Pixel perfect. Wallet card and minus sign. Remove payment method. Pixel perfect, editable stroke vector icon
Free with trial Outline Document Sheet with Dollar Sign and Down Arrow Financial Cost Reduction Icon. Decrease vectors A black outline icon representing a financial document or bill showing a cost reduction with a dollar sign and downward arrow. Outline Document Sheet with Dollar. Outline Document Sheet with Dollar Sign and Down Arrow Financial Cost Reduction Icon
Free with trial A clean and modern vector illustration of a line graph, isolated on a white background. This flat design icon features two distinct lines, one blue and one brown, plotting various data points to show trends and comparisons over time. It's a versatile graphic representing concepts like data analysis, business analytics, financial statistics, market research, and performance tracking. Ideal for use in presentations, infographics, websites, business reports, and marketing materials to visualize progress, growth, or economic fluctuations. Decrease vectors Data Analysis Line Graph Icon. A clean and modern vector illustration of a line graph, isolated on a white background. This flat design icon features two. A clean and modern vector illustration of a line graph, isolated on a white background. This flat design icon features two distinct lines, one blue and one brown, plotting various data points to show trends and comparisons over time. It's a versatile graphic representing concepts like data analysis, business analytics, financial statistics, market research, and performance tracking. Ideal for use in presentations, infographics, websites, business reports, and marketing materials to visualize progress, growth, or economic fluctuations.
Free with trial A minimalist black geometric design featuring segmented rectangles stacked vertically to create a tapering effect against a plain white background. Decrease vectors Hand-drawn minimalist black geometric stack of rectangles forming a vertical tapering progression on white illustration. A minimalist black geometric design. A minimalist black geometric design featuring segmented rectangles stacked vertically to create a tapering effect against a plain white background
Free with trial Weight loss icon isolated on background vector illustration. Non AI generate. Decrease vectors Weight loss icon isolated on background vector illustration. Non AI generate
Free with trial A red 3D percentage symbol is positioned next to a white 3D arrow pointing downwards. Isolated on a transparent background. Decrease vectors Red percentage symbol with white down arrow isolated on a transparent background. A red 3D percentage symbol is positioned next to a white 3D arrow pointing. A red 3D percentage symbol is positioned next to a white 3D arrow pointing downwards. Isolated on a transparent background
Free with trial The image features a dollar sign symbol in the center, with a red downward arrow pointing to the left and a green upward arrow pointing to the right, symbolizing a decline and rise in financial values or trends. The design is minimalistic and uses contrasting colors to emphasize the opposing directions. Decrease vectors Dollar sign symbol with upward and downward arrows indicating financial trends. The image features a dollar sign symbol in the center, with a red downward arrow. The image features a dollar sign symbol in the center, with a red downward arrow pointing to the left and a green upward arrow pointing to the right, symbolizing a decline and rise in financial values or trends. The design is minimalistic and uses contrasting colors to emphasize the opposing directions
Free with trial A minimalist set of hand-drawn icons featuring a dynamic arrow indicating movement or progress and a line graph displaying data trends, perfect for illustrating concepts of growth, analysis, and chang. Decrease vectors Arrow and graph icons set isolated on transparent background. A minimalist set of hand-drawn icons featuring a dynamic arrow indicating movement or progress and. A minimalist set of hand-drawn icons featuring a dynamic arrow indicating movement or progress and a line graph displaying data trends, perfect for illustrating concepts of growth, analysis, and chang
Free with trial Illustration of a dollar symbol surrounded by arrows showing financial movement, investment, and economic flow. Decrease vectors Financial Flow: Dollar Symbol with Arrows Indicating Money Movement and Investment. Illustration of a dollar symbol surrounded by arrows showing financial. Illustration of a dollar symbol surrounded by arrows showing financial movement, investment, and economic flow.
Free with trial Isometric illustration of a house with a downward arrow, symbolizing declining real estate values in a flat design style,isolated on black background. Decrease vectors Isometric House with Downward Arrow Representing Falling Real Estate Market Value. Isometric illustration of a house with a downward arrow, symbolizing declining. Isometric illustration of a house with a downward arrow, symbolizing declining real estate values in a flat design style,isolated on black background
Free with trial Broken Plus Sign Icon Concept. A graphic illustration of a broken plus sign within a circle, symbolizing concepts like failure, division, or loss. Decrease vectors Broken Plus Sign Icon Concept. A graphic illustration of a broken plus sign within a circle, symbolizing concepts like failure, division, or loss
Free with trial Monochrome geometric background pattern featuring black incomplete circles that decrease in size across a white background. Decrease vectors Black and white incomplete circle halftone background, Abstract geometric round shape size transition, Monochrome fading circle. Monochrome geometric background. Monochrome geometric background pattern featuring black incomplete circles that decrease in size across a white background
Free with trial T shirt with size expansion icon in isometric digital style, symbolizing adaptable, customizable apparel dimensions for fashion, retail, e commerce and uiux applications. Decrease vectors Clothing size expansion digital isometric diagram icon. T shirt with size expansion icon in isometric digital style, symbolizing adaptable, customizable apparel. T shirt with size expansion icon in isometric digital style, symbolizing adaptable, customizable apparel dimensions for fashion, retail, e commerce and uiux applications
Free with trial Piggy bank financial crisis recession concept declining graph falling coins dark background mobile app screen template. Vector illustration. Decrease vectors Piggy bank financial crisis recession concept declining graph falling coins dark background mobile app screen template. Vector illustration
Free with trial Simple pictogram depicting a person downloading a file modern user interface design. Decrease vectors Person Downloading File, Digital Icon. Simple pictogram depicting a person downloading a file modern user interface design. Simple pictogram depicting a person downloading a file modern user interface design.
Free with trial Carbon dioxide, greenhouse gas neutral pollution icon or emblem. Greenhouse gas emission label, carbon dioxide footprint ecology vector sticker. CO2 neutral icon with green leaf and typography. Decrease vectors Carbon dioxide, greenhouse gas neutral icon. Carbon dioxide, greenhouse gas neutral pollution icon or emblem. Greenhouse gas emission label, carbon dioxide. Carbon dioxide, greenhouse gas neutral pollution icon or emblem. Greenhouse gas emission label, carbon dioxide footprint ecology vector sticker. CO2 neutral icon with green leaf and typography
Free with trial Carbon dioxide, greenhouse gas neutral pollution icon. Dioxide emission sticker, greenhouse gas pollution ecology vector symbol. Carbon neutral footprint label with handwritten typography and leaf. Decrease vectors Carbon dioxide, greenhouse gas neutral icon. Carbon dioxide, greenhouse gas neutral pollution icon. Dioxide emission sticker, greenhouse gas pollution ecology. Carbon dioxide, greenhouse gas neutral pollution icon. Dioxide emission sticker, greenhouse gas pollution ecology vector symbol. Carbon neutral footprint label with handwritten typography and leaf
Free with trial Carbon dioxide, greenhouse gas neutral pollution icon or emblem. Greenhouse gas emission label, carbon dioxide footprint ecology vector sticker. CO2 neutral icon with green leaf and typography. Decrease vectors Carbon dioxide, greenhouse gas neutral icon. Carbon dioxide, greenhouse gas neutral pollution icon or emblem. Greenhouse gas emission label, carbon dioxide. Carbon dioxide, greenhouse gas neutral pollution icon or emblem. Greenhouse gas emission label, carbon dioxide footprint ecology vector sticker. CO2 neutral icon with green leaf and typography
Free with trial The image depicts a simple line graph that illustrates the fluctuation of data over a period of time. The x-axis represents the time, while the y-axis represents the variable being measured. The line graph shows several peaks and troughs, indicating variations in the data points. The graph starts at a low point, rises to a peak, dips to a trough, and then continues to fluctuate in this manner. The. Decrease vectors Graphical representation of fluctuating data over time. The image depicts a simple line graph that illustrates the fluctuation of data over a period of time. The. The image depicts a simple line graph that illustrates the fluctuation of data over a period of time. The x-axis represents the time, while the y-axis represents the variable being measured. The line graph shows several peaks and troughs, indicating variations in the data points. The graph starts at a low point, rises to a peak, dips to a trough, and then continues to fluctuate in this manner. The
Free with trial Abstract Black Bar Chart with Rounded Tops representing Data Visualization. Decrease vectors A simple, abstract graphic displaying a series of black bars of varying heights with rounded tops, arranged on a horizontal line,. Abstract Black Bar Chart with. Abstract Black Bar Chart with Rounded Tops representing Data Visualization
Free with trial Downward trend graph with bars and arrow, financial concept. AI generated. Decrease vectors Downward trend graph with bars and arrow, financial concept. AI generated
Free with trial Price tag icon featuring a percentage symbol, representing concepts like discount, sale, promotion, coupon, special offer, and retail commerce for shoppers. Decrease vectors Price tag icon symbolizing discount promotion and sale. Price tag icon featuring a percentage symbol, representing concepts like discount, sale, promotion. Price tag icon featuring a percentage symbol, representing concepts like discount, sale, promotion, coupon, special offer, and retail commerce for shoppers
Free with trial Bar chart with falling growth, sad face icon, and signed financial document. Ideal for business reports, financial loss, analytics, economy, decline, strategy simple flat metaphor. Decrease vectors Declining Business Performance Indicated by Bar Chart and Sad Face Symbol. Bar chart with falling growth, sad face icon, and signed financial document. Ideal for. Bar chart with falling growth, sad face icon, and signed financial document. Ideal for business reports, financial loss, analytics, economy, decline, strategy simple flat metaphor
Free with trial Bold red downward graph arrow 2D cartoon object. Trend market decline. Descending line chart. Business loss. Economic downturn isolated element flat vector clip art on white. Spot illustration. Decrease vectors Bold red downward graph arrow 2D cartoon object. Trend market decline. Descending line chart. Business loss. Economic downturn isolated element flat vector
Free with trial Simple Black Line Graph Icon with Wavy Trend Line and Axis. Decrease vectors A minimalist black icon representing a line graph with fluctuating data points and clearly defined axis lines, suitable for. Simple Black Line Graph Icon with. Simple Black Line Graph Icon with Wavy Trend Line and Axis
Free with trial Woman looking worried near bar chart with declining arrows, broken piggy bank, and shattered coin, on light abstract background. Concept of economic failure. Vector illustration. Decrease vectors Financial crisis with broken piggy bank. Vector illustration. Woman looking worried near bar chart with declining arrows, broken piggy bank, and shattered coin. Woman looking worried near bar chart with declining arrows, broken piggy bank, and shattered coin, on light abstract background. Concept of economic failure. Vector illustration
Free with trial Growth, profit, business vector icons. Black linear graphs, charts representing market trends, finance analytics. Perfect for. Economic forecasts, trend an. Decrease vectors Growth, profit, business vector icons. Black linear graphs, charts representing market trends, finance analytics. Perfect for. Economic forecasts, trend an
Free with trial Recession economic downturn falling graph coins declining bar chart arrow abstract geometric shapes modern finance banner. Vector illustration. Decrease vectors Recession economic downturn falling graph coins declining bar chart arrow abstract geometric shapes modern finance banner. Vector illustration
Free with trial The image depicts mitigation strategies for risk management and security. It features three icons representing different aspects of mitigation. The top left icon shows a shield over a grid, symbolizing protection and security measures. The top right icon depicts a person escaping from a striped box, indicating risk avoidance or escape. The bottom icon displays a downward trend line, representing a. Decrease vectors Mitigation strategies for risk management and security. The image depicts mitigation strategies for risk management and security. It features three icons. The image depicts mitigation strategies for risk management and security. It features three icons representing different aspects of mitigation. The top left icon shows a shield over a grid, symbolizing protection and security measures. The top right icon depicts a person escaping from a striped box, indicating risk avoidance or escape. The bottom icon displays a downward trend line, representing a
 Sign in