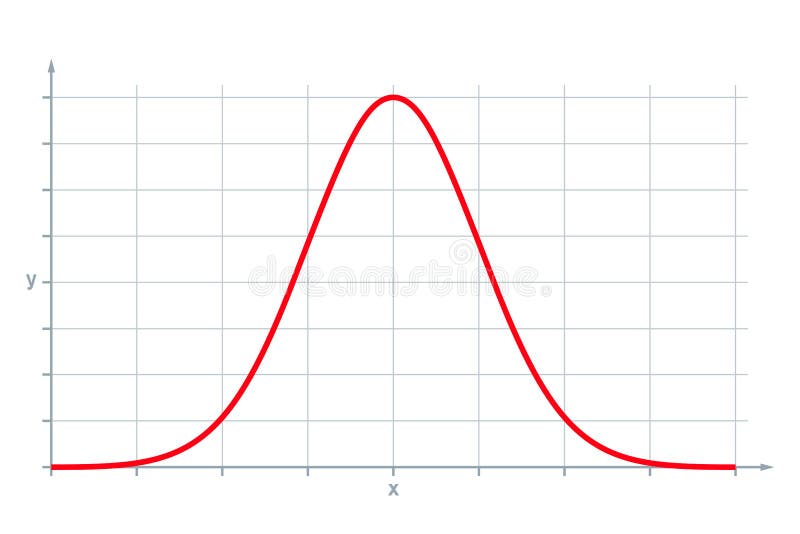
Free with trial Standard normal distribution, also Gaussian distribution or bell curve. Used in statistics and in natural and social sciences to represent real-valued random variables of unknown distributions. Vector. Distributions vectors Standard normal distribution, also Gaussian distribution or bell curve. Used in statistics and in natural and social sciences to represent real-valued random
Free with trial Tux is a penguin character and the official brand character of the Linux kernel. Originally created as an entry to a Linux logo competition, Tux is the most commonly used icon for Linux, although different Linux distributions depict Tux in various styles. Distributions vectors Tux ios android osx logo. Tux is a penguin character and the official brand character of the Linux kernel. Originally created as an entry to a Linux logo. Tux is a penguin character and the official brand character of the Linux kernel. Originally created as an entry to a Linux logo competition, Tux is the most commonly used icon for Linux, although different Linux distributions depict Tux in various styles.
Free with trial Beneficiary color icon. Person gains advantages from bank. Receive distributions from trust, will, or life insurance policy. Banking functions concept. Isolated vector illustration. Distributions vectors Beneficiary color icon. Person gains advantages from bank. Receive distributions from trust, will, or life insurance policy.Banking functions concept. Isolated
Free with trial A colorful infographic featuring a dynamic bubble chart, representing data points with varying sizes and positions. This versatile graphic is perfect for complex data visualization, scientific presentations, or educational materials. It effectively highlights relationships and distributions, ideal for engaging and insightful communication, vector design Generative AI. Distributions vectors Vibrant Bubble Chart Data Visualization, vector design Generative AI. A colorful infographic featuring a dynamic bubble chart, representing data points with. A colorful infographic featuring a dynamic bubble chart, representing data points with varying sizes and positions. This versatile graphic is perfect for complex data visualization, scientific presentations, or educational materials. It effectively highlights relationships and distributions, ideal for engaging and insightful communication, vector design Generative AI
Free with trial Tux is a penguin character and the official brand character of the Linux kernel. Originally created as an entry to a Linux logo competition, Tux is the most commonly used icon for Linux, although different Linux distributions depict Tux in various styles. Distributions vectors Tux ios android osx logo. Tux is a penguin character and the official brand character of the Linux kernel. Originally created as an entry to a Linux logo. Tux is a penguin character and the official brand character of the Linux kernel. Originally created as an entry to a Linux logo competition, Tux is the most commonly used icon for Linux, although different Linux distributions depict Tux in various styles.
Free with trial Illustration of Set of Fat Tailed and Long Tailed Distributions Chart Label on A Chalkboard Background. Distributions vectors Fat Tailed and Long Tailed Distributions on A Chalkboard Background. Illustration of Set of Fat Tailed and Long Tailed Distributions Chart Label on A Chalkboard. Illustration of Set of Fat Tailed and Long Tailed Distributions Chart Label on A Chalkboard Background.
Free with trial Grouse in the forest. Grouse in the deep forest. Distributions vectors Grouse in the forest. Grouse in the deep forest
Free with trial Import, export and distribution logo design. Delivery and logistics vector design. Globe and direction pointer logotype. Distributions vectors Import, export and distribution logo design. Delivery and logistics vector design. Globe and direction pointer logotype
Free with trial Law firm design. Vector illustration decorative background design. Conceptual vector. Distributions vectors Law firm design. Vector illustration decorative background design. Conceptual vector
Free with trial Set of law firm design icons. Vector illustration decorative background design. Conceptual vector. Distributions vectors Set of law firm design icons. Vector illustration decorative background design. Conceptual vector
Free with trial Law elements design. Vector illustration decorative design. Distributions vectors Law elements design. Vector illustration decorative design
Free with trial Law elements design. Vector illustration decorative design. Distributions vectors Law elements design. Vector illustration decorative design
Free with trial Set of law icons. Vector illustration decorative design. Distributions vectors Set of law icons. Vector illustration decorative design
Free with trial Packing item concept. Vector illustration decorative design. Distributions vectors Packing item concept. Vector illustration decorative design
Free with trial 3D isometric Warehouse Logistic concept with Workers loading products on belt conveyor, Transportation operation service, Logistics management. Vector illustration EPS 10. Distributions vectors 3D isometric Warehouse Logistic concept with Workers loading products on belt conveyor, Transportation operation service,. Logistics management. Vector
Free with trial Box and Whiskers Plot for Contrasting Distributions using percentile for data analysis. Vector. Distributions vectors Box and Whiskers Plot for Contrasting Distributions using percentile for data analysis. Vector
Free with trial This image was created using Generative AI. Statistic graph showing two overlapping normal distributions in red and blue colors. Distributions vectors Bell curve distribution graph with overlapping red and blue normal distributions. This image was created using Generative AI. Statistic graph showing two. This image was created using Generative AI. Statistic graph showing two overlapping normal distributions in red and blue colors
Free with trial A set of pie charts showing different data distributions, each with varying segment sizes and colors, representing different proportions and categories clearly. Distributions vectors Vector art of collection of colorful pie charts with different segment distributions isolated on white background. A set of pie charts showing different data. A set of pie charts showing different data distributions, each with varying segment sizes and colors, representing different proportions and categories clearly
Free with trial A woman balances scales showcasing uneven distributions of resources among diverse business professionals in a vibrant corporate landscape. Distributions vectors A woman balances scales showcasing uneven distributions of resources among diverse business professionals in a vibrant corporate. Landscape
Free with trial An illustration of a simplified document icon on a transparent background, featuring highlighted text lines at the top. A purple horizontal banner across the middle displays the word "DEB," representing the Debian package format used in Linux distributions. The paper has a triangular corner folded at the bottom-right. Distributions vectors Vector illustration of DEB document icon on transparent background symbolizing document format or type. An illustration of a simplified document icon on a. An illustration of a simplified document icon on a transparent background, featuring highlighted text lines at the top. A purple horizontal banner across the middle displays the word "DEB," representing the Debian package format used in Linux distributions. The paper has a triangular corner folded at the bottom-right.
Free with trial Four hand-drawn tree silhouettes on a white background. Top left: dense, rounded canopy top right: sparse, irregular foliage bottom left: wide, expansive crown resembling an Acacia or Vachellia tree bottom right: slender trunk with uneven branches. All illustrations emphasize the distinct shapes and leaf distributions of different tree species, providing a variety of forms typical to diverse environments. Distributions vectors Hand drawn tree silhouette on white background. Four hand-drawn tree silhouettes on a white background. Top left: dense, rounded canopy top right: sparse. Four hand-drawn tree silhouettes on a white background. Top left: dense, rounded canopy top right: sparse, irregular foliage bottom left: wide, expansive crown resembling an Acacia or Vachellia tree bottom right: slender trunk with uneven branches. All illustrations emphasize the distinct shapes and leaf distributions of different tree species, providing a variety of forms typical to diverse environments.
Free with trial Silhouettes of three distinct tree shapes are depicted against a white background. Each tree has a unique outline, with detailed branching and varying leaf distributions, capturing their individual forms. The central tree stands slightly taller, while the others exhibit different canopy widths and densities. These artistic renditions emphasize the diversity in tree structures, providing a range of natural configurations. Distributions vectors Hand drawn tree silhouette on white background. Silhouettes of three distinct tree shapes are depicted against a white background. Each tree has a unique outline. Silhouettes of three distinct tree shapes are depicted against a white background. Each tree has a unique outline, with detailed branching and varying leaf distributions, capturing their individual forms. The central tree stands slightly taller, while the others exhibit different canopy widths and densities. These artistic renditions emphasize the diversity in tree structures, providing a range of natural configurations.
Free with trial The image displays two overlaid histograms representing distinct data distributions. The left histogram is depicted in shades of gray and black, showing a skewed distribution with most values clustered toward one end. The right histogram appears in a gradient of pink and purple, indicating a more symmetric, bell-shaped distribution. Both histograms are positioned back-to-back for comparative. Distributions vectors Dual histogram comparison of data distributions in analysis. The image displays two overlaid histograms representing distinct data distributions. The left. The image displays two overlaid histograms representing distinct data distributions. The left histogram is depicted in shades of gray and black, showing a skewed distribution with most values clustered toward one end. The right histogram appears in a gradient of pink and purple, indicating a more symmetric, bell-shaped distribution. Both histograms are positioned back-to-back for comparative
Free with trial Achieve balanced table styling using symmetrical plate arrangement outline graphics displaying centered dish distributions, structured dining layouts, and formal hospitality. Distributions vectors Structured Table Setting Graphic Presenting Perfectly Centered Dish Distributions For Modern Hospitality. Achieve balanced table styling using symmetrical plate. Achieve balanced table styling using symmetrical plate arrangement outline graphics displaying centered dish distributions, structured dining layouts, and formal hospitality
Free with trial A clear pie chart icon, designed for visual data breakdown and easy analysis of proportions. Ideal for presentations, reports, or statistical dashboards. This intuitive vector graphic helps in understanding categorical data distributions, making it an essential tool for effective information communication, vector design Generative AI. Distributions vectors Pie Chart with Visual Data Breakdown for Clear Analysis, vector design Generative AI. A clear pie chart icon, designed for visual data breakdown and easy. A clear pie chart icon, designed for visual data breakdown and easy analysis of proportions. Ideal for presentations, reports, or statistical dashboards. This intuitive vector graphic helps in understanding categorical data distributions, making it an essential tool for effective information communication, vector design Generative AI
Free with trial Four abstract textures with black splatter and scratch patterns on a white background are arranged in a 2x2 grid. Each pattern features random distributions of black markings, resembling paint splatters or distressed surfaces. The style is grunge or distressed, offering versatile use in digital design for backgrounds, overlays, or artistic projects. The combination of sharp contrasts between black and white adds depth and dimension to each texture, enhancing visual interest. Distributions vectors Grunge Vector Texture Collection – Rough, Distressed, Vintage Design Elements. Four abstract textures with black splatter and scratch patterns on a white. Four abstract textures with black splatter and scratch patterns on a white background are arranged in a 2x2 grid. Each pattern features random distributions of black markings, resembling paint splatters or distressed surfaces. The style is grunge or distressed, offering versatile use in digital design for backgrounds, overlays, or artistic projects. The combination of sharp contrasts between black and white adds depth and dimension to each texture, enhancing visual interest.
Free with trial Collection of six seamless polka dot patterns on vertical panels. Each panel features black dots on a white background in varying sizes and arrangements. Patterns range from evenly spaced large dots to closely packed small dots. One panel displays a grid-like arrangement, while others have random distributions. The text "POLKA DOT SEAMLESS PATTERNS" is centrally placed to identify the collection. Distributions vectors Six seamless polka dot patterns on vertical panels. Collection of six seamless polka dot patterns on vertical panels. Each panel features black dots on a white. Collection of six seamless polka dot patterns on vertical panels. Each panel features black dots on a white background in varying sizes and arrangements. Patterns range from evenly spaced large dots to closely packed small dots. One panel displays a grid-like arrangement, while others have random distributions. The text "POLKA DOT SEAMLESS PATTERNS" is centrally placed to identify the collection.
Free with trial A straightforward infographic vector illustration of a simple vertical bar chart, presenting data with clear percentage values. This clean graphic is ideal for quick insights into performance, distributions, or survey results. Provided in high resolution and suitable for both web and print use, vector design Generative AI. Distributions vectors Simple Vertical Bar Chart with Percentages, vector design Generative AI. A straightforward infographic vector illustration of a simple vertical bar chart. A straightforward infographic vector illustration of a simple vertical bar chart, presenting data with clear percentage values. This clean graphic is ideal for quick insights into performance, distributions, or survey results. Provided in high resolution and suitable for both web and print use, vector design Generative AI
Free with trial A comprehensive flat vector illustration of a pie chart displaying percentage distributions for different categories. Ideal for data analysis, market research, financial reports, or educational content. This icon effectively visualizes proportions and comparative data insights. vector design Generative AI. Distributions vectors Pie Chart with Percentage Distribution, vector design Generative AI. A comprehensive flat vector illustration of a pie chart displaying percentage distributions. A comprehensive flat vector illustration of a pie chart displaying percentage distributions for different categories. Ideal for data analysis, market research, financial reports, or educational content. This icon effectively visualizes proportions and comparative data insights. vector design Generative AI
Free with trial A colorful vector illustration of a pie chart, clearly presenting proportional data segments. This essential infographic element is ideal for business reports, academic presentations, or marketing dashboards, offering an easily digestible visual representation of statistical distributions and shares. vector design Generative AI. Distributions vectors Vibrant Pie Chart Data Visualization Vector, vector design Generative AI. A colorful vector illustration of a pie chart, clearly presenting proportional data. A colorful vector illustration of a pie chart, clearly presenting proportional data segments. This essential infographic element is ideal for business reports, academic presentations, or marketing dashboards, offering an easily digestible visual representation of statistical distributions and shares. vector design Generative AI
Free with trial A vector illustration of algorithmic scatter patterns, forming an abstract geometric design. This design represents mathematical art, complex patterns, and visually interesting algorithmic distributions in vector format vector design Generative AI. Distributions vectors Algorithmic scatter patterns, abstract geometric design vector design Generative AI. A vector illustration of algorithmic scatter patterns, forming an abstract. A vector illustration of algorithmic scatter patterns, forming an abstract geometric design. This design represents mathematical art, complex patterns, and visually interesting algorithmic distributions in vector format vector design Generative AI
Free with trial A colorful vector illustration of a stacked bar chart with multiple segments, ideal for comparative data analysis. This graphic is excellent for visualizing proportions within categories, survey results, or market share distributions in business reports or academic presentations, offering clear insights, vector design Generative AI. Distributions vectors Stacked Bar Chart with Multiple Segments for Data Comparison, vector design Generative AI. A colorful vector illustration of a stacked bar chart with multiple. A colorful vector illustration of a stacked bar chart with multiple segments, ideal for comparative data analysis. This graphic is excellent for visualizing proportions within categories, survey results, or market share distributions in business reports or academic presentations, offering clear insights, vector design Generative AI
Free with trial A vivid vector illustration of a world map with specific regions highlighted in different colors, offering a clear geographical overview. This design is perfect for educational purposes, travel planning, business analytics, or international relations presentations. It provides a visual tool for understanding global distributions and connections, vector design Generative AI. Distributions vectors World Map with Highlighted Regions, Global Geographical Overview, vector design Generative AI. A vivid vector illustration of a world map with specific regions. A vivid vector illustration of a world map with specific regions highlighted in different colors, offering a clear geographical overview. This design is perfect for educational purposes, travel planning, business analytics, or international relations presentations. It provides a visual tool for understanding global distributions and connections, vector design Generative AI
Free with trial A set of diverse pie charts, each showcasing different percentage breakdowns 5, 2, 10, 3, 6. jpg, ideal for visualizing varied data distributions or comparative analysis. This collection is versatile for presentations, reports, or educational content. Clean and effective for quick data insights, vector design Generative AI. Distributions vectors Diverse Pie Chart Set for Data Visualization, vector design Generative AI. A set of diverse pie charts, each showcasing different percentage breakdowns 5, 2, 10. A set of diverse pie charts, each showcasing different percentage breakdowns 5, 2, 10, 3, 6.jpg, ideal for visualizing varied data distributions or comparative analysis. This collection is versatile for presentations, reports, or educational content. Clean and effective for quick data insights, vector design Generative AI
Free with trial A vibrant vector illustration of a segmented pie chart, displaying data distributions of 30, 54, and 25. This versatile graphic is perfect for presenting statistical information in business reports, financial forecasts, educational materials, and marketing analysis, offering a clear and easily digestible visual summary of proportions, vector design Generative AI. Distributions vectors Segmented Pie Chart Vector for Business and Data Analysis, vector design Generative AI. A vibrant vector illustration of a segmented pie chart, displaying data. A vibrant vector illustration of a segmented pie chart, displaying data distributions of 30, 54, and 25. This versatile graphic is perfect for presenting statistical information in business reports, financial forecasts, educational materials, and marketing analysis, offering a clear and easily digestible visual summary of proportions, vector design Generative AI
Free with trial A symbolic vector illustration of a hand gently holding an achievement medal, representing the act of awarding, recognition, and appreciation. Ideal for depicting ceremonies, prize distributions, or conveying a sense of honor and accomplishment. This graphic highlights the value of hard work and the moment of receiving due commendation, vector design Generative AI. Distributions vectors Award Presentation Icon Hand Holding Achievement Medal, vector design Generative AI. A symbolic vector illustration of a hand gently holding an achievement medal. A symbolic vector illustration of a hand gently holding an achievement medal, representing the act of awarding, recognition, and appreciation. Ideal for depicting ceremonies, prize distributions, or conveying a sense of honor and accomplishment. This graphic highlights the value of hard work and the moment of receiving due commendation, vector design Generative AI
Free with trial A compelling vector illustration of a layered pyramid infographic displaying various percentage distributions 20, 30, 40, etc.. jpg. This visual is ideal for hierarchical data, demographic breakdowns, or organizational structures in presentations and reports. Clean and professional for effective data visualization, vector design Generative AI. Distributions vectors Layered Pyramid Infographic with Percentage Distribution, vector design Generative AI. A compelling vector illustration of a layered pyramid infographic. A compelling vector illustration of a layered pyramid infographic displaying various percentage distributions 20, 30, 40, etc..jpg. This visual is ideal for hierarchical data, demographic breakdowns, or organizational structures in presentations and reports. Clean and professional for effective data visualization, vector design Generative AI
Free with trial A series of three distinct pie charts, symbolizing complex data comparison, multiple statistical sets, and diverse analytical insights. This icon is ideal for detailed reports, research findings, or comparative studies, representing a comprehensive view of various data distributions, vector design Generative AI. Distributions vectors Multiple Pie Charts, Complex Data Comparison, Statistical Sets, vector design Generative AI. A series of three distinct pie charts, symbolizing complex data. A series of three distinct pie charts, symbolizing complex data comparison, multiple statistical sets, and diverse analytical insights. This icon is ideal for detailed reports, research findings, or comparative studies, representing a comprehensive view of various data distributions, vector design Generative AI
Free with trial The image shows a stack of layered heatmaps, each with distinct color gradients ranging from blue to green, red, and yellow. The layers appear to represent different datasets or variables, potentially illustrating correlations, distributions, or trends over time or categories. The visual structure suggests a comparative analysis, where each layer contributes to a comprehensive understanding of the. Distributions vectors Layered heatmap visualization of abstract data trends across multiple dimensions isolated on transparent background. The image shows a stack of layered heatmaps. The image shows a stack of layered heatmaps, each with distinct color gradients ranging from blue to green, red, and yellow. The layers appear to represent different datasets or variables, potentially illustrating correlations, distributions, or trends over time or categories. The visual structure suggests a comparative analysis, where each layer contributes to a comprehensive understanding of the
Free with trial A vector illustration showcasing algorithmic scatter patterns in an abstract design. This design represents algorithmic art, pattern generation, and the beauty of mathematical distributions in visual form vector design Generative AI. Distributions vectors Algorithmic scatter patterns, abstract design vector design Generative AI. A vector illustration showcasing algorithmic scatter patterns in an abstract design. A vector illustration showcasing algorithmic scatter patterns in an abstract design. This design represents algorithmic art, pattern generation, and the beauty of mathematical distributions in visual form vector design Generative AI
Free with trial An icon showing three small pie charts, representing multiple data distributions or allowing for comparison between different sets of proportional data. Useful for reports, dashboards, or presentations comparing various categories or groups, vector design Generative AI. Distributions vectors Multiple Pie Charts Icon, Representing Comparative Data, vector design Generative AI. An icon showing three small pie charts, representing multiple data. An icon showing three small pie charts, representing multiple data distributions or allowing for comparison between different sets of proportional data. Useful for reports, dashboards, or presentations comparing various categories or groups, vector design Generative AI
Free with trial A detailed pie chart icon with multiple segments and a key, representing data analysis, complex distributions, reports, or statistical breakdown with specific indicators. Useful for comprehensive presentations , vector design Generative AI. Distributions vectors Detailed pie chart icon, representing data analysis and key , vector design Generative AI. A detailed pie chart icon with multiple segments and a key. A detailed pie chart icon with multiple segments and a key, representing data analysis, complex distributions, reports, or statistical breakdown with specific indicators. Useful for comprehensive presentations , vector design Generative AI
Free with trial An outline icon of a pyramid chart or diagram, used to illustrate hierarchical structures, data funnels, organizational levels, or statistical distributions. Ideal for business presentations, infographics, and data visualization. vector design Generative AI. Distributions vectors Pyramid Chart Diagram Outline Icon for Hierarchy Data Stat, vector design Generative AI. An outline icon of a pyramid chart or diagram, used to illustrate. An outline icon of a pyramid chart or diagram, used to illustrate hierarchical structures, data funnels, organizational levels, or statistical distributions. Ideal for business presentations, infographics, and data visualization. vector design Generative AI
Free with trial A vector illustration of a Qurbani meat delivery truck, representing logistics, meat distribution, and the transportation of Qurbani meat for charitable purposes and Eid al,Adha distributions. vector design Generative AI. Distributions vectors Qurbani meat delivery truck, logistics vector design Generative AI. A vector illustration of a Qurbani meat delivery truck, representing logistics, meat. A vector illustration of a Qurbani meat delivery truck, representing logistics, meat distribution, and the transportation of Qurbani meat for charitable purposes and Eid al,Adha distributions. vector design Generative AI
Free with trial Flat vector icon featuring three pie charts with varying colors and distributions. Represents data analysis, statistics, market share, or diverse categorical data. Suitable for reports, infographics, dashboards, or illustrating various data breakdowns. Shows varied data proportions, vector design Generative AI. Distributions vectors Colorful Pie Charts Data Distribution Icons, vector design Generative AI. Flat vector icon featuring three pie charts with varying colors and distributions. Flat vector icon featuring three pie charts with varying colors and distributions. Represents data analysis, statistics, market share, or diverse categorical data. Suitable for reports, infographics, dashboards, or illustrating various data breakdowns. Shows varied data proportions, vector design Generative AI
Free with trial A collection of dynamic pie charts, each illustrating different percentage distributions 3, 6, 50, 45, 30. jpg, suitable for detailed data breakdown and comparative analysis. This versatile infographic is ideal for market share, survey results, or budget allocation. Clear and engaging for visual insights, vector design Generative AI. Distributions vectors Dynamic Pie Charts for Data Distribution, vector design Generative AI. A collection of dynamic pie charts, each illustrating different percentage distributions 3. A collection of dynamic pie charts, each illustrating different percentage distributions 3, 6, 50, 45, 30.jpg, suitable for detailed data breakdown and comparative analysis. This versatile infographic is ideal for market share, survey results, or budget allocation. Clear and engaging for visual insights, vector design Generative AI
Free with trial A clear vector illustration presenting two pie charts sidebyside, each displaying different percentage distributions 30, 60, 50, 50. jpg, ideal for comparative analysis or AB testing results. This graphic is perfect for presentations and reports requiring direct data comparison. Simple and effective for visual insights, vector design Generative AI. Distributions vectors Dual Pie Charts for Comparative Analysis, vector design Generative AI. A clear vector illustration presenting two pie charts sidebyside, each displaying. A clear vector illustration presenting two pie charts sidebyside, each displaying different percentage distributions 30, 60, 50, 50.jpg, ideal for comparative analysis or AB testing results. This graphic is perfect for presentations and reports requiring direct data comparison. Simple and effective for visual insights, vector design Generative AI
Free with trial Bold vector illustrations of segmented pie charts with clear percentage indicators, offering a visual analysis of proportional data. These graphics are ideal for financial reports, survey results, or any presentation effectively communicating statistical distributions and shares, vector design Generative AI. Distributions vectors Segmented Pie Charts Vector Analysis, Proportional Data, vector design Generative AI. Bold vector illustrations of segmented pie charts with clear percentage. Bold vector illustrations of segmented pie charts with clear percentage indicators, offering a visual analysis of proportional data. These graphics are ideal for financial reports, survey results, or any presentation effectively communicating statistical distributions and shares, vector design Generative AI
Free with trial People analyze crypto and bitcoin pie charts to understand asset distributions, market share, and increasing trends in financial. Investment strategies. Distributions vectors People analyze crypto and bitcoin pie charts to understand asset distributions, market share, and increasing trends in financial. Investment strategies
Free with trial A collection of dynamic vector bar charts, each illustrating different percentage distributions and comparative data with varying colors. These versatile graphics are excellent for business presentations, market analysis, educational reports, or infographics, providing clear and impactful visual representations of statistical information and trends, vector design Generative AI. Distributions vectors Dynamic bar charts, visualizing percentage distribution, vector design Generative AI. A collection of dynamic vector bar charts, each illustrating different. A collection of dynamic vector bar charts, each illustrating different percentage distributions and comparative data with varying colors. These versatile graphics are excellent for business presentations, market analysis, educational reports, or infographics, providing clear and impactful visual representations of statistical information and trends, vector design Generative AI
Free with trial Sophisticated topographic stipple pattern featuring flowing wave distributions and vibrant cyber-inspired gradient dots, ideal for modern tech backgrounds and sleek branding applications. Distributions vectors Abstract Topographic Stipple Dot Wave Pattern. Sophisticated topographic stipple pattern featuring flowing wave distributions and vibrant cyber-inspired gradient. Sophisticated topographic stipple pattern featuring flowing wave distributions and vibrant cyber-inspired gradient dots, ideal for modern tech backgrounds and sleek branding applications
Free with trial Complex monochromatic caustic line pattern featuring intricate geometric cell structures and organic wave distributions for modern surface designs. Distributions vectors Monochrome Caustic Vector Line Pattern Background. Complex monochromatic caustic line pattern featuring intricate geometric cell structures and organic wave. Complex monochromatic caustic line pattern featuring intricate geometric cell structures and organic wave distributions for modern surface designs
Free with trial Probability theory set in scandinavian style. Featuring sample space dice cards roulette wheel distributions histograms scatter plots venn diagrams formulas. Distributions vectors Probability theory set in scandinavian style. Featuring sample space dice cards roulette wheel distributions histograms scatter plots venn diagrams formulas
Free with trial Pie chart. A pie chart is a business report graphic that represents proportions and category distributions using divided sections of a circle. Distributions vectors Pie chart. A pie chart is a business report graphic that represents proportions and category distributions using divided sections of a circle
Free with trial Probability theory set in outline line art. Featuring sample space dice cards roulette wheel distributions histograms scatter plots venn diagrams formulas. Distributions vectors Probability theory set in outline line art. Featuring sample space dice cards roulette wheel distributions histograms scatter plots venn diagrams formulas
Free with trial Green abstract textures on a black background are displayed in four panels. Each panel features various patterns made up of fine lines, scratches, and splatters, creating a distressed, grunge-like effect. This arrangement is bordered by bright green, highlighting the contrast between the vivid color and the dark backdrop. The textures suggest a chaotic, messy artistic style, showcasing different intensities and distributions of the green elements across each panel. Distributions vectors Collection of green paint brush strokes on black background. Green abstract textures on a black background are displayed in four panels. Each panel features. Green abstract textures on a black background are displayed in four panels. Each panel features various patterns made up of fine lines, scratches, and splatters, creating a distressed, grunge-like effect. This arrangement is bordered by bright green, highlighting the contrast between the vivid color and the dark backdrop. The textures suggest a chaotic, messy artistic style, showcasing different intensities and distributions of the green elements across each panel.
Free with trial Build strong customer connections by distributing regular informational digests featuring updates and special offers tailored for subscribers. Distributions vectors Creating Impactful Email Newsletters to Drive Brand Awareness. Build strong customer connections by distributing regular informational digests featuring updates. Build strong customer connections by distributing regular informational digests featuring updates and special offers tailored for subscribers
Free with trial Set of nine distinct black bar chart icons arranged in a grid against a white background. The feature various arrangements of solid black rectangles of differing heights, representing different data distributions, trends, and growth patterns. Some charts show ascending steps, others display bell-curve distributions, and some show irregular fluctuations. The style is minimalist, flat, and high-. Distributions vectors Collection of black bar chart icons and data visualization symbols. Set of nine distinct black bar chart icons arranged in a grid against a white background. The. Set of nine distinct black bar chart icons arranged in a grid against a white background. The feature various arrangements of solid black rectangles of differing heights, representing different data distributions, trends, and growth patterns. Some charts show ascending steps, others display bell-curve distributions, and some show irregular fluctuations. The style is minimalist, flat, and high-
Free with trial Deliver compelling digital digests featuring curated content designed to keep your audience informed and actively engaged long term. Distributions vectors Engaging Email Newsletter Design Ideas for Better Audience Retention. Deliver compelling digital digests featuring curated content designed to keep your audience. Deliver compelling digital digests featuring curated content designed to keep your audience informed and actively engaged long term
Free with trial Colorful layered area chart illustration representing multiple datasets and trend distributions. Ideal for business presentations, financial reports, statistics, dashboards, analytics projects, and educational content. Distributions vectors Layered Area Chart Illustration for Data Visualization and Trend Analysis. Colorful layered area chart illustration representing multiple datasets and trend. Colorful layered area chart illustration representing multiple datasets and trend distributions. Ideal for business presentations, financial reports, statistics, dashboards, analytics projects, and educational content.
Free with trial This Business Infographic: A Comprehensive Guide to Circular Diagram Presentations is crafted to present business data, processes, and performance metrics in a visually structured and easy-to-understand format. By using clear circular diagrams, it effectively illustrates relationships, distributions, workflows, and comparisons, making complex information more accessible to viewers. Ideal for corporate presentations, strategy reports, marketing analysis, and training materials, this infographic enhances communication by turning key insights into engaging visuals. Distributions vectors Business Infographic: A Comprehensive Guide to Circular Diagram Presentations. This Business Infographic: A Comprehensive Guide to Circular Diagram Presentations. This Business Infographic: A Comprehensive Guide to Circular Diagram Presentations is crafted to present business data, processes, and performance metrics in a visually structured and easy-to-understand format. By using clear circular diagrams, it effectively illustrates relationships, distributions, workflows, and comparisons, making complex information more accessible to viewers. Ideal for corporate presentations, strategy reports, marketing analysis, and training materials, this infographic enhances communication by turning key insights into engaging visuals.
Free with trial Probability theory set in scandinavian style. Featuring sample space dice cards roulette wheel distributions histograms scatter plots venn diagrams formulas. Distributions vectors Probability theory set in scandinavian style. Featuring sample space dice cards roulette wheel distributions histograms scatter plots venn diagrams formulas
Free with trial A black and white halftone pattern featuring an array of dots varying in size. The dots are arranged in diagonal lines across a plain white background, creating a gradient effect from dense to sparse distributions. This optical effect is commonly used in graphic design to mimic shades of gray and create texture and depth. The pattern is reminiscent of traditional printing techniques used in comics and newspapers. Distributions vectors A black and white halftone pattern featuring an array of dots varying in size. The dots are arranged in diagonal lines across a plain white background
Free with trial The image features a circular arrangement of black dots and clusters against a white background. The dots are unevenly distributed, creating a sense of randomness and spontaneity. Some areas have dense clusters of dots, while others have sparse distributions, forming an intriguing and visually engaging pattern. Distributions vectors Abstract circular pattern with scattered dots. The image features a circular arrangement of black dots and clusters against a white background. The dots are. The image features a circular arrangement of black dots and clusters against a white background. The dots are unevenly distributed, creating a sense of randomness and spontaneity. Some areas have dense clusters of dots, while others have sparse distributions, forming an intriguing and visually engaging pattern
Free with trial The image features a minimalist and abstract pattern composed of numerous black dots scattered across a white background. The dots are arranged in a circular formation, creating a sense of balance and symmetry. The dots vary in size and density, with some areas containing clusters of dots while others have sparse distributions. The overall composition is simple yet intriguing, evoking a sense of. Distributions vectors Abstract pattern of dots forming a circular design. The image features a minimalist and abstract pattern composed of numerous black dots scattered across a white. The image features a minimalist and abstract pattern composed of numerous black dots scattered across a white background. The dots are arranged in a circular formation, creating a sense of balance and symmetry. The dots vary in size and density, with some areas containing clusters of dots while others have sparse distributions. The overall composition is simple yet intriguing, evoking a sense of
Free with trial Data Driven Circular Shape Visualizations. Circular shapes formed by dotted distributions creating varied ring density patterns. Distributions vectors Data Driven Circular Shape Visualizations. Circular shapes formed by dotted distributions creating varied ring density patterns
Free with trial Six black spheres with various white dot patterns arranged in two rows, showing different symmetrical distributions of spots in a minimal flat design style. Generative AI. Distributions vectors Black and white dot pattern spheres set of six simple balls. Six black spheres with various white dot patterns arranged in two rows, showing different. Six black spheres with various white dot patterns arranged in two rows, showing different symmetrical distributions of spots in a minimal flat design style. Generative AI
Free with trial Monochrome halftone pattern featuring an array of black squares on a white background. The squares vary in size, creating a gradient effect that gives an illusion of depth and movement. The arrangement is diagonal, with denser concentrations creating darker areas and sparser distributions appearing lighter. This technique is often used in printing to simulate gradients and shading in images. Distributions vectors Monochrome halftone pattern featuring an array of black squares on a white background. The squares vary in size, creating a gradient effect that gives an
Free with trial Scales balance icon set in black silhouette, representing justice, fairness, and equality. With varying weight distributions. Distributions vectors Scales balance icon set in black silhouette, representing justice, fairness, and equality. With varying weight distributions
Free with trial Supply chain optimization, logistics data, business forecasting, delivery tracking, distribution planning, warehousing analytics. Graph with dynamic data and map with icons. Supply chain optimization. Distributions vectors Data Visualization of Supply Chain Logistics Analytics with a Distribution Map and Arrow Symbol. Supply chain optimization, logistics data, business forecasting. Supply chain optimization, logistics data, business forecasting, delivery tracking, distribution planning, warehousing analytics. Graph with dynamic data and map with icons. Supply chain optimization
Free with trial This image features a collection of sixteen distinct geometric patterns and diagrams arranged in a 4x4 grid. Each pattern is unique and displays a variety of intricate designs, including interconnected lines, dots, and arrows. Some patterns exhibit symmetrical arrangements, while others show more chaotic and random distributions. The diagrams use black lines and dots on a white background,. Distributions vectors Collection of complex geometric patterns and diagrams. This image features a collection of sixteen distinct geometric patterns and diagrams arranged in a 4x4. This image features a collection of sixteen distinct geometric patterns and diagrams arranged in a 4x4 grid. Each pattern is unique and displays a variety of intricate designs, including interconnected lines, dots, and arrows. Some patterns exhibit symmetrical arrangements, while others show more chaotic and random distributions. The diagrams use black lines and dots on a white background,
Free with trial Collection of 24 data analytics donut chart icons displayed in two rows. The first row features 12 icons with editable outline strokes, showcasing various segmented circle designs for infographics. The second row consists of 12 solid icons, featuring similar designs with different sections filled in orange, gray, and blue. These icons are ideal for dashboard user interfaces (UI) to visually represent data distributions and comparisons. Distributions vectors Data Analytics Donut Chart Icons Collection with Editable Outline Stroke and Solid Infographic Elements for Dashboard UI. Collection of 24 data analytics donut. Collection of 24 data analytics donut chart icons displayed in two rows. The first row features 12 icons with editable outline strokes, showcasing various segmented circle designs for infographics. The second row consists of 12 solid icons, featuring similar designs with different sections filled in orange, gray, and blue. These icons are ideal for dashboard user interfaces (UI) to visually represent data distributions and comparisons.
Free with trial Data Profiling and Assessment Infographic with Circle or Circular Diagram. Containing Anomaly Detection Techniques, Completeness Ratios, Consistency Checks Across Sources, Data Accuracy Metrics. Distributions vectors Data Profiling and Assessment Infographic with Circle or Circular Diagram. Containing Anomaly Detection Techniques, Completeness. Ratios, Consistency Checks. Data Profiling and Assessment Infographic with Circle or Circular Diagram. Containing Anomaly Detection Techniques, Completeness Ratios, Consistency Checks Across Sources, Data Accuracy Metrics
Free with trial Model Drift Detection in Machine Learning Infrastructure Icon. A vector pictogram with thin black lines on a transparent background. The line thickness is editable. It illustrates performance degradation over time by comparing two data distributions. Distributions vectors Model Drift Detection in Machine Learning Infrastructure Icon. A vector pictogram with thin black lines on a transparent background. The line thickness is
Free with trial Grid layout of 16 data visualization icons, featuring bar graphs, pie charts, and line charts. Each icon uses a color scheme of green, blue, and gray on a white background. The icons represent various statistical and analytical tools, suitable for presenting data in business, web analytics, or educational contexts. The designs are minimalistic, highlighting different types of data presentations, such as trends, comparisons, and distributions. Distributions vectors Collection of hand drawn charts and graphs in blue green and gray data analysis. Grid layout of 16 data visualization icons, featuring bar graphs, pie charts. Grid layout of 16 data visualization icons, featuring bar graphs, pie charts, and line charts. Each icon uses a color scheme of green, blue, and gray on a white background. The icons represent various statistical and analytical tools, suitable for presenting data in business, web analytics, or educational contexts. The designs are minimalistic, highlighting different types of data presentations, such as trends, comparisons, and distributions.
Free with trial A vibrant pyramid chart infographic vector, clearly illustrating hierarchical structures or layered data with distinct sections. This versatile design is ideal for showing organizational levels, demographic distributions, or progressive stages in presentations, reports, or educational materials, offering a clear visual breakdown, vector design Generative AI. Distributions vectors Pyramid Chart Infographic Vector for Hierarchy & Layered Data, vector design Generative AI. A vibrant pyramid chart infographic vector, clearly illustrating. A vibrant pyramid chart infographic vector, clearly illustrating hierarchical structures or layered data with distinct sections. This versatile design is ideal for showing organizational levels, demographic distributions, or progressive stages in presentations, reports, or educational materials, offering a clear visual breakdown, vector design Generative AI
Free with trial This image features a collection of twelve distinct black and white geometric patterns arranged in a grid. Each pattern is unique, showcasing various designs such as lines, dots, and shapes. The patterns include symmetrical arrangements, radial designs, and random distributions, creating a visually intriguing and diverse set of compositions. The monochromatic color scheme enhances the contrast and. Distributions vectors Abstract black and white geometric patterns. This image features a collection of twelve distinct black and white geometric patterns arranged in a grid. Each. This image features a collection of twelve distinct black and white geometric patterns arranged in a grid. Each pattern is unique, showcasing various designs such as lines, dots, and shapes. The patterns include symmetrical arrangements, radial designs, and random distributions, creating a visually intriguing and diverse set of compositions. The monochromatic color scheme enhances the contrast and
Free with trial Rmd, required, minimum, distribution. wooden table with Computer keyboard keys. close up of Computer keyboard keys,Business Concept. Supports PNG files with transparent backgrounds. Distributions vectors Rmd, required, minimum, distribution. wooden table with Computer keyboard keys. Close up of Computer keyboard keys,Business Concept.Supports PNG files with. rmd, required, minimum, distribution. wooden table with Computer keyboard keys.close up of Computer keyboard keys,Business Concept.Supports PNG files with transparent backgrounds.
Free with trial An of a student focused on a laptop displaying statistical graphs and charts. The scene depicts analytical work with pie charts, bar graphs, and probability distributions. The student is engaged in data analysis, using a stylus to annotate on the screen, surrounded by study essentials like a notebook and pens. This image conveys concepts of statistics, research, and academic study in a modern educational setting. Distributions vectors Student Analyzing Data Charts. An of a student focused on a laptop displaying statistical graphs and charts. The scene depicts analytical work with pie charts. An of a student focused on a laptop displaying statistical graphs and charts. The scene depicts analytical work with pie charts, bar graphs, and probability distributions. The student is engaged in data analysis, using a stylus to annotate on the screen, surrounded by study essentials like a notebook and pens. This image conveys concepts of statistics, research, and academic study in a modern educational setting.
Free with trial This image depicts a colorful pie chart illustrating a monthly budget breakdown, providing a clear visual representation of financial allocations and distributions. The chart is divided into sections, each representing a specific percentage of the total budget, allowing for easy comparison and analysis of different sectors and segments. This graphic is ideal for use in financial planning, budgeting, and economic analysis, offering a concise and informative way to communicate complex financial data and insights. Distributions vectors A colorful pie chart illustrating a monthly budget breakdown for financial planning and analysis. This image depicts a colorful pie chart illustrating a monthly. This image depicts a colorful pie chart illustrating a monthly budget breakdown, providing a clear visual representation of financial allocations and distributions. The chart is divided into sections, each representing a specific percentage of the total budget, allowing for easy comparison and analysis of different sectors and segments. This graphic is ideal for use in financial planning, budgeting, and economic analysis, offering a concise and informative way to communicate complex financial data and insights.
 Sign in