Free with trial Solution. Solid in liquid. Solution is a homogeneous mixture. Substance dissolved in another substance. Empirical vectors Solution. Solid in liquid. Solution is a homogeneous mixture. Substance dissolved in another substance. Solid in liquid
Free with trial Scientific method vector illustration. Labeled process methodology scheme. Educational empirical method of acquiring knowledge with observation, question, hypothesis, experiment, conclusion and result. Empirical vectors The scientific method vector illustration. Labeled process methodology scheme. Scientific method vector illustration. Labeled process methodology scheme. Scientific method vector illustration. Labeled process methodology scheme. Educational empirical method of acquiring knowledge with observation, question, hypothesis, experiment, conclusion and result
Free with trial Ohms law vector illustration. Fun physics mathematical equation explanation. Colorful Ohm and Volt men rushing ampere through conductor as animated formula. Labeled educational scene for schools. Empirical vectors Ohms law vector illustration. Fun physics mathematical equation explanation. Colorful Ohm and Volt men rushing ampere through conductor as animated formula
Free with trial Chemical experiment illustration. Chemical experiment, hand mixed chemicals vector illustration. Empirical vectors Chemical experiment illustration. Chemical experiment, hand mixed chemicals vector illustration
Free with trial Standard normal distribution, standard deviation and coverage in statistics. Empirical rule, 3-sigma or 68–95–99. 7 rule. Gaussian distribution or bell curve, used in statistics. Illustration. Vector. Empirical vectors Standard normal distribution, standard deviation and coverage in statistics. Empirical rule, 3-sigma or 68–95–99.7 rule. Gaussian distribution or bell
Free with trial Standard normal distribution, with the percentages for three standard deviations of the mean. Sometimes informally called bell curve. Used in probability theory and in statistics. Illustration. Vector. Empirical vectors Standard normal distribution, bell curve, with percentages. Standard normal distribution, with the percentages for three standard deviations of the mean. Standard normal distribution, with the percentages for three standard deviations of the mean. Sometimes informally called bell curve. Used in probability theory and in statistics. Illustration. Vector
Free with trial Scientist physics makes tests. Scientist physics teacher makes scientific tests and experiments. Vector illustration. Empirical vectors Scientist physics makes tests. Scientist physics teacher makes scientific tests and experiments. Vector illustration
Free with trial Gaussian distribution. Standard normal distribution, sometimes informally called a bell curve, used in probability theory and statistics. Standard deviation. Illustration on white background. Vector. Empirical vectors Gaussian distribution, standard normal distribution, bell curve. Gaussian distribution. Standard normal distribution, sometimes informally called a bell curve. Gaussian distribution. Standard normal distribution, sometimes informally called a bell curve, used in probability theory and statistics. Standard deviation. Illustration on white background. Vector.
Free with trial Engineering word cloud. Concept. Vector illustration. Empirical vectors Engineering word cloud. Concept. Vector illustration
Free with trial Qualitative content analysis and deep text data study outline hands concept. Empirical information classification methodology using deep analytical approach vector illustration. Info context research. Empirical vectors Qualitative content analysis and deep text data study outline hands concept. Empirical information classification methodology using deep analytical approach
Free with trial Methyllithium is the simplest organolithium reagent with the empirical formula CH3Li. This s block organometallic compound adopts an oligomeric structure both in solution and in the solid state. Empirical vectors Methyllithium is the simplest organolithium. Reagent with the empirical formula CH3Li. This s block organometallic compound adopts an oligomeric structure both. Methyllithium is the simplest organolithium reagent with the empirical formula CH3Li. This s block organometallic compound adopts an oligomeric structure both in solution and in the solid state
Free with trial Hand Holding a Magnifying Glass Vector Cartoon Illustration. Curious person inspecting and analyzing using a magnifier for empirical evidence. Empirical vectors Hand Holding a Magnifying Glass Vector Cartoon Illustration. Curious person inspecting and analyzing using a magnifier for empirical evidence
Free with trial The vector iceberg model of Critical Realism CR is a philosophical social science with 3 levels of realism in data collection visible empirical, underwater is hidden action and a root of a reality. Empirical vectors The vector iceberg model of Critical Realism CR is a philosophical social science with 3 levels of realism in data collection. Visible empirical, underwater is. The vector iceberg model of Critical Realism CR is a philosophical social science with 3 levels of realism in data collection visible empirical, underwater is hidden action and a root of a reality
Free with trial Chinese temple and old tree. Empirical vectors Chinese Architecture. Chinese temple and old tree. Chinese temple and old tree.
Free with trial Quartiles explanation, vector illustration diagram. Dividing data points into equal parts for data analysis and statistical work. Educational example model drawing. Lower, middle and upper quartile. Empirical vectors Quartiles explanation, vector illustration diagram. Dividing data points into equal parts for data analysis and statistical work. Educational example model
Free with trial Hooke law experiment infographic diagram. physics mechanics dynamics science education. spring compression example. relationship force distance. cartoon vector drawing. illustration scheme poster. Empirical vectors Hooke law experiment infographic diagram physics mechanics dynamics science. Hooke law experiment infographic diagram. physics mechanics dynamics science. Hooke law experiment infographic diagram. physics mechanics dynamics science education. spring compression example. relationship force distance. cartoon vector drawing. illustration scheme poster.
Free with trial Charles's law. relationship between volume and temperature. Increasing the temperature of a gas at constant pressure increases its volume. Explanation of the action of the law of volumes on the example of two balloons. Vector poster for education. Empirical vectors Charles\'s law. relationship between volume and temperature. Charles's law. relationship between volume and temperature. Increasing the temperature of a gas at. Charles's law. relationship between volume and temperature. Increasing the temperature of a gas at constant pressure increases its volume. Explanation of the action of the law of volumes on the example of two balloons. Vector poster for education
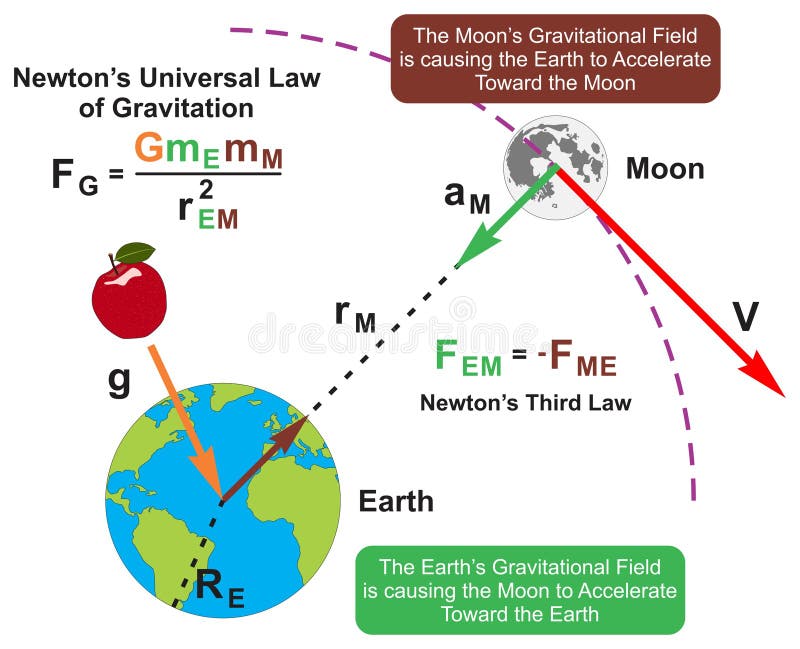
Free with trial Newton universal law of gravitation infographic diagram. physics science education. earth moon gravity effect. gravitational field force concept. formula equation vector chart. illustration scheme poster. Empirical vectors Newton universal law of gravitation infographic diagram physics science. Newton universal law of gravitation infographic diagram. physics science education. Newton universal law of gravitation infographic diagram. physics science education. earth moon gravity effect. gravitational field force concept. formula equation vector chart. illustration scheme poster
Free with trial Bell curve symbol, a simplified diagram for a standard normal distribution, also called Gaussian distribution, used in probability theory and in statistics. Illustration on white background. Vector. Empirical vectors Bell curve symbol, simplified diagram for a standard normal distribution. Bell curve symbol, a simplified diagram for a standard normal distribution, also called. Bell curve symbol, a simplified diagram for a standard normal distribution, also called Gaussian distribution, used in probability theory and in statistics. Illustration on white background. Vector.
Free with trial Opened book and molecular structures. Concept of scientific literature, studies and data, scholarly publication, academic publishing. Creative vector illustration for banner, poster, website. Empirical vectors Opened book and molecular structures. Concept of scientific literature, studies and data, scholarly publication, academic publishing. Creative vector
Free with trial Work experience word cloud. Concept. Vector illustration. Empirical vectors Work experience word cloud. Concept. Vector illustration
Free with trial Experiential learning blue gradient concept icon. Lifelong learning. Adult education theories and forms abstract idea thin line illustration. Isolated outline drawing. Myriad Pro-Bold fonts used. Empirical vectors Experiential learning blue gradient concept icon. Lifelong learning. Adult education theories and forms abstract idea thin line illustration. Isolated outline
Free with trial Personal experience word cloud. Concept. Vector illustration. Empirical vectors Personal experience word cloud. Concept. Vector illustration
Free with trial Engineering word cloud. Concept. Vector illustration. Empirical vectors Engineering word cloud. Concept. Vector illustration
Free with trial Scientific research. Vector illustration. Continuous learning is essential for staying updated with latest scientific research Experimentation allows scientists to test hypotheses and gather empirical. Empirical vectors Scientific research. Development new projects and ideas fuels innovation in scientific community. Scientific research. Vector illustration. Continuous learning. Scientific research. Vector illustration. Continuous learning is essential for staying updated with latest scientific research Experimentation allows scientists to test hypotheses and gather empirical
Free with trial Professional experience word cloud. Concept. Vector illustration. Empirical vectors Professional experience word cloud. Concept. Vector illustration
Free with trial Social justice outline icons collection. quity, Inclusion, Diversity, Empathy, Fairness, Intersectionality, Justice. Empirical vectors Social justice line icons collection. quity, Inclusion, Diversity, Empathy, Fairness, Intersectionality, Justice vector. Social justice outline icons collection. Social justice outline icons collection. quity, Inclusion, Diversity, Empathy, Fairness, Intersectionality, Justice
Free with trial Dissertation outline icons collection. Research, Thesis, Writing, Analysis, Literature review, Methodology, Proposal. Empirical vectors Dissertation line icons collection. Research, Thesis, Writing, Analysis, Literature review, Methodology, Proposal vector. Dissertation outline icons collection. Dissertation outline icons collection. Research, Thesis, Writing, Analysis, Literature review, Methodology, Proposal
Free with trial Pedagogical significance linear icons set. Instruction, Curriculum, Learning, Teaching, Development, Innovation, Improvement vector symbols and line concept signs. Assessment,Engagement,Methodology illustration. Empirical vectors Pedagogical significance linear icons set. Instruction, Curriculum, Learning, Teaching, Development, Innovation. Improvement vector symbols and line concept. Pedagogical significance linear icons set. Instruction, Curriculum, Learning, Teaching, Development, Innovation, Improvement vector symbols and line concept signs. Assessment,Engagement,Methodology illustration
Free with trial Houses and buildings outline icons collection. Sprint, Agile, Backlog, Daily, Retrospective, Planning, Stand-up vector. Empirical vectors Houses and buildings line icons collection. Sprint, Agile, Backlog, Daily, Retrospective, Planning, Stand-up vector and. Houses and buildings outline icons. Houses and buildings outline icons collection. Sprint, Agile, Backlog, Daily, Retrospective, Planning, Stand-up vector
Free with trial Interface empirical design website vector. experience research, data testing, optimization usability interface empirical design website character. people black line pencil drawing illustration. Empirical vectors Interface empirical design website vector. Experience research, data testing, optimization usability interface empirical design website character. people black
Free with trial A comprehensive vector illustration of a scientist examining a plant with a magnifying glass and simultaneously recording data on a clipboard. Ideal for scientific methodology, botanical research, or educational resources on empirical study. Showcases a holistic approach to science, vector design Generative AI. Empirical vectors Scientist Examining Plant and Recording Data, vector design Generative AI. A comprehensive vector illustration of a scientist examining a plant with a magnifying. A comprehensive vector illustration of a scientist examining a plant with a magnifying glass and simultaneously recording data on a clipboard. Ideal for scientific methodology, botanical research, or educational resources on empirical study. Showcases a holistic approach to science, vector design Generative AI
Free with trial A scientist uses a microscope in a setting with bookshelves, illustrating academic research and knowledge integration. This image portrays the scholarly environment where empirical work is combined with a vast knowledge base for scientific inquiry, vector design Generative AI. Empirical vectors Academic Research: Scientist in Library Lab Setting, vector design Generative AI. A scientist uses a microscope in a setting with bookshelves, illustrating. A scientist uses a microscope in a setting with bookshelves, illustrating academic research and knowledge integration. This image portrays the scholarly environment where empirical work is combined with a vast knowledge base for scientific inquiry, vector design Generative AI
Free with trial A scientist uses a microscope, with data charts visible nearby, symbolizing the visualization of microscopic findings. This image captures the process of transforming empirical observations into clear, interpretable data for scientific presentation, vector design Generative AI. Empirical vectors Visualizing Microscopic Data in Scientific Research, vector design Generative AI. A scientist uses a microscope, with data charts visible nearby, symbolizing the. A scientist uses a microscope, with data charts visible nearby, symbolizing the visualization of microscopic findings. This image captures the process of transforming empirical observations into clear, interpretable data for scientific presentation, vector design Generative AI
Free with trial An academic icon of an open book revealing chemical apparatus, symbolizing scientific research, chemical education, or laboratory experiments. Ideal for scientific publications, educational content, or biotech companies. Represents knowledge, discovery, and empirical investigation. A detailed, informative visual. vector design Generative AI. Empirical vectors Open Book with Chemical Apparatus, scientific research, vector design Generative AI. An academic icon of an open book revealing chemical apparatus, symbolizing. An academic icon of an open book revealing chemical apparatus, symbolizing scientific research, chemical education, or laboratory experiments. Ideal for scientific publications, educational content, or biotech companies. Represents knowledge, discovery, and empirical investigation. A detailed, informative visual. vector design Generative AI
Free with trial This icon features laboratory equipment, including a microscope and beaker, symbolizing chemical analysis and scientific experiments. Suitable for chemistry, biology, medical research, and educational content. Represents the pursuit of knowledge through empirical study, vector design Generative AI. Empirical vectors Chemistry Laboratory Analysis, Scientific Experiment, Research Equipment, vector design Generative AI. This icon features laboratory equipment, including a. This icon features laboratory equipment, including a microscope and beaker, symbolizing chemical analysis and scientific experiments. Suitable for chemistry, biology, medical research, and educational content. Represents the pursuit of knowledge through empirical study, vector design Generative AI
Free with trial An infographic detailing the Collect Data process, including steps to organize information, identify patterns, and draw conclusions. Essential for research, data analysis, and business intelligence. Ideal for educational materials and presentations on empirical methods, vector design Generative AI. Empirical vectors Data Collection Process: Organize, Identify, Conclude, vector design Generative AI. An infographic detailing the Collect Data process, including steps to. An infographic detailing the Collect Data process, including steps to organize information, identify patterns, and draw conclusions. Essential for research, data analysis, and business intelligence. Ideal for educational materials and presentations on empirical methods, vector design Generative AI
Free with trial A scientist performs research and data analysis in a laboratory, surrounded by experimental equipment and information displays. This illustration signifies empirical study, technological integration, and the pursuit of knowledge, vector design Generative AI. Empirical vectors Scientific Research and Data Analysis in Lab, vector design Generative AI. A scientist performs research and data analysis in a laboratory, surrounded by. A scientist performs research and data analysis in a laboratory, surrounded by experimental equipment and information displays. This illustration signifies empirical study, technological integration, and the pursuit of knowledge, vector design Generative AI
Free with trial This vector graphic features a scientist surrounded by test tubes and a microscope. Ideal for science, education, or laboratory themes, it symbolizes discovery, precision, and empirical study. vector design Generative AI. Empirical vectors Scientist with Test Tubes Vector Graphic for Science & Study, vector design Generative AI. This vector graphic features a scientist surrounded by test tubes and. This vector graphic features a scientist surrounded by test tubes and a microscope. Ideal for science, education, or laboratory themes, it symbolizes discovery, precision, and empirical study. vector design Generative AI
Free with trial A precise vector illustration depicting various science lab equipment, including beakers and flasks, symbolizing research, experimentation, and scientific discovery. Ideal for educational materials, scientific publications, or technology-related content. Represents the pursuit of knowledge and empirical investigation, vector design Generative AI. Empirical vectors Science Lab Equipment: Research, Experimentation & Discovery, vector design Generative AI. A precise vector illustration depicting various science lab equipment. A precise vector illustration depicting various science lab equipment, including beakers and flasks, symbolizing research, experimentation, and scientific discovery. Ideal for educational materials, scientific publications, or technology-related content. Represents the pursuit of knowledge and empirical investigation, vector design Generative AI
Free with trial Another precise vector illustration of a researcher or scientist at a microscope, emphasizing careful observation. This image highlights meticulous work, empirical data, groundbreaking discoveries, and academic pursuit, suitable for scientific publications, pharmaceutical research, or educational materials. Ideal for illustrating the dedication to scientific understanding, vector design Generative. Empirical vectors Researcher using microscope, detailed scientific investigation, vector design Generative AI. Another precise vector illustration of a researcher or scientist at. Another precise vector illustration of a researcher or scientist at a microscope, emphasizing careful observation. This image highlights meticulous work, empirical data, groundbreaking discoveries, and academic pursuit, suitable for scientific publications, pharmaceutical research, or educational materials. Ideal for illustrating the dedication to scientific understanding, vector design Generative
Free with trial A treemap illustrating the relative abundance of different atoms in a compound enabling chemists to quickly identify its empirical formula.. Vector illustration. Empirical vectors A treemap illustrating the relative abundance of different atoms in a compound enabling chemists to quickly identify its. Empirical formula.. Vector
Free with trial A detailed vector illustration of a scientist analyzing data on a computer while working with samples under a microscope in a laboratory. This scene captures the fusion of technology and empirical research, ideal for scientific journals or lab service promotions, vector design Generative AI. Empirical vectors Scientist analyzing data and samples in a laboratory, vector design Generative AI. A detailed vector illustration of a scientist analyzing data on a computer. A detailed vector illustration of a scientist analyzing data on a computer while working with samples under a microscope in a laboratory. This scene captures the fusion of technology and empirical research, ideal for scientific journals or lab service promotions, vector design Generative AI
Free with trial Two scientists collaborate in a lab, analyzing charts and utilizing a microscope for comprehensive research. This highlights teamwork, data-driven insights, and the integration of empirical observation with statistical analysis in scientific exploration, vector design Generative AI. Empirical vectors Collaborative Data Analysis and Research in Laboratory, vector design Generative AI. Two scientists collaborate in a lab, analyzing charts and utilizing a. Two scientists collaborate in a lab, analyzing charts and utilizing a microscope for comprehensive research. This highlights teamwork, data-driven insights, and the integration of empirical observation with statistical analysis in scientific exploration, vector design Generative AI
Free with trial An illustrative vector diagram explaining the scientific method, from hypothesis formulation to analysis. Perfect for educational purposes, research presentations, or illustrating structured problem-solving processes, emphasizing logical and empirical steps, vector design Generative AI. Empirical vectors Scientific Method Diagram, Hypothesis to Analysis, Research Flow, vector design Generative AI. An illustrative vector diagram explaining the scientific method. An illustrative vector diagram explaining the scientific method, from hypothesis formulation to analysis. Perfect for educational purposes, research presentations, or illustrating structured problem-solving processes, emphasizing logical and empirical steps, vector design Generative AI
Free with trial The standard deviation, sometimes called bell curve, describes the amount of variation in a data set by measuring and averaging, how much each value in the data set varies from the calculated mean. Empirical vectors Standard deviation, Gaussian distribution, and bell curve. The standard deviation, sometimes called bell curve, describes the amount of variation in a data set. The standard deviation, sometimes called bell curve, describes the amount of variation in a data set by measuring and averaging, how much each value in the data set varies from the calculated mean.
Free with trial Qualitative research methods and society data research outline hands concept. Scientific community analysis gathering non-numerical and sociological information for deep analytics vector illustration. Empirical vectors Qualitative research methods and society data research outline hands concept. Scientific community analysis gathering non-numerical and sociological
Free with trial Qualitative research methods for sociology tiny person neubrutalism concept. Analyze community using interview, focus groups and observation vector illustration. Scientific people data evaluation. Empirical vectors Qualitative research methods for sociology tiny person neubrutalism concept. Analyze community using interview, focus groups and observation vector
Free with trial Qualitative content analysis with text interpretation outline hands concept. Information research and analytic using charts, graphs and written materials vector illustration. Deep topic learning. Empirical vectors Qualitative content analysis with text interpretation outline hands concept. Information research and analytic using charts, graphs and written materials
Free with trial A comprehensive educational research methodology diagram comparing primary data and secondary data collection methods. Detailing primary data collected directly from original sources tailored to specific objectives versus secondary data drawn from previously available records, publications, and existing information for cost-effective research. Ideal for academic research manuals, university courseware, and data collection technique infographics. Empirical vectors Primary Data vs Secondary Data Collection Methods Diagram. A comprehensive educational research methodology diagram comparing primary data and secondary data. A comprehensive educational research methodology diagram comparing primary data and secondary data collection methods. Detailing primary data collected directly from original sources tailored to specific objectives versus secondary data drawn from previously available records, publications, and existing information for cost-effective research. Ideal for academic research manuals, university courseware, and data collection technique infographics.
Free with trial An educational statistics diagram illustrating cluster sampling technique. Depicting population division into naturally occurring geographic or demographic clusters, followed by random selection of entire intact clusters for study data collection. Empirical vectors Cluster Sampling Method Population Grouping Statistics Diagram. An educational statistics diagram illustrating cluster sampling technique. Depicting population. An educational statistics diagram illustrating cluster sampling technique. Depicting population division into naturally occurring geographic or demographic clusters, followed by random selection of entire intact clusters for study data collection.
Free with trial A clear research methodology diagram explaining systematic sampling. Depicting ordered population arrangement where every kth member is selected following an initial random starting point to produce a structured representative sample. Empirical vectors Systematic Sampling Method Ordered Selection Statistics Diagram. A clear research methodology diagram explaining systematic sampling. Depicting ordered. A clear research methodology diagram explaining systematic sampling. Depicting ordered population arrangement where every kth member is selected following an initial random starting point to produce a structured representative sample.
Free with trial An educational research statistics diagram demonstrating convenience sampling method. Depicting researcher selecting sample participants strictly based on ease of accessibility, proximity, and immediate availability rather than random criteria. Empirical vectors Convenience Sampling Non Probability Selection Research Diagram. An educational research statistics diagram demonstrating convenience sampling method. Depicting. An educational research statistics diagram demonstrating convenience sampling method. Depicting researcher selecting sample participants strictly based on ease of accessibility, proximity, and immediate availability rather than random criteria.
Free with trial A detailed statistics diagram demonstrating stratified random sampling. Showing population division into distinct homogeneous strata or subgroups followed by random selection from each stratum to guarantee proportional demographic representation. Empirical vectors Stratified Sampling Method Subgroup Division Statistics Diagram. A detailed statistics diagram demonstrating stratified random sampling. Showing population. A detailed statistics diagram demonstrating stratified random sampling. Showing population division into distinct homogeneous strata or subgroups followed by random selection from each stratum to guarantee proportional demographic representation.
Free with trial A detailed educational philosophy of science diagram explaining the differences between a hypothesis, a theory, and a scientific law. Detailing hypothesis as a testable explanation based on preliminary observations, theory as an explanation of how or why phenomena occur backed by extensive evidence, and law as a concise description of consistent natural patterns based on repeated measurements. Essential for general science textbooks, research methodology guides, and scientific literacy infographics. Empirical vectors Hypothesis vs Theory vs Scientific Law Philosophy of Science Diagram. A detailed educational philosophy of science diagram explaining the differences between a. A detailed educational philosophy of science diagram explaining the differences between a hypothesis, a theory, and a scientific law. Detailing hypothesis as a testable explanation based on preliminary observations, theory as an explanation of how or why phenomena occur backed by extensive evidence, and law as a concise description of consistent natural patterns based on repeated measurements. Essential for general science textbooks, research methodology guides, and scientific literacy infographics.
Free with trial An educational research methodology diagram featuring a two-way direction signpost labeled Quantitative and Qualitative. Perfect for academic research guides, social science methodology textbooks, statistics courseware, and research design infographics. Empirical vectors Quantitative vs Qualitative Research Signpost Methodology Diagram. An educational research methodology diagram featuring a two-way direction signpost labeled. An educational research methodology diagram featuring a two-way direction signpost labeled Quantitative and Qualitative. Perfect for academic research guides, social science methodology textbooks, statistics courseware, and research design infographics.
Free with trial A detailed statistics diagram illustrating snowball sampling technique. Depicting referral chain mechanism where initial study participants recruit, nominate, or refer additional eligible peers from hard-to-reach or specialized hidden target populations. Empirical vectors Snowball Sampling Method Referral Chain Network Statistics Diagram. A detailed statistics diagram illustrating snowball sampling technique. Depicting referral. A detailed statistics diagram illustrating snowball sampling technique. Depicting referral chain mechanism where initial study participants recruit, nominate, or refer additional eligible peers from hard-to-reach or specialized hidden target populations.
Free with trial A detailed statistics diagram demonstrating stratified random sampling. Showing population division into distinct homogeneous strata or subgroups followed by random selection from each stratum to guarantee proportional demographic representation. Empirical vectors Simple Random Sampling Probability Research Method Statistics Diagram. A detailed statistics diagram demonstrating stratified random sampling. Showing population. A detailed statistics diagram demonstrating stratified random sampling. Showing population division into distinct homogeneous strata or subgroups followed by random selection from each stratum to guarantee proportional demographic representation.
Free with trial Present empirical research effectively with this statistics metrics outline icon bundle showcasing core quantitative methods mathematical variables and scientific graph layouts. Empirical vectors Advanced Statistics Graphs and Core Performance Metrics Outline Icon Collection for Scientific Research. Present empirical research effectively with this. Present empirical research effectively with this statistics metrics outline icon bundle showcasing core quantitative methods mathematical variables and scientific graph layouts
Free with trial A realistic and detailed bell curve isolated on a white background, symbolizing a statistical distribution in data analysis and probability theory. The curve is smoothly shaped with intricate details, showcasing. Empirical vectors Understanding Data Distribution. Bell Curve Representation Concept. A realistic and detailed bell curve isolated on a white background, symbolizing a statistical. A realistic and detailed bell curve isolated on a white background, symbolizing a statistical distribution in data analysis and probability theory. The curve is smoothly shaped with intricate details, showcasing
Free with trial A visual creation highlighting a balanced composition with engaging details, presenting a harmonious and aesthetic blend of elements, suitable for various creative purposes. Empirical vectors Scientific equipment tubes, atom, microscope, and others, on light blue background. A visual creation highlighting a balanced composition with engaging details. A visual creation highlighting a balanced composition with engaging details, presenting a harmonious and aesthetic blend of elements, suitable for various creative purposes.
Free with trial An authoritative and professional vector illustration of Napoleon Bonaparte's Throne, capturing the distinct Empire Style aesthetic of the First French Empire. This high-quality graphic is designed in a clean, scalable vector style, masterfully highlighting the signature Neoclassical features: the gilded wood frame, laurel wreath carvings, and the iconic imperial eagle and bee motifs. The illustration showcases the circular backrest often featuring the embroidered "N" monogram, set against rich crimson velvet upholstery. Perfect for Napoleonic history branding, French military heritage graphics, museum educational materials, and premium monarchy-themed merchandise, this versatile Empirical Throne mascot represents power, ambition, and the architectural transition from the Baroque to the Roman-inspired Directoire style. This detailed asset is ideal for high-resolution print and digital media seeking a stylized Napoleon I Royal Chair illustration. Empirical vectors An authoritative and professional vector illustration of Napoleon Bonaparte\'s Throne. An authoritative and professional vector illustration of Napoleon. An authoritative and professional vector illustration of Napoleon Bonaparte's Throne, capturing the distinct Empire Style aesthetic of the First French Empire. This high-quality graphic is designed in a clean, scalable vector style, masterfully highlighting the signature Neoclassical features: the gilded wood frame, laurel wreath carvings, and the iconic imperial eagle and bee motifs. The illustration showcases the circular backrest often featuring the embroidered "N" monogram, set against rich crimson velvet upholstery. Perfect for Napoleonic history branding, French military heritage graphics, museum educational materials, and premium monarchy-themed merchandise, this versatile Empirical Throne mascot represents power, ambition, and the architectural transition from the Baroque to the Roman-inspired Directoire style. This detailed asset is ideal for high-resolution print and digital media seeking a stylized Napoleon I Royal Chair illustration.
Free with trial Scientific Research and Experimentation in a Laboratory, science innovation concept, illustration. Empirical vectors Scientific Research and Experimentation in a Laboratory, science innovation concept. Illustration
Free with trial Exploration of cosmetic quality testing with laboratory tools and colorful abstract design elements. Empirical vectors Exploration of cosmetic quality testing with laboratory tools and colorful abstract design elements.
Free with trial This image depicts an open book titled "Principles of Sociological Theory," focusing on the integration of ethical frameworks within modern academic research. The detailed illustration showcases a library setting, highlighting the importance of scholarly pursuits and the ethical considerations that. Empirical vectors Academic Research Ethics and Sociological Theory. This image depicts an open book titled 'Principles of Sociological Theory,' focusing on the integration of. This image depicts an open book titled "Principles of Sociological Theory," focusing on the integration of ethical frameworks within modern academic research. The detailed illustration showcases a library setting, highlighting the importance of scholarly pursuits and the ethical considerations that
Free with trial Data Analysis and Research Icons Business Metric Charts Set. Vector of data analysis and research icons business metric charts set. Empirical vectors Data Analysis and Research Icons Business Metric Charts Set. Vector of data analysis and research icons business metric charts set
Free with trial Data Analytics and Pie Chart Icons Business Metric Diagram Set. Vector of data analytics and pie chart icons business metric diagram set. Empirical vectors Data Analytics and Pie Chart Icons Business Metric Diagram Set. Vector of data analytics and pie chart icons business metric diagram set
Free with trial Illustration depicting usability testing in UI UX design with users engaging in various tasks in a collaborative workspace. Environment, AI Generated. Empirical vectors Illustration depicting usability testing in UI UX design with users engaging in various tasks in a collaborative workspace. Environment, AI Generated
Free with trial Scientific research. Vector illustration. Experimentation allows scientists to test hypotheses and gather empirical evidence Tests are conducted to evaluate effectiveness or validity scientific. Empirical vectors Scientific research. The scientific research metaphor helps us grasp complex concepts by drawing parallels. Scientific research. Vector illustration. Scientific research. Vector illustration. Experimentation allows scientists to test hypotheses and gather empirical evidence Tests are conducted to evaluate effectiveness or validity scientific
Free with trial Scientific research. Vector illustration. Scientific experiments aim to test specific hypotheses and gather empirical evidence Tests conducted during scientific research provide crucial data. Empirical vectors Scientific research. Researchers employ rigorous methodologies to ensure validity their scientific experiments. Scientific research. Vector illustration. Scientific research. Vector illustration. Scientific experiments aim to test specific hypotheses and gather empirical evidence Tests conducted during scientific research provide crucial data
Free with trial Scientific research. Vector illustration. Education plays pivotal role in nurturing next generation scientific researchers Inspiration from previous scientific research often leads to breakthrough. Empirical vectors Scientific research. Experimentation allows scientists to test hypotheses and gather empirical evidence. Scientific research. Vector illustration. Education. Scientific research. Vector illustration. Education plays pivotal role in nurturing next generation scientific researchers Inspiration from previous scientific research often leads to breakthrough
Free with trial User design empirical website vector. friendly responsive, interactive innovative, sleek minimalistic user design empirical website web flat cartoon illustration. Empirical vectors User design empirical website vector. Friendly responsive, interactive innovative, sleek minimalistic user design empirical website web flat cartoon
Free with trial Interface empirical design website vector. experience research, data testing, optimization usability interface empirical design website character. people flat cartoon illustration. Empirical vectors Interface empirical design website vector. Experience research, data testing, optimization usability interface empirical design website character. people flat
Free with trial Interface design website empirical vector. research usability, testing analysis, user experience interface design website empirical web flat cartoon illustration. Empirical vectors Interface design website empirical vector. Research usability, testing analysis, user experience interface design website empirical web flat cartoon
Free with trial Black solid icon for Empirical, analysis, data, economy, presentation, statistics, stock, advertise and chart. Empirical vectors Black solid icon for Empirical, advertise and chart. Black solid icon for Empirical, analysis, data, economy, presentation, statistics, stock, advertise and. Black solid icon for Empirical, analysis, data, economy, presentation, statistics, stock, advertise and chart
Free with trial Experimental science outline icons collection. Hypothesis, Empirical, Variables, Control, Independent, Dependent. Empirical vectors Experimental science line icons collection. Hypothesis, Empirical, Variables, Control, Independent, Dependent. Experimental science outline icons collection. Experimental science outline icons collection. Hypothesis, Empirical, Variables, Control, Independent, Dependent
Free with trial Data research linear icons set. Analytics, Big data, Clustering, Correlation, Data mining, Descriptive, Empirical vector symbols and line concept signs. Experiment,Forecasting,Gathering illustration. Empirical vectors Data research linear icons set. Analytics, Big data, Clustering, Correlation, Data mining, Descriptive, Empirical line. Data research linear icons set. Analytics. Data research linear icons set. Analytics, Big data, Clustering, Correlation, Data mining, Descriptive, Empirical vector symbols and line concept signs. Experiment,Forecasting,Gathering illustration
Free with trial Data research linear icons set. Analytics, Big data, Clustering, Correlation, Data mining, Descriptive, Empirical vector symbols and line concept signs. Experiment,Forecasting,Gathering illustration. Empirical vectors Data research linear icons set. Analytics, Big data, Clustering, Correlation, Data mining, Descriptive, Empirical line. Data research linear icons set. Analytics. Data research linear icons set. Analytics, Big data, Clustering, Correlation, Data mining, Descriptive, Empirical vector symbols and line concept signs. Experiment,Forecasting,Gathering illustration
Free with trial Data research linear icons set. Analytics, Big data, Clustering, Correlation, Data mining, Descriptive, Empirical vector symbols and line concept signs. Experiment,Forecasting,Gathering illustration. Empirical vectors Data research linear icons set. Analytics, Big data, Clustering, Correlation, Data mining, Descriptive, Empirical line. Data research linear icons set. Analytics. Data research linear icons set. Analytics, Big data, Clustering, Correlation, Data mining, Descriptive, Empirical vector symbols and line concept signs. Experiment,Forecasting,Gathering illustration
Free with trial Statistics data measurement with results curved line tiny person concept. Scientific or mathematical information outcome collecting, interpreting and presenting from empirical data vector illustration. Empirical vectors Statistics data measurement with results curved line tiny person concept. Scientific or mathematical information outcome collecting, interpreting and
 Sign in