Free with trial The major arteries and pulse points of the head, arms and legs. Created in Adobe Illustrator. Major points vectors Major pulse points. The major arteries and pulse points of the head, arms and legs. Created in Adobe Illustrator. The major arteries and pulse points of the head, arms and legs. Created in Adobe Illustrator.
Free with trial Doppler probe measurement of pedal pulse, showing the major pedal pulse points with named arteries. Created in Adobe Illustrator. Contains transparencies. EPS 10. Major points vectors Doppler probe measurement of pedal pulse. Showing the major pedal pulse points with named arteries. Created in Adobe Illustrator. Contains transparencies. EPS
Free with trial The major arteries and pulse points on human body. Heartbeat evaluation. Placements. Cardiovascular system. Flat vector illustration. Major points vectors The major arteries and pulse points on human body. Heartbeat evaluation. Placements. Cardiovascular system. Flat vector illustration
Free with trial The major arteries and pulse points on human body vector illustration. Major points vectors The major arteries and pulse points on human body vector illustration.
Free with trial The group stage standings for FIFA World Cup 2026. It displays different teams, match results, and statistics for each group in the tournament held in North America. Major points vectors FIFA World Cup 2026 group stage standings chart with teams and match details from North America. The group stage standings for FIFA World Cup 2026. It displays. The group stage standings for FIFA World Cup 2026. It displays different teams, match results, and statistics for each group in the tournament held in North America.
Free with trial Inbound marketing flat isometric vector concept. People are trying to design a composition on the pc monitor that shows the major points of advertising strategy. Major points vectors Inbound marketing flat isometric vector concept. People are trying to design a composition on the pc monitor that shows the major points of advertising
Free with trial A detailed vector map of Nantucket island featuring major beaches, towns like Madaket and Siasconset, lighthouses, and coastal points. Decorated with colorful seashells and a classic compass rose. Major points vectors Illustrated Map of Nantucket Island with Landmarks Beaches and Coastal Details. A detailed vector map of Nantucket island featuring major beaches, towns like. A detailed vector map of Nantucket island featuring major beaches, towns like Madaket and Siasconset, lighthouses, and coastal points. Decorated with colorful seashells and a classic compass rose.
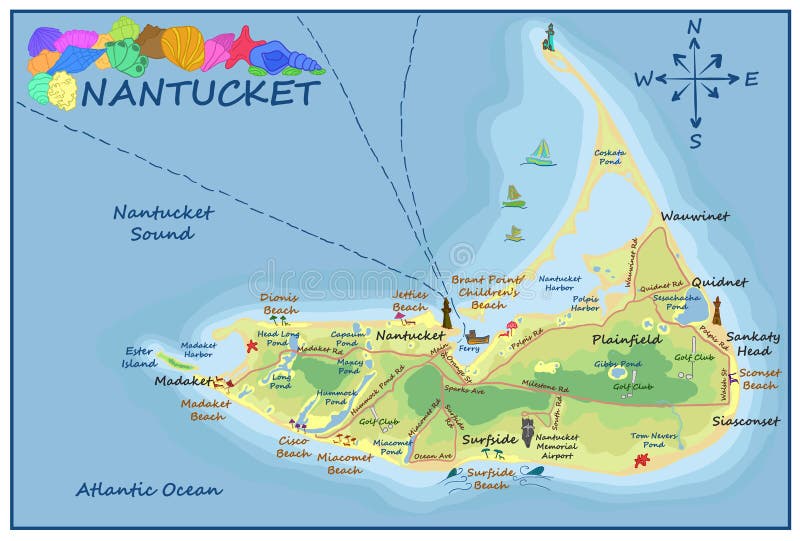
Free with trial A detailed vector map of Nantucket island featuring major beaches, towns like Madaket and Siasconset, lighthouses, and coastal points. Decorated with colorful seashells and a classic compass rose. Major points vectors Illustrated Map of Nantucket Island with Landmarks Beaches and Coastal Details. A detailed vector map of Nantucket island featuring major beaches, towns like. A detailed vector map of Nantucket island featuring major beaches, towns like Madaket and Siasconset, lighthouses, and coastal points. Decorated with colorful seashells and a classic compass rose.
Free with trial Key performance indicator flat isometric vector concept. Renders major KPI points as following objective, measurement, optimization, strategy, performance, evaluation. Major points vectors Key performance indicator flat isometric vector concept. Renders major KPI points as following objective, measurement, optimization, strategy, performance
Free with trial Key performance indicator flat isometric vector concept. Renders major KPI points as following objective, measurement, optimization, strategy, performance, evaluation. Major points vectors Key performance indicator flat isometric vector. Key performance indicator flat isometric vector concept. Renders major KPI points as following objective. Key performance indicator flat isometric vector concept. Renders major KPI points as following objective, measurement, optimization, strategy, performance, evaluation.
Free with trial Key performance indicator flat isometric vector landing page template. Renders major KPI points as following objective, measurement, optimization, strategy, performance, evaluation. Major points vectors Key performance indicator flat isometric vector landing page template. Renders major KPI points as following objective, measurement, optimization, strategy
Free with trial A specific vector icon showing the Big Dipper or Ursa Major constellation. Perfect for astronomy education, navigation, and celestial maps. Clear star points connected by lines, vector design Generative AI. Major points vectors Big Dipper Ursa Major Constellation, vector design Generative AI. A specific vector icon showing the Big Dipper or Ursa Major constellation. Perfect for. A specific vector icon showing the Big Dipper or Ursa Major constellation. Perfect for astronomy education, navigation, and celestial maps. Clear star points connected by lines, vector design Generative AI
Free with trial Mariana Trench ocean depth infographic. Illustrates depth in meters, with specific points like Challenger Deep (11,034m), Mount Everest (8,848m), and RMS Titanic (3,800m). Depictions of marine life, submarines, and light penetration at different depths. Environmental conditions such as temperature, pressure, and sea level analysis included. Contains a timeline of major explorations from 1930 to 2030. Various visual elements highlight comparisons between ocean features and known landmarks. Major points vectors The Mariana Trench high infographics. Mariana Trench ocean depth infographic. Illustrates depth in meters, with specific points like Challenger Deep (11,034m). Mariana Trench ocean depth infographic. Illustrates depth in meters, with specific points like Challenger Deep (11,034m), Mount Everest (8,848m), and RMS Titanic (3,800m). Depictions of marine life, submarines, and light penetration at different depths. Environmental conditions such as temperature, pressure, and sea level analysis included. Contains a timeline of major explorations from 1930 to 2030. Various visual elements highlight comparisons between ocean features and known landmarks.
Free with trial A gleaming golden star emblem signifies a major achievement. A bold arrow points upward, representing progress, promotion, and reaching the next level. Major points vectors Golden Star Rank Up Emblem. A gleaming golden star emblem signifies a major achievement. A bold arrow points upward, representing progress, promotion, and. A gleaming golden star emblem signifies a major achievement. A bold arrow points upward, representing progress, promotion, and reaching the next level
Free with trial A detailed vector illustration of a highway toll booth, symbolizing road travel, transportation infrastructure, and urban access points. Ideal for transportation authorities, mapping apps, or automotive services. Represents controlled access and payment systems on major roadways, vector design Generative AI. Major points vectors Highway Toll Booth and Road Travel Infrastructure, vector design Generative AI. A detailed vector illustration of a highway toll booth, symbolizing road travel. A detailed vector illustration of a highway toll booth, symbolizing road travel, transportation infrastructure, and urban access points. Ideal for transportation authorities, mapping apps, or automotive services. Represents controlled access and payment systems on major roadways, vector design Generative AI
Free with trial This minimalist colorful infographic map displays major North American host cities including Toronto Chicago New York Los Angeles and Mexico City connected by dashed routes. Major points vectors Hand-drawn North American map featuring major host cities across USA Canada and Mexico for international sports authentic. This minimalist colorful infographic. This minimalist colorful infographic map displays major North American host cities including Toronto Chicago New York Los Angeles and Mexico City connected by dashed routes
Free with trial A digital representation of Earth highlighting continents with glowing lines, suggesting data connectivity. The continents are outlined in red and illuminated, creating a network effect against a dark background. Light points scattered across the map denote major cities or data hubs, emphasizing global communication. The curvature of the Earth is visible, providing a sense of scale and perspective. The depiction implies advanced technological connections spanning North America, South America, Europe, Africa, Asia, and Australia. Major points vectors Global Digital Network Connecting the World with Data Connectivity. A digital representation of Earth highlighting continents with glowing lines, suggesting data. A digital representation of Earth highlighting continents with glowing lines, suggesting data connectivity. The continents are outlined in red and illuminated, creating a network effect against a dark background. Light points scattered across the map denote major cities or data hubs, emphasizing global communication. The curvature of the Earth is visible, providing a sense of scale and perspective. The depiction implies advanced technological connections spanning North America, South America, Europe, Africa, Asia, and Australia.
Free with trial A vibrant golden star signifies a major milestone achieved. The circular progress bar fills up, marking the accumulation of experience points and the exciting moment of leveling up. Major points vectors Gamification Progress Circle with Star Icon. A vibrant golden star signifies a major milestone achieved. The circular progress bar fills up, marking the. A vibrant golden star signifies a major milestone achieved. The circular progress bar fills up, marking the accumulation of experience points and the exciting moment of leveling up
Free with trial A three-dimensional world map is depicted with continents appearing as textured forms above a dark, cloudy surface. Bright points of light and connecting lines illuminate major population centers across the globe, creating a network effect. The color palette is primarily cool with warm accents. This image was generated with the use of an AI. Major points vectors World map with glowing connections, continents rise from a dark ocean illuminated by bright points of light. A three-dimensional world map is depicted with. A three-dimensional world map is depicted with continents appearing as textured forms above a dark, cloudy surface. Bright points of light and connecting lines illuminate major population centers across the globe, creating a network effect. The color palette is primarily cool with warm accents. This image was generated with the use of an AI
Free with trial Stylized world map on a blue background with prominent landmasses in a light color. Red cubes are placed at several locations on the map, possibly indicating key points for tracking or strategic locations. Major continents and countries are outlined, offering a clear view of global geography. The design conveys a modern, technological theme, potentially reflecting concepts like global connectivity or information tracking. Major points vectors Transparent Supply Chain Tracking Using Blockchain Technology. Stylized world map on a blue background with prominent landmasses in a light color. Red cubes are. Stylized world map on a blue background with prominent landmasses in a light color. Red cubes are placed at several locations on the map, possibly indicating key points for tracking or strategic locations. Major continents and countries are outlined, offering a clear view of global geography. The design conveys a modern, technological theme, potentially reflecting concepts like global connectivity or information tracking.
Free with trial An abstract vector illustration showing a pendulum swinging between two icy mountain peaks. This can symbolize balance, the passage of time, precision, or making a choice between two major points. A cool concept for logos and presentations. vector design Generative AI. Major points vectors Pendulum Swinging Between Two Mountain Peaks Vector Illustration, vector design Generative AI. An abstract vector illustration showing a pendulum swinging. An abstract vector illustration showing a pendulum swinging between two icy mountain peaks. This can symbolize balance, the passage of time, precision, or making a choice between two major points. A cool concept for logos and presentations. vector design Generative AI
Free with trial Key Performance Indicator Concept. Businessman Pointing Major Kpi Points to Colleagues Following Objective, Measurement Optimization, Strategy Performance Evaluation. flat vector modern illustration. Major points vectors Key Performance Indicator Concept. Businessman Pointing Major Kpi Points to Colleagues Following Objective. Key Performance Indicator Concept. Businessman. Key Performance Indicator Concept. Businessman Pointing Major Kpi Points to Colleagues Following Objective, Measurement Optimization, Strategy Performance Evaluation. flat vector modern illustration
Free with trial Constellation line icon. Star pattern linear vector illustration. Thin sign of connected celestial points beside sparkles for astronomy, zodiac, navigation, discovery, cosmos web pictogram. Major points vectors Constellation line icon. Star pattern linear vector illustration. Thin sign of connected celestial points beside sparkles for. Astronomy, zodiac, navigation. Constellation line icon. Star pattern linear vector illustration. Thin sign of connected celestial points beside sparkles for astronomy, zodiac, navigation, discovery, cosmos web pictogram
Free with trial Line chart titled "Performance Trend" with axes labeled "Value" and "Months. " The chart displays data points connected by a line, showing an upward trend from January to December. The vertical axis ranges from 0 to 100k, with major increments at 25k. Below the chart, text indicates a total revenue of $861,400 and highlights December as the peak month. The design is minimalistic, with a light blue and white color scheme. Major points vectors Performance Trend Revenue With Line Chart With Axis. Line chart titled 'Performance Trend' with axes labeled 'Value' and 'Months.' The chart displays data points. Line chart titled "Performance Trend" with axes labeled "Value" and "Months." The chart displays data points connected by a line, showing an upward trend from January to December. The vertical axis ranges from 0 to 100k, with major increments at 25k. Below the chart, text indicates a total revenue of $861,400 and highlights December as the peak month. The design is minimalistic, with a light blue and white color scheme.
Free with trial This image is a detailed map of Italy showcasing the country's geographical layout. The map includes various symbols and icons representing significant landmarks, cities, and regions. Notable symbols include buildings, mountains, and other points of interest distributed across the peninsula and surrounding islands. The map provides a comprehensive overview of Italy's diverse geography and cultural. Major points vectors Italian map highlighting major landmarks and regions. This image is a detailed map of Italy showcasing the country's geographical layout. The map includes. This image is a detailed map of Italy showcasing the country's geographical layout. The map includes various symbols and icons representing significant landmarks, cities, and regions. Notable symbols include buildings, mountains, and other points of interest distributed across the peninsula and surrounding islands. The map provides a comprehensive overview of Italy's diverse geography and cultural
Free with trial A conceptual infographic features a dark blue background with orange connecting lines between major North American cities including Vancouver New York Miami and Mexico City. Major points vectors Hand-drawn stylized map connecting Vancouver New York Miami and Mexico City with geometric lines representing host authentic. A conceptual infographic features a. A conceptual infographic features a dark blue background with orange connecting lines between major North American cities including Vancouver New York Miami and Mexico City
Free with trial This visualization depicts the intricate migration routes of various species across the globe. It highlights seasonal and year-round movements of avian, terrestrial mammal, and marine life populations, illustrating critical habitats and major convergence points. The glowing lines and icons on the wo. Major points vectors Global Animal Migration Pathways. This visualization depicts the intricate migration routes of various species across the globe. It highlights seasonal and year. This visualization depicts the intricate migration routes of various species across the globe. It highlights seasonal and year-round movements of avian, terrestrial mammal, and marine life populations, illustrating critical habitats and major convergence points. The glowing lines and icons on the wo
Free with trial A dark blue grid background featuring colorful circular data points marking major North American host cities like Toronto, New York, and Mexico City for events. Major points vectors Hand-drawn abstract data map visualization showing North American city locations for international sports tournament on dark. A dark blue grid background. A dark blue grid background featuring colorful circular data points marking major North American host cities like Toronto, New York, and Mexico City for events
Free with trial This visual map details the intricate plot of "The Chronicles of Aethel," outlining protagonist Elara's journey, antagonist Kaelen's schemes, major conflicts, plot twists, and the development of world-building and subplots across three acts. Major points vectors The Chronicles of Aethel: A Story Arc Diagram. This visual map details the intricate plot of 'The Chronicles of Aethel,' outlining protagonist Elara's journey. This visual map details the intricate plot of "The Chronicles of Aethel," outlining protagonist Elara's journey, antagonist Kaelen's schemes, major conflicts, plot twists, and the development of world-building and subplots across three acts.
Free with trial A professional vector map of North America featuring major cities across Canada, the United States, and Mexico. Includes location pins for Vancouver, Toronto, Seattle, Los Angeles, Kansas City, Dallas, Miami, Mexico City, and more. Modern flat design on a dark purple background, ideal for travel, logistics, or sports tournament host city visualizations. Major points vectors Map of North America Host Cities for sports event location concept. A professional vector map of North America featuring major cities across Canada, the United. A professional vector map of North America featuring major cities across Canada, the United States, and Mexico. Includes location pins for Vancouver, Toronto, Seattle, Los Angeles, Kansas City, Dallas, Miami, Mexico City, and more. Modern flat design on a dark purple background, ideal for travel, logistics, or sports tournament host city visualizations.
Free with trial Drone view showing layered transparent outlines of abstract land masses with connected routes through major points, creating a conceptual travel planning visual. Major points vectors Drone view with overlapping map outlines and routes. Drone view showing layered transparent outlines of abstract land masses with connected routes through major. Drone view showing layered transparent outlines of abstract land masses with connected routes through major points, creating a conceptual travel planning visual
Free with trial Infographic showing circular progress indicators at the top, representing data analysis stages. Below, a timeline tracks major explorations from 1930 to 2030. The lower section displays gauges for environmental conditions: temperature, pressure, and light. Temperature gauge ranges from 4°C to 25°C, pressure gauge and light meter depicted with arcs. Includes a bar graph with varying data points, all set against a dark background. Elements in blue and aqua tones convey a clean, futuristic design. Major points vectors Infofraphic or data analysis graph, meter, arrow, or circle analysis. Infographic showing circular progress indicators at the top, representing data analysis. Infographic showing circular progress indicators at the top, representing data analysis stages. Below, a timeline tracks major explorations from 1930 to 2030. The lower section displays gauges for environmental conditions: temperature, pressure, and light. Temperature gauge ranges from 4°C to 25°C, pressure gauge and light meter depicted with arcs. Includes a bar graph with varying data points, all set against a dark background. Elements in blue and aqua tones convey a clean, futuristic design.
Free with trial Top down urban cartography schematic featuring an intricate road network grid and specific orange location points. Vector illustration. Major points vectors Detailed Grey City Street Map Plan with Yellow Major Roads and Dots. Vector illustration. Top down urban cartography schematic featuring an intricate road. Top down urban cartography schematic featuring an intricate road network grid and specific orange location points. Vector illustration.
Free with trial Global Landmarks Centered on Navigation Point. A map highlighting major world landmarks and travel navigation markers situated around a globe. Major points vectors Global Landmarks Centered on Navigation Point. A map highlighting major world landmarks and travel navigation markers situated around a globe
Free with trial Colorful map of the Middle East and Central Asia, highlighting countries like Iran, Saudi Arabia, and India in various pastel shades. It shows borders and some major cities, with white dots indicating key locations. The map is simplified, lacking detailed geographical features, and focuses on the regional layout. Minimal text is present for city names. Major points vectors Middle East and South Asia Map – Colorful Regional Countries Illustration. Colorful map of the Middle East and Central Asia, highlighting countries like Iran. Colorful map of the Middle East and Central Asia, highlighting countries like Iran, Saudi Arabia, and India in various pastel shades. It shows borders and some major cities, with white dots indicating key locations. The map is simplified, lacking detailed geographical features, and focuses on the regional layout. Minimal text is present for city names.
Free with trial A versatile set of modern flat design icons isolated on a white background. This collection features various elements related to shopping, sales, and celebration, including gift boxes with ribbons, shopping bags, hearts, and stylized figures of people shopping. The prominent '11' symbol points to major sales events like Singles' Day (11. 11). With its clean lines and warm color palette, this vector illustration is perfect for e-commerce promotions, holiday marketing campaigns, website banners, social media graphics, and user interface design for retail applications. Major points vectors Modern Flat Icons for Shopping, Sales, and Celebration. A versatile set of modern flat design icons isolated on a white background. This collection features. A versatile set of modern flat design icons isolated on a white background. This collection features various elements related to shopping, sales, and celebration, including gift boxes with ribbons, shopping bags, hearts, and stylized figures of people shopping. The prominent '11' symbol points to major sales events like Singles' Day (11.11). With its clean lines and warm color palette, this vector illustration is perfect for e-commerce promotions, holiday marketing campaigns, website banners, social media graphics, and user interface design for retail applications.
Free with trial A scientist uses a holographic interface to visualize global bird migration patterns. The display shows real-time data on species tracked, data points collected, and altitude layers, along with current weather conditions impacting migratory routes. This advanced system monitors spring and fall route. Major points vectors Global Bird Migration Tracking System. A scientist uses a holographic interface to visualize global bird migration patterns. The display shows real-time data on. A scientist uses a holographic interface to visualize global bird migration patterns. The display shows real-time data on species tracked, data points collected, and altitude layers, along with current weather conditions impacting migratory routes. This advanced system monitors spring and fall route
Free with trial A vector arrow collection might include various types of arrows designed for different uses, all in a clean, scalable vector format. Here’s a description of the elements that could be included in such a collection:Straight Arrows: Simple, direct arrows pointing in various directions (up, down, left, right) for basic navigation or directional purposes. Curved Arrows: Arrows with smooth curves, which can indicate a turn, a cyclical process, or a return to a previous point. Double-Headed Arrows: Arrows with points at both ends, useful for representing relationships, connections, or bidirectional movement. Dashed or Dotted Arrows: Arrows with dashed or dotted lines, often used to indicate less direct paths, optional routes, or non-permanent connections. Circular Arrows: Arrows that form a circle or loop, symbolizing recycling, continuous processes, or repetition. Thick and Thin Arrows: Arrows with varying line thicknesses, allowing for emphasis or the depiction of major versus minor directions. Stylized Arrows: Arrows with decorative elements like gradients, shadows, or unique shapes, designed for more creative or artistic applications. Block Arrows: Solid, filled arrows with a bold appearance, useful for making a strong directional statement. This collection would offer versatility for designers, providing arrows suitable for use in infographics, user interfaces, diagrams, and other visual content. Major points vectors Vector arrows collection, road sign air arrow path direction. A vector arrow collection might include various types of arrows designed for different uses, all in. A vector arrow collection might include various types of arrows designed for different uses, all in a clean, scalable vector format. Here’s a description of the elements that could be included in such a collection:Straight Arrows: Simple, direct arrows pointing in various directions (up, down, left, right) for basic navigation or directional purposes.Curved Arrows: Arrows with smooth curves, which can indicate a turn, a cyclical process, or a return to a previous point.Double-Headed Arrows: Arrows with points at both ends, useful for representing relationships, connections, or bidirectional movement.Dashed or Dotted Arrows: Arrows with dashed or dotted lines, often used to indicate less direct paths, optional routes, or non-permanent connections.Circular Arrows: Arrows that form a circle or loop, symbolizing recycling, continuous processes, or repetition.Thick and Thin Arrows: Arrows with varying line thicknesses, allowing for emphasis or the depiction of major versus minor directions.Stylized Arrows: Arrows with decorative elements like gradients, shadows, or unique shapes, designed for more creative or artistic applications.Block Arrows: Solid, filled arrows with a bold appearance, useful for making a strong directional statement.This collection would offer versatility for designers, providing arrows suitable for use in infographics, user interfaces, diagrams, and other visual content.
Free with trial A cartoon-style featuring a female doctor with brown hair tied in a bun, wearing a white medical coat, blue scrubs, and a stethoscope around her neck with an ID badge. She points toward a blue human body silhouette displaying orange highlighted dots at major joints including shoulders, elbows, wrists, hips, knees, and ankles. Red X marks indicate pain areas on the shoulder and both knees, with arrows radiating outward to suggest inflammation or discomfort. Ideal for medical websites, healthcare articles, rheumatology content, arthritis awareness campaigns, physiotherapy services, and patient education materials. Major points vectors Female doctor explaining human joint pain diagram. A cartoon-style featuring a female doctor with brown hair tied in a bun, wearing a white medical coat, blue. A cartoon-style featuring a female doctor with brown hair tied in a bun, wearing a white medical coat, blue scrubs, and a stethoscope around her neck with an ID badge. She points toward a blue human body silhouette displaying orange highlighted dots at major joints including shoulders, elbows, wrists, hips, knees, and ankles. Red X marks indicate pain areas on the shoulder and both knees, with arrows radiating outward to suggest inflammation or discomfort. Ideal for medical websites, healthcare articles, rheumatology content, arthritis awareness campaigns, physiotherapy services, and patient education materials.
Free with trial This is a stylized illustration of a world map with interconnected flight paths and airplane icons. The map highlights major continents and countries, with dashed lines indicating air routes connecting various points. Small airplane graphics are strategically placed along these routes, symbolizing air travel and global connectivity. The clean, minimalist design makes it suitable for representing concepts like international business, tourism, logistics, and global transportation. Major points vectors Global Air Travel Network Map with Airplane Routes. This is a stylized illustration of a world map with interconnected flight paths and airplane icons. The map. This is a stylized illustration of a world map with interconnected flight paths and airplane icons. The map highlights major continents and countries, with dashed lines indicating air routes connecting various points. Small airplane graphics are strategically placed along these routes, symbolizing air travel and global connectivity. The clean, minimalist design makes it suitable for representing concepts like international business, tourism, logistics, and global transportation.
Free with trial How to find ellipse focuses. Vector illustration. Major points vectors How to find ellipse focuses. Vector illustration
Free with trial Illuminated world map on a dark background, featuring interconnected lines representing global financial markets. Light points highlight major cities, indicating data flow across continents. The map is overlaid with abstract data elements like graphs and charts, symbolizing economic activity and connectivity. The digital style emphasizes a high-tech, interconnected global network. Major points vectors Global financial market concept with illuminated world map connected by glowing data. Illuminated world map on a dark background, featuring interconnected lines. Illuminated world map on a dark background, featuring interconnected lines representing global financial markets. Light points highlight major cities, indicating data flow across continents. The map is overlaid with abstract data elements like graphs and charts, symbolizing economic activity and connectivity. The digital style emphasizes a high-tech, interconnected global network.
Free with trial Illuminated world map on a dark background, featuring interconnected lines representing global financial markets. Light points highlight major cities, indicating data flow across continents. The map is overlaid with abstract data elements like graphs and charts, symbolizing economic activity and connectivity. The digital style emphasizes a high-tech, interconnected global network. Major points vectors Global financial market concept with illuminated world map connected by glowing data. Illuminated world map on a dark background, featuring interconnected lines. Illuminated world map on a dark background, featuring interconnected lines representing global financial markets. Light points highlight major cities, indicating data flow across continents. The map is overlaid with abstract data elements like graphs and charts, symbolizing economic activity and connectivity. The digital style emphasizes a high-tech, interconnected global network.
Free with trial A vector arrow collection might include various types of arrows designed for different uses, all in a clean, scalable vector format. Here’s a description of the elements that could be included in such a collection:Straight Arrows: Simple, direct arrows pointing in various directions (up, down, left, right) for basic navigation or directional purposes. Curved Arrows: Arrows with smooth curves, which can indicate a turn, a cyclical process, or a return to a previous point. Double-Headed Arrows: Arrows with points at both ends, useful for representing relationships, connections, or bidirectional movement. Dashed or Dotted Arrows: Arrows with dashed or dotted lines, often used to indicate less direct paths, optional routes, or non-permanent connections. Circular Arrows: Arrows that form a circle or loop, symbolizing recycling, continuous processes, or repetition. Thick and Thin Arrows: Arrows with varying line thicknesses, allow for emphasis or the depiction of major versus minor directions. Stylized Arrows: Arrows with decorative elements like gradients, shadows, or unique shapes, designed for more creative or artistic applications. Block Arrows: Solid, filled arrows with a bold appearance, useful for making a strong directional statement. This collection would offer versatility for designers, providing arrows suitable for use in infographics, user interfaces, diagrams, and other visual content. Major points vectors Arrow Icon, Road directions symbol vector illustration. A vector arrow collection might include various types of arrows designed for different uses, all in a. A vector arrow collection might include various types of arrows designed for different uses, all in a clean, scalable vector format. Here’s a description of the elements that could be included in such a collection:Straight Arrows: Simple, direct arrows pointing in various directions (up, down, left, right) for basic navigation or directional purposes.Curved Arrows: Arrows with smooth curves, which can indicate a turn, a cyclical process, or a return to a previous point.Double-Headed Arrows: Arrows with points at both ends, useful for representing relationships, connections, or bidirectional movement.Dashed or Dotted Arrows: Arrows with dashed or dotted lines, often used to indicate less direct paths, optional routes, or non-permanent connections.Circular Arrows: Arrows that form a circle or loop, symbolizing recycling, continuous processes, or repetition.Thick and Thin Arrows: Arrows with varying line thicknesses, allow for emphasis or the depiction of major versus minor directions.Stylized Arrows: Arrows with decorative elements like gradients, shadows, or unique shapes, designed for more creative or artistic applications.Block Arrows: Solid, filled arrows with a bold appearance, useful for making a strong directional statement.This collection would offer versatility for designers, providing arrows suitable for use in infographics, user interfaces, diagrams, and other visual content.
Free with trial The image displays a world map overlaid with numerous flight paths represented by thin lines. These lines converge and diverge, illustrating the complex network of global air travel routes. The map highlights major hubs where flight paths intersect, emphasizing the interconnected nature of international aviation and key transit points across continents. Major points vectors Flight routes mapping the intricate web of global air travel. The image displays a world map overlaid with numerous flight paths represented by thin lines. These. The image displays a world map overlaid with numerous flight paths represented by thin lines. These lines converge and diverge, illustrating the complex network of global air travel routes. The map highlights major hubs where flight paths intersect, emphasizing the interconnected nature of international aviation and key transit points across continents
Free with trial This image features a stylized world map design highlighting international connectivity and logistics networks with various location markers. Blue pins with icons representing travel, shipping, and data points connect major cities like New York, London, Tokyo, and Dubai via glowing lines. The composition uses a low-poly geographic background in shades of gray and teal, conveying a sense of modern technology, global trade, and digital communication across continents. Major points vectors World map illustrating global connectivity and logistics network with travel routes with Blue pins icons representing travel. This image features a stylized. This image features a stylized world map design highlighting international connectivity and logistics networks with various location markers. Blue pins with icons representing travel, shipping, and data points connect major cities like New York, London, Tokyo, and Dubai via glowing lines. The composition uses a low-poly geographic background in shades of gray and teal, conveying a sense of modern technology, global trade, and digital communication across continents
Free with trial Ellipse compass vector illustration isolated. On white. Major points vectors Ellipse compass vector illustration isolated. On white
Free with trial Key Performance Indicator Concept. Businessman Pointing Major Kpi Points to Colleagues Following Objective, Measurement Optimization, Strategy Performance Evaluation Cartoon Flat Vector Illustration. Major points vectors Key Performance Indicator Concept. Businessman Pointing Major Kpi Points to Colleagues Following Objective. Measurement Optimization, Strategy Performance. Key Performance Indicator Concept. Businessman Pointing Major Kpi Points to Colleagues Following Objective, Measurement Optimization, Strategy Performance Evaluation Cartoon Flat Vector Illustration
Free with trial Key Performance Indicator Concept. Businessman Pointing Major Kpi Points to Colleagues Following Objective. flat vector modern illustration. Major points vectors Key Performance Indicator Concept. Businessman Pointing Major Kpi Points to Colleagues Following Objective. Flat vector modern illustration
Free with trial Supinator trigger points vector diagram editable. An editable Supinator trigger points vector diagram, you can edit it in any vector software. Major points vectors Supinator trigger points vector diagram editable. An editable Supinator trigger points vector diagram, you can edit it in any vector software
Free with trial Halftone car crash icon, and bicolor grunge Major Incident seal stamp. Halftone car crash icon is made with small round dots. Vector seal with grunge bicolored style,. Major points vectors Halftone Car Crash Icon and Textured Bicolor Major Incident Watermark. Halftone car crash icon, and bicolor grunge Major Incident seal stamp. Halftone car crash. Halftone car crash icon, and bicolor grunge Major Incident seal stamp. Halftone car crash icon is made with small round dots. Vector seal with grunge bicolored style,
Free with trial Key Performance Indicator Website Landing Page. Businessman Pointing Kpi Points, Objective, Measurement Optimization, Strategy Performance Evaluation Web Page Banner. Cartoon Flat Vector Illustration. Major points vectors Key Performance Indicator Website Landing Page. Businessman Pointing Kpi Points, Objective, Measurement Optimization. Strategy Performance Evaluation Web Page. Key Performance Indicator Website Landing Page. Businessman Pointing Kpi Points, Objective, Measurement Optimization, Strategy Performance Evaluation Web Page Banner. Cartoon Flat Vector Illustration
Free with trial Funny head chicken boy color. Cartoon farm feathered character grimaces. The head of a funny tough rooster. Vector. The hen house hero. Chicken coop hero! Major. Major points vectors Funny head chicken boy color. Cartoon farm feathered character grimaces. The head of a funny tough rooster. Vector. The hen house hero. Chicken coop hero! Major
Free with trial Funny head chicken boy. Cartoon farm feathered character grimaces. The head of a funny tough rooster. Vector. The hen house hero. Chicken coop hero! Major. Major points vectors Funny head chicken boy. Cartoon farm feathered character grimaces. The head of a funny tough rooster. Vector. The hen house hero. Chicken coop hero! Major
Free with trial A vector high-quality editable vector diagram, you can edit it with any vector software. Major points vectors Semispinalis Capitis Trigger Point Diagram. A vector high-quality editable vector diagram, you can edit it with any vector software. A vector high-quality editable vector diagram, you can edit it with any vector software.
Free with trial Key performance indicator flat isometric vector concept. Renders major KPI points as following objective, measurement, optimization, strategy, performance, evaluation. Major points vectors KPI flat isometric vector concept. Key performance indicator flat isometric vector concept. Renders major KPI points as following objective, measurement. Key performance indicator flat isometric vector concept. Renders major KPI points as following objective, measurement, optimization, strategy, performance, evaluation.
Free with trial A vector high-quality editable vector diagram, you can edit it with any vector software. Major points vectors Levator Scapulae Trigger Point Diagram, Trigger Point Diagrams. A vector high-quality editable vector diagram, you can edit it with any vector software. A vector high-quality editable vector diagram, you can edit it with any vector software.
Free with trial 3D Isometric Flat Vector Concept of Key Performance Indicator, Shows Major KPI Points as Objective, Measurement, Optimization, Strategy, Performance, Evaluation. Major points vectors 3D Isometric Flat Vector Concept of Key Performance Indicator. 3D Isometric Flat Vector Concept of Key Performance Indicator, Shows Major KPI Points as. 3D Isometric Flat Vector Concept of Key Performance Indicator, Shows Major KPI Points as Objective, Measurement, Optimization, Strategy, Performance, Evaluation.
Free with trial 3D Vector Conceptual Illustration of Key Performance Indicators, Shows Major KPI Points as Objective, Measurement, Optimization, Strategy, Performance, Evaluation. Major points vectors 3D Vector Conceptual Illustration of Key Performance Indicators,. 3D Vector Conceptual Illustration of Key Performance Indicators, Shows Major KPI Points as. 3D Vector Conceptual Illustration of Key Performance Indicators, Shows Major KPI Points as Objective, Measurement, Optimization, Strategy, Performance, Evaluation.
Free with trial Cartoon farmer feathered character. Heads of funny cool colored roosters. Vector. Cock-fights. Conceptual. Cockscomb clash. Tet-a-tet. Major points vectors Funny head chicken boy color 2. Cartoon farmer feathered character. Heads of funny cool colored roosters. Vector. Cock-fights. Conceptual. Cockscomb clash. Tet-a. Cartoon farmer feathered character. Heads of funny cool colored roosters. Vector. Cock-fights. Conceptual. Cockscomb clash. Tet-a-tet
Free with trial Funny head chicken boy 2. Cartoon farmer feathered character. Heads of funny cool colored roosters. Vector. Cock-fights. Conceptual. Cockscomb clash. Tet-a-tet. Major points vectors Funny head chicken boy 2. Cartoon farmer feathered character. Heads of funny cool colored roosters. Vector. Cock-fights. Conceptual. Cockscomb clash. Tet-a-tet
Free with trial Ghor, province of Afghanistan. Elevation map colored in wiki style with lakes and rivers. Locations and names of major cities of the region. Corner auxiliary location maps. Major points vectors Ghor, Afghanistan. Wiki. Labelled points of cities. Ghor, province of Afghanistan. Elevation map colored in wiki style with lakes and rivers. Locations and names. Ghor, province of Afghanistan. Elevation map colored in wiki style with lakes and rivers. Locations and names of major cities of the region. Corner auxiliary location maps
Free with trial Ghor, province of Afghanistan. Solid color shape. Locations and names of major cities of the region. Corner auxiliary location maps. Major points vectors Ghor, Afghanistan. Solid. Labelled points of cities. Ghor, province of Afghanistan. Solid color shape. Locations and names of major cities of the region. Corner. Ghor, province of Afghanistan. Solid color shape. Locations and names of major cities of the region. Corner auxiliary location maps
Free with trial Ghor, province of Afghanistan. Elevation map colored in sepia tones with lakes and rivers. Locations and names of major cities of the region. Corner auxiliary location maps. Major points vectors Ghor, Afghanistan. Sepia. Labelled points of cities. Ghor, province of Afghanistan. Elevation map colored in sepia tones with lakes and rivers. Locations and. Ghor, province of Afghanistan. Elevation map colored in sepia tones with lakes and rivers. Locations and names of major cities of the region. Corner auxiliary location maps
Free with trial Logar, province of Afghanistan. Elevation map colored in wiki style with lakes and rivers. Locations and names of major cities of the region. Corner auxiliary location maps. Major points vectors Logar, Afghanistan. Wiki. Labelled points of cities. Logar, province of Afghanistan. Elevation map colored in wiki style with lakes and rivers. Locations and. Logar, province of Afghanistan. Elevation map colored in wiki style with lakes and rivers. Locations and names of major cities of the region. Corner auxiliary location maps
Free with trial Khost, province of Afghanistan. Elevation map colored in wiki style with lakes and rivers. Locations and names of major cities of the region. Corner auxiliary location maps. Major points vectors Khost, Afghanistan. Wiki. Labelled points of cities. Khost, province of Afghanistan. Elevation map colored in wiki style with lakes and rivers. Locations and. Khost, province of Afghanistan. Elevation map colored in wiki style with lakes and rivers. Locations and names of major cities of the region. Corner auxiliary location maps
Free with trial Kunar, province of Afghanistan. Elevation map colored in wiki style with lakes and rivers. Locations and names of major cities of the region. Corner auxiliary location maps. Major points vectors Kunar, Afghanistan. Wiki. Labelled points of cities. Kunar, province of Afghanistan. Elevation map colored in wiki style with lakes and rivers. Locations and. Kunar, province of Afghanistan. Elevation map colored in wiki style with lakes and rivers. Locations and names of major cities of the region. Corner auxiliary location maps
Free with trial Hirat, province of Afghanistan. Elevation map colored in wiki style with lakes and rivers. Locations and names of major cities of the region. Corner auxiliary location maps. Major points vectors Hirat, Afghanistan. Wiki. Labelled points of cities. Hirat, province of Afghanistan. Elevation map colored in wiki style with lakes and rivers. Locations and. Hirat, province of Afghanistan. Elevation map colored in wiki style with lakes and rivers. Locations and names of major cities of the region. Corner auxiliary location maps
Free with trial Zabul, province of Afghanistan. Elevation map colored in wiki style with lakes and rivers. Locations and names of major cities of the region. Corner auxiliary location maps. Major points vectors Zabul, Afghanistan. Wiki. Labelled points of cities. Zabul, province of Afghanistan. Elevation map colored in wiki style with lakes and rivers. Locations and. Zabul, province of Afghanistan. Elevation map colored in wiki style with lakes and rivers. Locations and names of major cities of the region. Corner auxiliary location maps
Free with trial Farah, province of Afghanistan. Elevation map colored in wiki style with lakes and rivers. Locations and names of major cities of the region. Corner auxiliary location maps. Major points vectors Farah, Afghanistan. Wiki. Labelled points of cities. Farah, province of Afghanistan. Elevation map colored in wiki style with lakes and rivers. Locations and. Farah, province of Afghanistan. Elevation map colored in wiki style with lakes and rivers. Locations and names of major cities of the region. Corner auxiliary location maps
Free with trial Kabul, province of Afghanistan. Elevation map colored in wiki style with lakes and rivers. Locations and names of major cities of the region. Corner auxiliary location maps. Major points vectors Kabul, Afghanistan. Wiki. Labelled points of cities. Kabul, province of Afghanistan. Elevation map colored in wiki style with lakes and rivers. Locations and. Kabul, province of Afghanistan. Elevation map colored in wiki style with lakes and rivers. Locations and names of major cities of the region. Corner auxiliary location maps
Free with trial Logar, province of Afghanistan. Elevation map colored in sepia tones with lakes and rivers. Locations and names of major cities of the region. Corner auxiliary location maps. Major points vectors Logar, Afghanistan. Sepia. Labelled points of cities. Logar, province of Afghanistan. Elevation map colored in sepia tones with lakes and rivers. Locations and. Logar, province of Afghanistan. Elevation map colored in sepia tones with lakes and rivers. Locations and names of major cities of the region. Corner auxiliary location maps
Free with trial Khost, province of Afghanistan. Solid color shape. Locations and names of major cities of the region. Corner auxiliary location maps. Major points vectors Khost, Afghanistan. Solid. Labelled points of cities. Khost, province of Afghanistan. Solid color shape. Locations and names of major cities of the region. Khost, province of Afghanistan. Solid color shape. Locations and names of major cities of the region. Corner auxiliary location maps
 Sign in