Free with trial An detailed line icon of a scatter plot chart mapping data points. Plot vectors Line icon representing scatter plot statistical chart graph points. An ai generated detailed line icon of a scatter plot chart mapping data points. An detailed line icon of a scatter plot chart mapping data points
Free with trial Plot of land icon in isometry style. Real estate image for website, app, logo, UI design. Line art illustration. Plot vectors Plot of land icon in isometry style. Real estate image for website, app, logo, UI design. Line art illustration
Free with trial A charming vector illustration of people tending a community garden plot. Ideal for themes of sustainability, healthy eating, community, or urban farming. Perfect for environmental organizations, local initiatives, or educational materials about agriculture, vector design Generative AI. Plot vectors People Gardening Community Plot Vector Illustration, vector design Generative AI. A charming vector illustration of people tending a community garden plot. Ideal. A charming vector illustration of people tending a community garden plot. Ideal for themes of sustainability, healthy eating, community, or urban farming. Perfect for environmental organizations, local initiatives, or educational materials about agriculture, vector design Generative AI
Free with trial Icon of a data analysis window with a scatter plot and trend curve, symbolizing regression modeling, machine learning, and data visualization. Vector clipart with thin lines, editable line thickness. Plot vectors Icon of a data analysis window with a scatter plot and trend curve. Symbolizing regression modeling, machine learning, and data visualization. Vector clipart. Icon of a data analysis window with a scatter plot and trend curve, symbolizing regression modeling, machine learning, and data visualization. Vector clipart with thin lines, editable line thickness
Free with trial Box plot chart icon in a solid black glyph style, a clean symbol related to statistics, distribution and data visualization, charts and analytics, suitable for websites, mobile apps, presentations, dashboards, infographics and business design projects. Plot vectors Box plot chart icon, black glyph for data visualization and analytics. Box plot chart icon in a solid black glyph style, a clean symbol related to statistics. Box plot chart icon in a solid black glyph style, a clean symbol related to statistics, distribution and data visualization, charts and analytics, suitable for websites, mobile apps, presentations, dashboards, infographics and business design projects
Free with trial Black business chart icon showing bar graph line plot and pie chart symbol. Minimalist black icon featuring bar graph line plot and pie chart. Plot vectors Black business chart icon showing bar graph line plot and pie chart symbol. Minimalist black icon featuring bar graph line plot and pie chart
Free with trial Stylish black and white calligraphy text saying plot twist i need a treat surrounded by cupcakes hearts and decorative swirls on white background playful design. Generative AI. Plot vectors Hand drawn calligraphy lettering plot twist i need a treat with cupcake icons and decorative hearts and swirls vector art design. Stylish black and white. Stylish black and white calligraphy text saying plot twist i need a treat surrounded by cupcakes hearts and decorative swirls on white background playful design. Generative AI
Free with trial 3d scatter plot icon in a solid black glyph style, a clean symbol related to 3d graph, axes and data visualization, charts and analytics, suitable for websites, mobile apps, presentations, dashboards, infographics and business design projects. Plot vectors 3d scatter plot icon, black glyph for data visualization and analytics. 3d scatter plot icon in a solid black glyph style, a clean symbol related to 3d graph. 3d scatter plot icon in a solid black glyph style, a clean symbol related to 3d graph, axes and data visualization, charts and analytics, suitable for websites, mobile apps, presentations, dashboards, infographics and business design projects
Free with trial Black and white vector art featuring the phrase reading is my plot with an open book, surrounded by stars and swirling decorative elements in a bold style. Generative AI. Plot vectors Reading is my plot open book with stars and swirls black and white vector art. Black and white vector art featuring the phrase reading is my plot with an open. Black and white vector art featuring the phrase reading is my plot with an open book, surrounded by stars and swirling decorative elements in a bold style. Generative AI
Free with trial Detailed line art icon showing scatter plot coordinate graph with data cluster points. Plot vectors Statistical scatter plot chart graph with X and Y axes data points icon. AI generated detailed line art icon showing scatter plot coordinate graph with data. detailed line art icon showing scatter plot coordinate graph with data cluster points
Free with trial Property blueprint plot diagram with house outline and land measurement. AI generated detailed line icon of house plot diagram blueprint on white background. Plot vectors Property blueprint plot diagram with house outline and land measurement. AI generated detailed line icon of house plot diagram blueprint on white background
Free with trial A delightful vector illustration of home gardening bliss, depicting a person cultivating fresh produce in a cozy backyard plot near a charming house. Ideal for gardening blogs, healthy lifestyle promotions, or designs celebrating sustainable living and the joy of homegrown food. High-quality graphic for inspiring green thumbs. vector design Generative AI. Plot vectors Home Gardening Bliss: Cultivating Fresh Produce in a Cozy Backyard Plot, vector design Generative AI. A delightful vector illustration of home gardening bliss. A delightful vector illustration of home gardening bliss, depicting a person cultivating fresh produce in a cozy backyard plot near a charming house. Ideal for gardening blogs, healthy lifestyle promotions, or designs celebrating sustainable living and the joy of homegrown food. High-quality graphic for inspiring green thumbs. vector design Generative AI
Free with trial This image was created using Generative AI. A scatter plot graph with blue dots and a regression line on a white background, used for data analysis and visualization in statistics and business. Plot vectors Scatter plot graph with blue dots and regression line on white background. This image was created using Generative AI. A scatter plot graph with blue dots and a. This image was created using Generative AI. A scatter plot graph with blue dots and a regression line on a white background, used for data analysis and visualization in statistics and business
Free with trial Detailed line icon depicting grid scatter plot graph with connected node points for data analytics and research. Plot vectors Data analytics scatter plot grid graph line icon for statistical research. Detailed AI generated line icon depicting grid scatter plot graph with connected node. Detailed line icon depicting grid scatter plot graph with connected node points for data analytics and research
Free with trial Detailed line art icon depicting X-Y axis scatter plot chart with trend line. Plot vectors Statistical scatter plot graph line icon showing data distribution points. Detailed AI generated line art icon depicting X-Y axis scatter plot chart with trend. Detailed line art icon depicting X-Y axis scatter plot chart with trend line
Free with trial An icon representing land plot maps for planning. Plot vectors Land Plot Map Icon for Planning. An icon representing land plot maps for planning. An icon representing land plot maps for planning.
Free with trial Detailed line icon representing four quadrant scatter plot chart with coordinate arrows and data points. Plot vectors Data matrix scatter plot chart icon with directional axis arrows and plot dots. AI generated detailed line icon representing four quadrant scatter plot chart. detailed line icon representing four quadrant scatter plot chart with coordinate arrows and data points
Free with trial Vector icon with FT2 sign representing area in square feet. Outline symbol for land plot, property floor plan, or home. Room size. Vector illustration. Plot vectors Vector icon with FT2 sign representing area in square feet. Outline symbol for land plot, property floor plan, or home. Room size. Vector illustration
Free with trial Vector icons for data analysis, business intelligence, and market research, featuring network, bar chart, column chart, line chart, pie chart, and scatter plot symbols on a clean white background. Plot vectors Data Visualization Icons Set Network Bar Chart Column Chart Line Chart Pie Chart Scatter Plot. Vector icons for data analysis, business intelligence, and market. Vector icons for data analysis, business intelligence, and market research, featuring network, bar chart, column chart, line chart, pie chart, and scatter plot symbols on a clean white background.
Free with trial A vibrant vector illustration of two individuals tending to a garden plot, surrounded by plants. This imagery captures the essence of horticulture, sustainable living, and community gardening. Perfect for educational materials about plants, eco-friendly initiatives, or websites promoting home gardening and healthy food cultivation, vector design Generative AI. Plot vectors People Cultivating a Garden Plot Vector Illustration, vector design Generative AI. A vibrant vector illustration of two individuals tending to a garden plot. A vibrant vector illustration of two individuals tending to a garden plot, surrounded by plants. This imagery captures the essence of horticulture, sustainable living, and community gardening. Perfect for educational materials about plants, eco-friendly initiatives, or websites promoting home gardening and healthy food cultivation, vector design Generative AI
Free with trial Golden corn juicy tomatoes and colorful bell peppers overflow from a basket on a community garden plot showcasing the. Abundance of affordable AI generated. Plot vectors Golden corn juicy tomatoes and colorful bell peppers overflow from a basket on a community garden plot showcasing the. Abundance of affordable AI generated
Free with trial An innovative scatter plot illustration showcasing statistical insights. Plot vectors Innovative Scatter Plot Illustration. An innovative scatter plot illustration showcasing statistical insights. An innovative scatter plot illustration showcasing statistical insights.
Free with trial Scatter plot trendline icon in a solid black glyph style, a clean symbol related to regression, correlation and data visualization, charts and analytics, suitable for websites, mobile apps, presentations, dashboards, infographics and business design projects. Plot vectors Scatter plot trendline icon, black glyph for data visualization and analytics. Scatter plot trendline icon in a solid black glyph style, a clean symbol related. Scatter plot trendline icon in a solid black glyph style, a clean symbol related to regression, correlation and data visualization, charts and analytics, suitable for websites, mobile apps, presentations, dashboards, infographics and business design projects
Free with trial This image depicts an elderly couple working together in a community garden plot on a sunny day. The couple is shown kneeling in the garden, with the man holding a plant and the woman holding a shovel. They are surrounded by various plants, flowers, and vegetables, and a sign in the background reads 'Community Garden'. The image conveys a sense of teamwork, partnership, and recreation, highlighting the importance of gardening as a hobby and outdoor activity for senior citizens and older adults. Plot vectors An elderly couple gardening together in a community garden plot on a sunny day. This image depicts an elderly couple working together in a community garden plot. This image depicts an elderly couple working together in a community garden plot on a sunny day. The couple is shown kneeling in the garden, with the man holding a plant and the woman holding a shovel. They are surrounded by various plants, flowers, and vegetables, and a sign in the background reads 'Community Garden'. The image conveys a sense of teamwork, partnership, and recreation, highlighting the importance of gardening as a hobby and outdoor activity for senior citizens and older adults.
Free with trial A group of children are working together in a community garden plot, growing and harvesting a variety of fresh produce. The garden is filled with tomato plants, carrot plants, and lettuce plants, and the children are using gardening tools to tend to the crops. A sign in the garden reads 'Community Garden' and the children are all smiling and having fun as they work together to grow their own food. This image represents the importance of community gardens and the role they play in teaching children about gardening, healthy eating, and sustainability. Plot vectors Children are growing and harvesting fresh produce in a community garden plot. A group of children are working together in a community garden plot, growing and. A group of children are working together in a community garden plot, growing and harvesting a variety of fresh produce. The garden is filled with tomato plants, carrot plants, and lettuce plants, and the children are using gardening tools to tend to the crops. A sign in the garden reads 'Community Garden' and the children are all smiling and having fun as they work together to grow their own food. This image represents the importance of community gardens and the role they play in teaching children about gardening, healthy eating, and sustainability.
Free with trial Detailed of chain link perimeter fence enclosing land plot with tree for property defense. Plot vectors Chain link perimeter fence enclosing land plot with tree for property defense. Detailed AI generated of chain link perimeter fence enclosing land plot with tree. Detailed of chain link perimeter fence enclosing land plot with tree for property defense
Free with trial Isometric landscape with sun, pond, bushes and grass - round plot with water and greenery. AI generated. Plot vectors Isometric landscape with sun, pond, bushes and grass - round plot with water and greenery. AI generated
Free with trial An advanced icon illustrating land plot maps. Plot vectors Advanced Land Plot Map Icon Design. An advanced icon illustrating land plot maps. An advanced icon illustrating land plot maps.
Free with trial A delightful vector illustration of gardeners tending to a lush community plot, planting and cultivating fresh produce. This scene promotes sustainable living, local food, and active outdoor lifestyles. Ideal for gardening blogs, eco-friendly campaigns, farmer's markets, or educational content, highlighting healthy eating and community engagement in nature, vector design Generative AI. Plot vectors Gardeners Cultivating a Lush Community Plot, Sustainable Living, Fresh Produce, vector design Generative AI. A delightful vector illustration of gardeners. A delightful vector illustration of gardeners tending to a lush community plot, planting and cultivating fresh produce. This scene promotes sustainable living, local food, and active outdoor lifestyles. Ideal for gardening blogs, eco-friendly campaigns, farmer's markets, or educational content, highlighting healthy eating and community engagement in nature, vector design Generative AI
Free with trial A box and whisker plot depicting the distribution of age groups a international tourists in a specific country.. Vector. Illustration AI generated. Plot vectors A box and whisker plot depicting the distribution of age groups a international tourists in a specific country.. Vector. Illustration AI generated
Free with trial Vector scatter plot of five colored data clusters with grid and axes on dark navy, a machine learning and cluster analysis visual. Labels replaced by placeholder bars. No text. Generated with AI (generative AI. Plot vectors Cluster analysis scatter plot with five colored groups on dark navy, data science. Vector scatter plot of five colored data clusters with grid and axes on dark. Vector scatter plot of five colored data clusters with grid and axes on dark navy, a machine learning and cluster analysis visual. Labels replaced by placeholder bars. No text. Generated with AI (generative AI
Free with trial An illustration depicting a rectangular garden plot laid out with geometric sections, featuring flowers, stepping stones, and possibly other garden elements. Represents gardening, landscaping, or outdoor hobbies vector design Generative AI. Plot vectors Garden plot with flowers and stones gardening concept vector design Generative AI. An illustration depicting a rectangular garden plot laid out with geometric. An illustration depicting a rectangular garden plot laid out with geometric sections, featuring flowers, stepping stones, and possibly other garden elements. Represents gardening, landscaping, or outdoor hobbies vector design Generative AI
Free with trial Data points plot machine learning color icon vector. data points plot machine learning sign. isolated symbol illustration. Plot vectors Data points plot machine learning color icon vector illustration. Data points plot machine learning color icon vector. data points plot machine learning sign. data points plot machine learning color icon vector. data points plot machine learning sign. isolated symbol illustration
Free with trial Detailed line icon of shovel and sold land plot sign for property sales. Plot vectors Shovel digging soil plot with sold sign board for real estate land development. AI generated detailed line icon of shovel and sold land plot sign for property. detailed line icon of shovel and sold land plot sign for property sales
Free with trial Box and whisker plot comparing distribution of six groups with quartile boxes, median lines, whiskers and outlier dots. Plot vectors Box Plot Chart Comparing Six Groups with Whiskers and Medians - Olive and Amber Vector. Box and whisker plot comparing distribution of six groups with quartile. Box and whisker plot comparing distribution of six groups with quartile boxes, median lines, whiskers and outlier dots
Free with trial Scatter plot chart with two colored data clusters, a dashed linear trend line, axis labels and a correlation summary card. Plot vectors Scatter Plot Infographic with Trend Line and Two Clusters - Sky Blue and Yellow Vector. Scatter plot chart with two colored data clusters, a dashed linear trend. Scatter plot chart with two colored data clusters, a dashed linear trend line, axis labels and a correlation summary card
Free with trial An outline icon depicting a cluster of small dots. Represents a scatter plot, data points, a group, or texture. Useful for data visualizations, scientific diagrams, or abstract representations of clusters or dispersed elements in a line,art style, vector design Generative AI. Plot vectors Cluster of Dots Outline Icon for Scatter Plot or Group, vector design Generative AI. An outline icon depicting a cluster of small dots. Represents a scatter plot. An outline icon depicting a cluster of small dots. Represents a scatter plot, data points, a group, or texture. Useful for data visualizations, scientific diagrams, or abstract representations of clusters or dispersed elements in a line,art style, vector design Generative AI
Free with trial This image was created using Generative AI. Collection of statistical analysis icons featuring question marks. Includes magnifying glass, bar chart, pie chart, and scatter plot. Ideal for data uncertainty, statistics, and research concepts. Plot vectors Set of Question Mark Icons With Bar Chart Pie Chart and Scatter Plot on White Background. This image was created using Generative AI. Collection of statistical. This image was created using Generative AI. Collection of statistical analysis icons featuring question marks. Includes magnifying glass, bar chart, pie chart, and scatter plot. Ideal for data uncertainty, statistics, and research concepts
Free with trial A representation of land plot maps for real estate. Plot vectors Icon of Land Plot Maps for Real Estate. A representation of land plot maps for real estate. A representation of land plot maps for real estate.
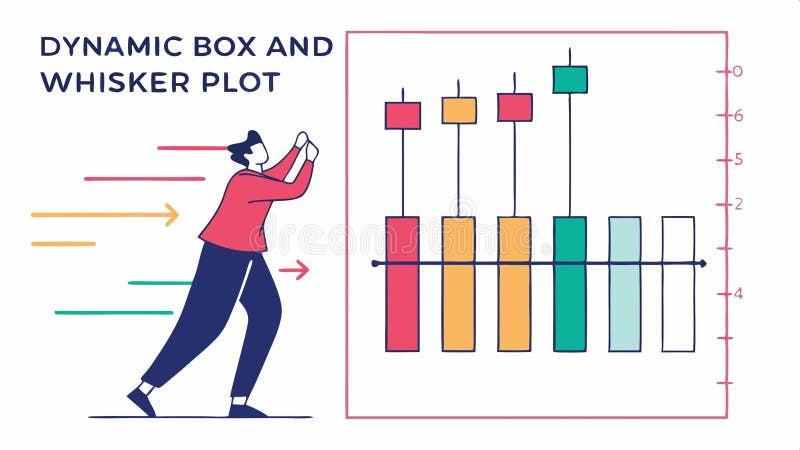
Free with trial A dynamic box and whisker plot, illustrating statistical data, analysis graphs, and comparative data visualization in a clear, informative style vector design Generative AI. Plot vectors Dynamic box and whisker plot, statistical data analysis graph vector design Generative AI. A dynamic box and whisker plot, illustrating statistical data. A dynamic box and whisker plot, illustrating statistical data, analysis graphs, and comparative data visualization in a clear, informative style vector design Generative AI
Free with trial An outline icon depicting a cluster of small dots. Represents texture, scatter plot data points, or a group of small elements. Useful for data visualizations, diagrams, or abstract designs needing a visual representation of clustered or dispersed points, vector design Generative AI. Plot vectors Cluster of Dots Outline Icon for Texture or Scatter Plot, vector design Generative AI. An outline icon depicting a cluster of small dots. Represents texture. An outline icon depicting a cluster of small dots. Represents texture, scatter plot data points, or a group of small elements. Useful for data visualizations, diagrams, or abstract designs needing a visual representation of clustered or dispersed points, vector design Generative AI
Free with trial A clear scatter plot displaying data points and a trend line, indicating correlation and statistical relationships. This analytical graphic is ideal for scientific research, market analysis, or statistical reports. It effectively visualizes the relationship between two variables, making it easier to identify patterns and predict future trends, vector design Generative AI. Plot vectors Scatter Plot with Trend Line, Data Correlation Analysis, vector design Generative AI. A clear scatter plot displaying data points and a trend line, indicating. A clear scatter plot displaying data points and a trend line, indicating correlation and statistical relationships. This analytical graphic is ideal for scientific research, market analysis, or statistical reports. It effectively visualizes the relationship between two variables, making it easier to identify patterns and predict future trends, vector design Generative AI
Free with trial A delightful vector illustration showing a person diligently nurturing a small garden plot using a watering can. Ideal for themes of urban farming, home gardening, or sustainable living, emphasizing growth and care for nature, vector design Generative AI. Plot vectors Nurturing a Small Garden Plot with Watering Can, vector design Generative AI. A delightful vector illustration showing a person diligently nurturing a small. A delightful vector illustration showing a person diligently nurturing a small garden plot using a watering can. Ideal for themes of urban farming, home gardening, or sustainable living, emphasizing growth and care for nature, vector design Generative AI
Free with trial Person analyzing a scatter plot, representing data points, correlation analysis, and statistical graphing in a technical, analytical style vector design Generative AI. Plot vectors Person with scatter plot, data points correlation analysis graph vector design Generative AI. Person analyzing a scatter plot, representing data points. Person analyzing a scatter plot, representing data points, correlation analysis, and statistical graphing in a technical, analytical style vector design Generative AI
Free with trial A tered plot of data points each one symbolizing a different genetic variant.. Vector illustration. A tered plot of data points each one symbolizing a different. Plot vectors A tered plot of data points each one symbolizing a different genetic variant.. Vector illustration. A tered plot of data points each one symbolizing a different
Free with trial Filled outline vector icon set on the theme of strategic real estate. The collection includes a high-rise building, property search magnifier, land plot, market chart, house key, calculator, blueprint map, handshake, apartment block, percentage sign, house shield, gear building, location pin, briefcase, coins and house target. Suitable for real estate websites, investment decks, property reports and business infographics. This image is generated with the use of artificial intelligence (AI). Plot vectors Strategic Real Estate Filled Outline Vector Icon Set with High-Rise, Land Plot, Key and Target. Filled outline vector icon set on the theme of strategic real. Filled outline vector icon set on the theme of strategic real estate. The collection includes a high-rise building, property search magnifier, land plot, market chart, house key, calculator, blueprint map, handshake, apartment block, percentage sign, house shield, gear building, location pin, briefcase, coins and house target. Suitable for real estate websites, investment decks, property reports and business infographics. This image is generated with the use of artificial intelligence (AI).
Free with trial A charming diorama model of a small vegetable garden plot with neat rows of various vegetables like carrots, tomatoes, and leafy greens. Represents gardening, farming, fresh produce png transparent image Generative AI. Plot vectors Miniature vegetable garden plot rows carrots tomatoes farm png transparent image Generative AI. A charming diorama model of a small vegetable garden plot with. A charming diorama model of a small vegetable garden plot with neat rows of various vegetables like carrots, tomatoes, and leafy greens. Represents gardening, farming, fresh produce png transparent image Generative AI
Free with trial Vector set of nine data visualization panels on dark navy: scatter plot, histogram, line chart, heatmap, radar chart, box plot, bubble chart, network graph and contour plot. Text replaced by placeholder bars. Generated with AI (generative AI. Plot vectors Set of nine scientific data charts on dark navy: scatter, histogram, heatmap, radar, box plot, network. Vector set of nine data visualization panels on dark navy. Vector set of nine data visualization panels on dark navy: scatter plot, histogram, line chart, heatmap, radar chart, box plot, bubble chart, network graph and contour plot. Text replaced by placeholder bars. Generated with AI (generative AI
Free with trial An adventure scene with children gathered around a tree imagination igniting as they plot a treasure hunt eyes shining. With potential. AI generated. Plot vectors An adventure scene with children gathered around a tree imagination igniting as they plot a treasure hunt eyes shining. With potential. AI generated
Free with trial Vector set of nine data visualization panels on a light background: scatter plot with regression, histogram, line chart with bands, heatmap, radar chart, box plot, bubble chart, network graph and contour plot. No text. Generated with AI (generative AI. Plot vectors Set of nine scientific charts: scatter, histogram, line, heatmap, radar, box plot, bubble, network, contour. Vector set of nine data visualization panels on a. Vector set of nine data visualization panels on a light background: scatter plot with regression, histogram, line chart with bands, heatmap, radar chart, box plot, bubble chart, network graph and contour plot. No text. Generated with AI (generative AI
Free with trial Isometric Tree in Green Landscape. A stylized, three-dimensional illustration of a large tree with a thick trunk and lush green foliage, set in a small grassy plot with a paved border. Plot vectors Tree with a thick trunk and lush green foliage, set in a small grassy plot with a paved border. Generative AI. Isometric Tree in Green Landscape.A stylized. Isometric Tree in Green Landscape.A stylized, three-dimensional illustration of a large tree with a thick trunk and lush green foliage, set in a small grassy plot with a paved border.
Free with trial A minimalist scatter plot displaying dots on a black background with a simple axes. Clean graphic style for data visualization and representation. Plot vectors Scatter Plot Diagram with Points on a Black Background for Data Visualization. A minimalist scatter plot displaying dots on a black background with a simple axes. A minimalist scatter plot displaying dots on a black background with a simple axes. Clean graphic style for data visualization and representation.
Free with trial A screenshot of a data visualization software interface showing a circular scatter plot with color gradients ranging from blue to green. The interface includes various controls and options for data manipulation and visualization. Plot vectors Advanced data visualization software interface displaying a circular scatter plot with color gradients. A screenshot of a data visualization software interface. A screenshot of a data visualization software interface showing a circular scatter plot with color gradients ranging from blue to green. The interface includes various controls and options for data manipulation and visualization
Free with trial Data points plot machine learning line icon vector. data points plot machine learning sign. isolated contour symbol black illustration. Plot vectors Data points plot machine learning line icon vector illustration. Data points plot machine learning line icon vector. data points plot machine learning sign. data points plot machine learning line icon vector. data points plot machine learning sign. isolated contour symbol black illustration
Free with trial Dot plot visualization icon color illustration. Dot plot visualization line icon vector. dot plot visualization sign. isolated symbol illustration. Plot vectors Dot plot visualization icon color illustration. Dot plot visualization line icon vector. dot plot visualization sign. isolated symbol illustration
Free with trial Data points plot machine learning color icon vector. data points plot machine learning sign. isolated symbol illustration. Plot vectors Data points plot machine learning color icon vector illustration. Data points plot machine learning color icon vector. data points plot machine learning sign. data points plot machine learning color icon vector. data points plot machine learning sign. isolated symbol illustration
Free with trial Plot multi color concept icon. Story board, storytelling. Cinematography, film plot. Round shape line illustration. Abstract idea. Graphic design. Easy to use in infographic, presentation. Plot vectors Plot multi color concept icon. Story board, storytelling. Cinematography, film plot. Round shape line illustration. Abstract idea. Graphic design. Easy to use
Free with trial An icon showing a scatter plot with various data points, commonly used to represent statistical data, analysis, charting, trends, or research findings in business and educational contexts, , vector design Generative AI. Plot vectors Scatter plot data visualization icon, represents statistics and analysis , vector design Generative AI. An icon showing a scatter plot with various data points. An icon showing a scatter plot with various data points, commonly used to represent statistical data, analysis, charting, trends, or research findings in business and educational contexts, , vector design Generative AI
Free with trial This image was created using Generative AI. A scatter plot graph displaying a positive correlation between variables with a regression line on a white background for data analysis and visualization purposes in statistics and business. Plot vectors Scatter plot graph with regression line showing positive correlation between variables on white background. This image was created using Generative AI. A scatter. This image was created using Generative AI. A scatter plot graph displaying a positive correlation between variables with a regression line on a white background for data analysis and visualization purposes in statistics and business
Free with trial Icons for business data analysis: bar chart, person on growth ramp, scatter plot with control sliders, and KPI performance dashboard. Metrics and insights. Plot vectors Business bar chart graph with line, person on upward ramp, scatter plot with sliders, and KPI dashboard display, business data. Icons for business data analysis. Icons for business data analysis: bar chart, person on growth ramp, scatter plot with control sliders, and KPI performance dashboard. Metrics and insights
Free with trial A scatter plot infographic showcasing data distribution correlation analysis data points and the representation of scatter plots for data distribution and correlation analysis Generative AI. Plot vectors Scatter plot infographic data distribution and correlation analysis Generative AI. A scatter plot infographic showcasing data distribution correlation analysis. A scatter plot infographic showcasing data distribution correlation analysis data points and the representation of scatter plots for data distribution and correlation analysis Generative AI
Free with trial Icons representing business performance and data: stock chart, career growth path, data scatter plot with controls, and KPI dashboard. Metrics and analysis. Plot vectors Stock bar chart graph with trend line, upward career path with person, scatter plot with sliders, and KPI dashboard, business. Icons representing business. Icons representing business performance and data: stock chart, career growth path, data scatter plot with controls, and KPI dashboard. Metrics and analysis
Free with trial Christmas socks on a rope, plot for a winter card or poster. Vector illustration. Plot vectors Christmas socks on a rope, plot for a winter card or poster. Vector illustration
Free with trial Data points plot machine learning glyph icon vector. data points plot machine learning sign. isolated symbol illustration. Plot vectors Data points plot machine learning glyph icon vector illustration. Data points plot machine learning glyph icon vector. data points plot machine learning sign. data points plot machine learning glyph icon vector. data points plot machine learning sign. isolated symbol illustration
Free with trial Data points plot machine learning color icon vector. data points plot machine learning sign. isolated symbol illustration. Plot vectors Data points plot machine learning color icon vector illustration. Data points plot machine learning color icon vector. data points plot machine learning sign. data points plot machine learning color icon vector. data points plot machine learning sign. isolated symbol illustration
Free with trial Set of data visualization charts including marketing funnel grid matrix bar chart and scatter plot for business intelligence analysis reporting and statistical data evaluation. Plot vectors Data analysis and processing chart collection featuring funnel diagram grid matrix bar graph and scatter plot statistics. Set of data visualization charts. Set of data visualization charts including marketing funnel grid matrix bar chart and scatter plot for business intelligence analysis reporting and statistical data evaluation
Free with trial A ter plot graph analyzing customer demand for a specific product helping shipping companies plan their inventory and logistics accordingly.. Vector illustration. Plot vectors A ter plot graph analyzing customer demand for a specific product helping shipping companies plan their inventory and. Logistics accordingly.. Vector
Free with trial Data points plot machine learning isometric icon vector. data points plot machine learning sign. isolated symbol illustration. Plot vectors Data points plot machine learning isometric icon vector illustration. Data points plot machine learning isometric icon vector. data points plot machine learning. data points plot machine learning isometric icon vector. data points plot machine learning sign. isolated symbol illustration
Free with trial Dot plot graph line icon. Neumorphic, Red gradient, 3d pin buttons. Presentation chart sign. Market analytics symbol. Line icons. Neumorphic buttons with outline signs. Vector. Plot vectors Dot plot graph line icon. Presentation chart sign. Line icons. Vector. Dot plot graph line icon. Neumorphic, Red gradient, 3d pin buttons. Presentation chart. Dot plot graph line icon. Neumorphic, Red gradient, 3d pin buttons. Presentation chart sign. Market analytics symbol. Line icons. Neumorphic buttons with outline signs. Vector
Free with trial A ter plot comparing the average debt per student to the average starting salary for different majors.. Vector. Illustration AI generated. Plot vectors A ter plot comparing the average debt per student to the average starting salary for different majors.. Vector. Illustration AI generated
Free with trial Dot plot visualization icon doodle illustration. Dot plot visualization doodle icon sketch vector. dot plot visualization sign. isolated symbol illustration. Plot vectors Dot plot visualization icon doodle illustration. Dot plot visualization doodle icon sketch vector. dot plot visualization sign. isolated symbol illustration
Free with trial A ter plot showing the correlation between malnutrition rates and access to clean water and sanitation.. Vector. Illustration AI generated. Plot vectors A ter plot showing the correlation between malnutrition rates and access to clean water and sanitation.. Vector. Illustration AI generated
Free with trial Red gradient curve. Vector graphic icon. Simple Cartesian plot. Sharp clean edges. EPS 10. Plot vectors Red gradient curve. Vector graphic icon. Simple Cartesian plot. Sharp clean edges. EPS 10
Free with trial Clean skin, Star and Dot plot line icons. Square, Gradient, Pin 3d buttons. AI, QA and map pin icons. Pack of Floor lamp, Software bug, Boat fishing icon. Vector. Plot vectors Clean skin, Star and Dot plot line icons. For web app, printing. Line icons. Vector. Clean skin, Star and Dot plot line icons. Square, Gradient, Pin 3d buttons. Clean skin, Star and Dot plot line icons. Square, Gradient, Pin 3d buttons. AI, QA and map pin icons. Pack of Floor lamp, Software bug, Boat fishing icon. Vector
Free with trial A ter plot comparing the number of cars on the road during peak rush hour versus offpeak hours providing insight into potential solutions for reducing traffic congestion.. Vector. Plot vectors A ter plot comparing the number of cars on the road during peak rush hour versus offpeak hours providing insight into. Potential solutions for reducing traffic
Free with trial A ter plot showing the relationship between hospital readmissions and adherence to a specific medication regimen as predicted by healthcare data analysis.. Vector illustration. Plot vectors A ter plot showing the relationship between hospital readmissions and adherence to a specific medication regimen as. Predicted by healthcare data analysis
Free with trial Colorful marigolds and plump zucchinis sprouted proudly from the oncebarren plot thanks to the hard work of students in the schools greening project.. Vector illustration. Plot vectors Colorful marigolds and plump zucchinis sprouted proudly from the oncebarren plot thanks to the hard work of students in. The schools greening project.. Vector
Free with trial A ter plot displaying the correlation between genetic traits and health outcomes based on genome sequencing data. Vector illustration AI generated. Plot vectors A ter plot displaying the correlation between genetic traits and health outcomes based on genome sequencing data. Vector illustration AI generated
Free with trial A ter plot highlights the correlation between a users income and their debt helping them make informed decisions about paying off loans or credit card balances.. Vector illustration. Plot vectors A ter plot highlights the correlation between a users income and their debt helping them make informed decisions about. Paying off loans or credit card balances
Free with trial Work home, Dot plot and Cyber attack line icons. Pack of Green energy, Brush, Winner star icon. Usb flash, Recovery devices, Calendar pictogram. Education idea, Phone search, Timer. Line icons. Vector. Plot vectors Work home, Dot plot and Cyber attack line icons. For web app, printing. Line icons. Vector. Work home, Dot plot and Cyber attack line icons. Pack of Green energy. Work home, Dot plot and Cyber attack line icons. Pack of Green energy, Brush, Winner star icon. Usb flash, Recovery devices, Calendar pictogram. Education idea, Phone search, Timer. Line icons. Vector
 Sign in