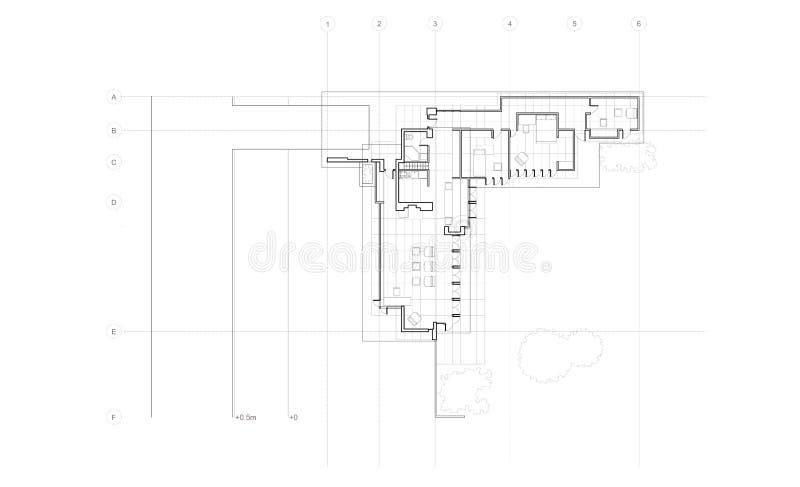
Free with trial Jacobs House Detailed Plan. Very Detailed plan of the modern house (Jacobs' House) for the architect Frank Lloyd Wright. Plotted vectors Jacobs House Detailed Plan. Very Detailed plan of the modern house (Jacobs' House) for the architect Frank Lloyd Wright
Free with trial Coordinate graphing, or draw by coordinates, math worksheet with big mushroom and a snail: To reveal the mystery picture plot and connect the dots with given coordinates. Answer included. Plotted vectors Coordinate graphing, or draw by coordinates, math worksheet with big mushroom and a snail. To reveal the mystery picture plot and connect the dots with given. Coordinate graphing, or draw by coordinates, math worksheet with big mushroom and a snail: To reveal the mystery picture plot and connect the dots with given coordinates. Answer included.
Free with trial Collection of several styles of charts and graphs in red, white and blue. Plotted vectors Charts and graphs. Collection of several styles of charts and graphs in red, white and blue. Collection of several styles of charts and graphs in red, white and blue.
Free with trial Coordinate graphing, or draw by coordinates, math worksheet with Halloween pumpkin: To reveal the mystery picture plot and connect the dots with given coordinates. Answer included. Plotted vectors Coordinate graphing, or draw by coordinates, math worksheet with Halloween pumpkin. To reveal the mystery picture plot and connect the dots with given. Coordinate graphing, or draw by coordinates, math worksheet with Halloween pumpkin: To reveal the mystery picture plot and connect the dots with given coordinates. Answer included.
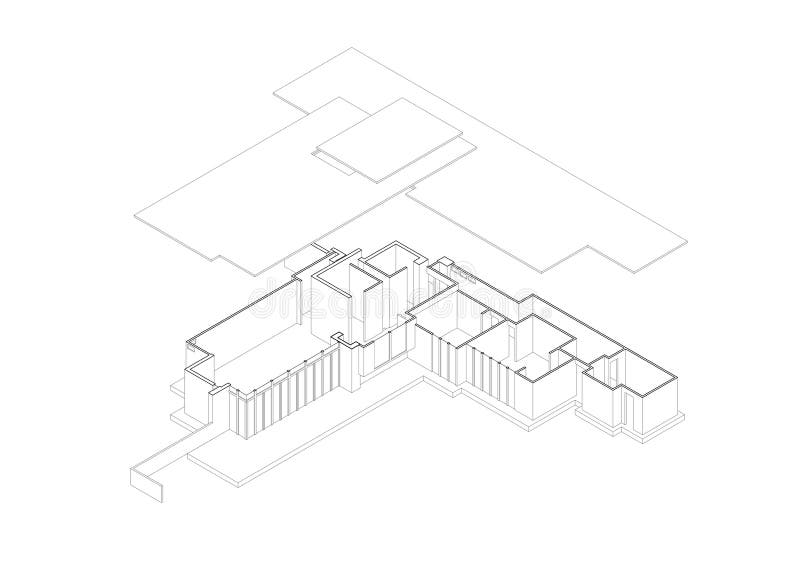
Free with trial Jacobs' House Exploded Isometric Drawing that illustrate the interior divisions in an artistic way, this house is designed by the famous architect Frank Lloyd Wright. Plotted vectors Jacobs' House Exploded Isometric Drawing. That illustrate the interior divisions in an artistic way, this house is designed by the famous architect Frank Lloyd
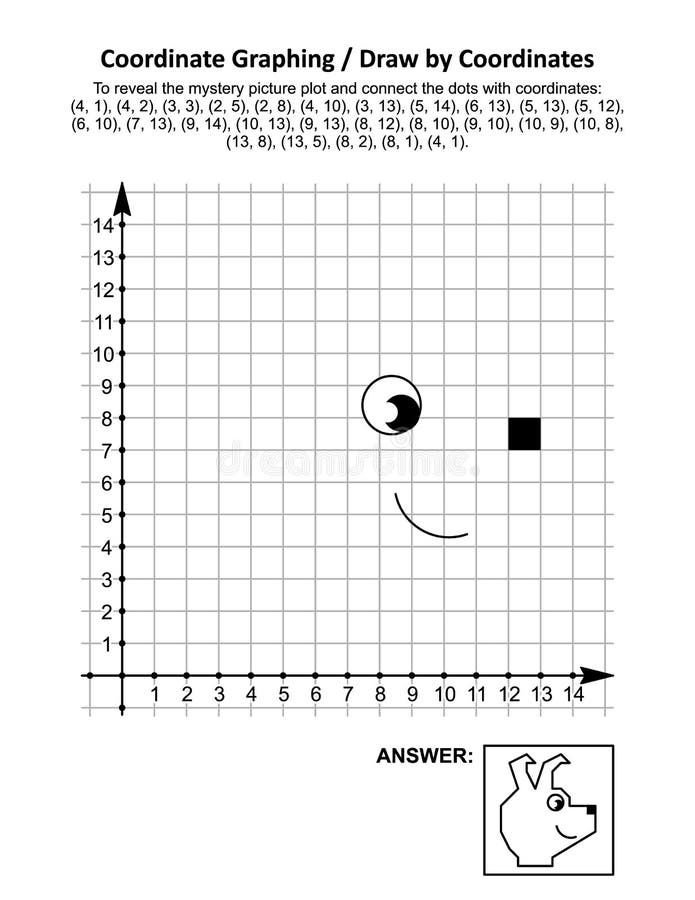
Free with trial Coordinate graphing, or draw by coordinates, math worksheet with cute dog: To reveal the mystery picture plot and connect the dots with given coordinates. Answer included. Plotted vectors Coordinate graphing, or draw by coordinates, math worksheet with cute dog. To reveal the mystery picture plot and connect the dots with given coordinates
Free with trial Arrow Graph with steps up. 3d vector green arrow graph with steps up on white background. Plotted vectors Arrow Graph with steps up. 3d vector green arrow graph with steps up on white background
Free with trial Set of marked paper templates. Ruled, grid, dotgrid and isometric paper in several real sizes for notes, sketches, drawings and designs. A4 plotted format. Plotted vectors Gridded paper templates set for new designs. Set of marked paper templates. Ruled, grid, dotgrid and isometric paper in several real sizes for notes, sketches. Set of marked paper templates. Ruled, grid, dotgrid and isometric paper in several real sizes for notes, sketches, drawings and designs. A4 plotted format.
Free with trial Digitally plotted sphere glowing with blue turquoise on black background poster scientific technology decorative shapes vector illustration. Plotted vectors Geometric Glowing Sphere Background poster. Digitally plotted sphere glowing with blue turquoise on black background poster scientific technology decorative. Digitally plotted sphere glowing with blue turquoise on black background poster scientific technology decorative shapes vector illustration
Free with trial A suit child female 2. Illustration of a beautiful suit for child female, formed by pant and shirt. Plotted vectors A suit child female 2. Illustration of a beautiful suit for child female, formed by pant and shirt
Free with trial The illustration is a collection of symbols, which indicate the temperature of washing, ironing clothes. Plotted vectors Collection of symbols for washing clothes. The illustration is a collection of symbols, which indicate the temperature of washing, ironing clothes. The illustration is a collection of symbols, which indicate the temperature of washing, ironing clothes.
Free with trial Colorful chart on graph paper with red arrow showing upward trend. Plotted vectors Upward trend on chart. Colorful chart on graph paper with red arrow showing upward trend. Colorful chart on graph paper with red arrow showing upward trend.
Free with trial Coordinate graphing, or draw by coordinates, math worksheet with paper aeroplanes: To reveal the mystery picture plot and connect the dots with given coordinates. Answer included. Plotted vectors Coordinate graphing, or draw by coordinates, math worksheet with paper planes. Coordinate graphing, or draw by coordinates, math worksheet with paper aeroplanes. Coordinate graphing, or draw by coordinates, math worksheet with paper aeroplanes: To reveal the mystery picture plot and connect the dots with given coordinates. Answer included.
Free with trial Coordinate graphing, or draw by coordinates, math worksheet with fishes: To reveal the mystery picture plot and connect the dots with given coordinates. Answer included. Plotted vectors Coordinate graphing, or draw by coordinates, math worksheet with fishes. To reveal the mystery picture plot and connect the dots with given coordinates. Answer
Free with trial Coordinate graphing, or draw by coordinates, math worksheet with christmas tree: To reveal the mystery picture plot and connect the dots with given coordinates. Answer included. Plotted vectors Coordinate graphing, or draw by coordinates, math worksheet with christmas tree. To reveal the mystery picture plot and connect the dots with given coordinates
Free with trial Coordinate graphing, or draw by coordinates, math worksheet with flying kite: To reveal the mystery picture plot and connect the dots with given coordinates. Answer included. Plotted vectors Coordinate graphing, or draw by coordinates, math worksheet with flying kite. To reveal the mystery picture plot and connect the dots with given coordinates
Free with trial Coordinate graphing, or draw by coordinates, math worksheet with Halloween fat cat, lying in wait for prey: To reveal the mystery picture plot and connect the dots with given coordinates. Answer included. Plotted vectors Coordinate graphing, or draw by coordinates, math worksheet with Halloween cat, lying in wait for prey. Coordinate graphing, or draw by coordinates, math. Coordinate graphing, or draw by coordinates, math worksheet with Halloween fat cat, lying in wait for prey: To reveal the mystery picture plot and connect the dots with given coordinates. Answer included.
Free with trial Coordinate graphing, or draw by coordinates, math worksheet with pinwheel toy: To reveal the mystery picture plot and connect the dots with given coordinates. Answer included. Plotted vectors Coordinate graphing, or draw by coordinates, math worksheet with pinwheel toy. To reveal the mystery picture plot and connect the dots with given coordinates
Free with trial Coordinate graphing, or draw by coordinates, math worksheet with cute young bull or cow: To reveal the mystery picture plot and connect the dots with given coordinates. Answer included. Plotted vectors Coordinate graphing, or draw by coordinates, math worksheet with cute young bull or cow. To reveal the mystery picture plot and connect the dots with given. Coordinate graphing, or draw by coordinates, math worksheet with cute young bull or cow: To reveal the mystery picture plot and connect the dots with given coordinates. Answer included.
Free with trial Coordinate graphing, or draw by coordinates, math worksheet with christmas gingerbread man cookie: To reveal the mystery picture plot and connect the dots with given coordinates. Answer included. Plotted vectors Coordinate graphing, or draw by coordinates, math worksheet with christmas gingerbread man. Cookie: To reveal the mystery picture plot and connect the dots with. Coordinate graphing, or draw by coordinates, math worksheet with christmas gingerbread man cookie: To reveal the mystery picture plot and connect the dots with given coordinates. Answer included.
Free with trial Coordinate graphing, or draw by coordinates, math worksheet with Halloween witch`s shoes: To reveal the mystery picture plot and connect the dots with given coordinates. Answer included. Plotted vectors Coordinate graphing, or draw by coordinates, math worksheet with Halloween witch`s shoes. To reveal the mystery picture plot and connect the dots with given. Coordinate graphing, or draw by coordinates, math worksheet with Halloween witch`s shoes: To reveal the mystery picture plot and connect the dots with given coordinates. Answer included.
Free with trial Coordinate graphing, or drawing by coordinates, math worksheet with ufo: Reveal the mystery picture by plotting and connecting the dots with given coordinates. Plotted vectors Coordinate graphing, or drawing by coordinates, math worksheet with ufo: Reveal the mystery picture by plotting and connecting the. Dots with given coordinates
Free with trial Coordinate graphing, or draw by coordinates, math worksheet with Halloween cute little ghost: To reveal the mystery picture plot and connect the dots with given coordinates. Answer included. Plotted vectors Coordinate graphing, or draw by coordinates, math worksheet with Halloween cute little ghost. To reveal the mystery picture plot and connect the dots with. Coordinate graphing, or draw by coordinates, math worksheet with Halloween cute little ghost: To reveal the mystery picture plot and connect the dots with given coordinates. Answer included.
Free with trial Coordinate graphing, or drawing by coordinates, math worksheet with swan: Reveal the mystery picture by plotting and connecting t. He dots with given coordinates. Plotted vectors Coordinate graphing, or drawing by coordinates, math worksheet with swan: Reveal the mystery picture by plotting and connecting t. He dots with given coordinates
Free with trial Coordinate graphing, or drawing by coordinates, math worksheet with spaceship or rocket: Reveal the mystery picture by plotting and connecting the dots with given coordinates. Plotted vectors Coordinate graphing, or drawing by coordinates, math worksheet with spaceship or rocket: Reveal the mystery picture by plotting an. D connecting the dots with
Free with trial Illustration of a smart young man in a blue suit on a stair with a rising graph plotted on the wall beside him. Concept of a rising career path. Plotted vectors Career path going up and up. Illustration of a smart young man in a blue suit on a stair with a rising graph plotted on the wall beside him. Concept of a rising. Illustration of a smart young man in a blue suit on a stair with a rising graph plotted on the wall beside him. Concept of a rising career path.
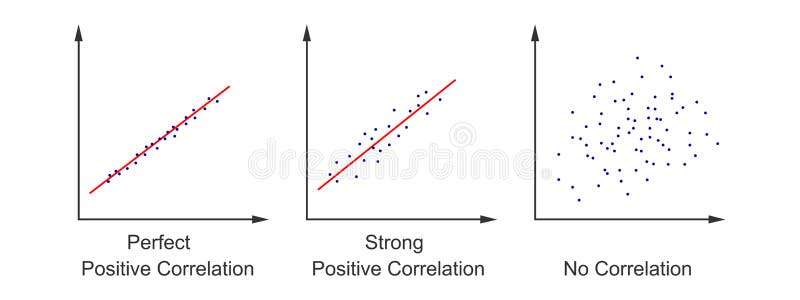
Free with trial Set of scatter plot diagrams. Scattergrams with different types of variables correlation. Data points plotted on a horizontal and a vertical axis on Cartesian plane. Vector flat illustration. Plotted vectors Set of scatter plot diagrams. Scattergrams with different types of variables correlation. Data points plotted on a. Horizontal and a vertical axis on Cartesian. Set of scatter plot diagrams. Scattergrams with different types of variables correlation. Data points plotted on a horizontal and a vertical axis on Cartesian plane. Vector flat illustration
Free with trial A suit child female 1. Illustration of a beautiful suit for child female. Plotted vectors A suit child female 1. Illustration of a beautiful suit for child female
Free with trial Coordinate graphing, or draw by coordinates, math worksheet with Halloween witch hat: To reveal the mystery picture plot and connect the dots with given coordinates. Answer included. Plotted vectors Coordinate graphing, or draw by coordinates, math worksheet with Halloween witch hat. To reveal the mystery picture plot and connect the dots with given. Coordinate graphing, or draw by coordinates, math worksheet with Halloween witch hat: To reveal the mystery picture plot and connect the dots with given coordinates. Answer included.
Free with trial Coordinate graphing, or draw by coordinates, math worksheet with a bird: To reveal the mystery picture plot and connect the dots with given coordinates. Answer included. Plotted vectors Coordinate graphing, or draw by coordinates, math worksheet with a bird. To reveal the mystery picture plot and connect the dots with given coordinates. Answer
Free with trial Coordinate graphing, or draw by coordinates, math worksheet with snowman wearing Santa cap: To reveal the mystery picture plot and connect the dots with given coordinates. Answer included. Plotted vectors Coordinate graphing, or draw by coordinates, math worksheet with snowman. Wearing Santa cap: To reveal the mystery picture plot and connect the dots with given. Coordinate graphing, or draw by coordinates, math worksheet with snowman wearing Santa cap: To reveal the mystery picture plot and connect the dots with given coordinates. Answer included.
Free with trial Coordinate graphing, or draw by coordinates, math worksheet with old village house: To reveal the mystery picture plot and connect the dots with given coordinates. Answer included. Plotted vectors Coordinate graphing, or draw by coordinates, math worksheet with old village house. Coordinate graphing, or draw by coordinates, math worksheet with old village. Coordinate graphing, or draw by coordinates, math worksheet with old village house: To reveal the mystery picture plot and connect the dots with given coordinates. Answer included.
Free with trial Black - white silhouette of a buffalo bull, bison is depicted in the style of ancient native peoples of the Americas, Africa, Australia and Asia. On the trunk Bika plotted ancient mystical patterns, ornaments shamans for religious rituals. Taurus zodiac sign. Plotted vectors Silhouette of a black - white bull, buffalo, bison, pictured wit. Black - white silhouette of a buffalo bull, bison is depicted in the style of ancient native. Black - white silhouette of a buffalo bull, bison is depicted in the style of ancient native peoples of the Americas, Africa, Australia and Asia. On the trunk Bika plotted ancient mystical patterns, ornaments shamans for religious rituals. Taurus zodiac sign.
Free with trial Coordinate graphing, or draw by coordinates, math worksheet with christmas ringing bell: To reveal the mystery picture plot and connect the dots with given coordinates. Answer included. Plotted vectors Coordinate graphing, or draw by coordinates, math worksheet with christmas ringing bell. To reveal the mystery picture plot and connect the dots with given. Coordinate graphing, or draw by coordinates, math worksheet with christmas ringing bell: To reveal the mystery picture plot and connect the dots with given coordinates. Answer included.
Free with trial Coordinate graphing, or draw by coordinates, math worksheet with a teapot: To reveal the mystery picture plot and connect the dots with given coordinates. Answer included. Plotted vectors Coordinate graphing, or draw by coordinates, math worksheet with a teapot. To reveal the mystery picture plot and connect the dots with given coordinates
Free with trial Coordinate graphing, or draw by coordinates, math worksheet with christmas ornaments: To reveal the mystery picture plot and connect the dots with given coordinates. Answer included. Plotted vectors Coordinate graphing, or draw by coordinates, math worksheet with christmas baubles. Coordinate graphing, or draw by coordinates, math worksheet with christmas. Coordinate graphing, or draw by coordinates, math worksheet with christmas ornaments: To reveal the mystery picture plot and connect the dots with given coordinates. Answer included.
Free with trial Coordinate graphing, or draw by coordinates, math worksheet with bucket and shovel for beach: To reveal the mystery picture plot and connect the dots with given coordinates. Answer included. Plotted vectors Coordinate graphing, or draw by coordinates, math worksheet with bucket and shovel for beach. To reveal the mystery picture plot and connect the dots with. Coordinate graphing, or draw by coordinates, math worksheet with bucket and shovel for beach: To reveal the mystery picture plot and connect the dots with given coordinates. Answer included.
Free with trial St Valentine`s Day coordinate graphing, or draw by coordinates, math worksheet: To reveal the mystery picture plot and connect the dots with given coordinates. Answer included. Plotted vectors St Valentine`s Day coordinate graphing, or draw by coordinates, math worksheet. To reveal the mystery picture plot and connect the dots with given coordinates
Free with trial Coordinate graphing, or draw by coordinates, math worksheet with christmas stockings: To reveal the mystery picture plot and connect the dots with given coordinates. Answer included. Plotted vectors Coordinate graphing, or draw by coordinates, math worksheet with christmas stockings. To reveal the mystery picture plot and connect the dots with given. Coordinate graphing, or draw by coordinates, math worksheet with christmas stockings: To reveal the mystery picture plot and connect the dots with given coordinates. Answer included.
Free with trial Coordinate graphing, or draw by coordinates, math worksheet with gift boxes: To reveal the mystery picture plot and connect the dots with given coordinates. Answer included. Plotted vectors Coordinate graphing, or draw by coordinates, math worksheet with gift boxes. To reveal the mystery picture plot and connect the dots with given coordinates
Free with trial Coordinate graphing, or draw by coordinates, math worksheet with St Valentine`s Day mystery picture `V is for Valentine`: To reveal the mystery picture plot and connect the dots with given coordinates. Answer included. Plotted vectors Coordinate graphing, or draw by coordinates, math worksheet with Valentine`s Day mystery picture. Coordinate graphing, or draw by coordinates, math worksheet. Coordinate graphing, or draw by coordinates, math worksheet with St Valentine`s Day mystery picture `V is for Valentine`: To reveal the mystery picture plot and connect the dots with given coordinates. Answer included.
Free with trial Coordinate graphing, or draw by coordinates, math worksheet with rings stacker toy: To reveal the mystery picture plot and connect the dots with given coordinates. Answer included. Plotted vectors Coordinate graphing, or draw by coordinates, math worksheet with rings stacker toy. To reveal the mystery picture plot and connect the dots with given. Coordinate graphing, or draw by coordinates, math worksheet with rings stacker toy: To reveal the mystery picture plot and connect the dots with given coordinates. Answer included.
Free with trial Coordinate graphing, or draw by coordinates, math worksheet with Halloween bats and tombs: To reveal the mystery picture plot and connect the dots with given coordinates. Answer included. Plotted vectors Coordinate graphing, or draw by coordinates, math worksheet with Halloween bats and tombs. To reveal the mystery picture plot and connect the dots with given. Coordinate graphing, or draw by coordinates, math worksheet with Halloween bats and tombs: To reveal the mystery picture plot and connect the dots with given coordinates. Answer included.
Free with trial Coordinate graphing, or draw by coordinates, math worksheet withSanta`s sack on the sleigh: To reveal the mystery picture plot and connect the dots with given coordinates. Answer included. Plotted vectors Coordinate graphing, or draw by coordinates, math worksheet with Santa`s sack on the sleigh. Coordinate graphing, or draw by coordinates, math worksheet. Coordinate graphing, or draw by coordinates, math worksheet withSanta`s sack on the sleigh: To reveal the mystery picture plot and connect the dots with given coordinates. Answer included.
Free with trial Coordinate graphing, or draw by coordinates, math worksheet with St Patrick`s Day mystery picture of celtic design. Answer included. Plotted vectors Coordinate graphing, or draw by coordinates, math worksheet with St Patrick`s Day celtic design. Coordinate graphing, or draw by coordinates, math worksheet with. Coordinate graphing, or draw by coordinates, math worksheet with St Patrick`s Day mystery picture of celtic design. Answer included.
Free with trial Coordinate graphing, or draw by coordinates, math worksheet with St Patrick`s Day shamrock trefoil leaf mystery picture: To reveal the mystery picture plot and connect the dots with given coordinates. Answer included. Plotted vectors Coordinate graphing, or draw by coordinates, math worksheet with St Patrick`s Day mystery picture. Coordinate graphing, or draw by coordinates, math worksheet. Coordinate graphing, or draw by coordinates, math worksheet with St Patrick`s Day shamrock trefoil leaf mystery picture: To reveal the mystery picture plot and connect the dots with given coordinates. Answer included.
Free with trial Coordinate graphing, or draw by coordinates, math worksheet with St Valentine`s Day two friendly hearts: To reveal the mystery picture plot and connect the dots with given coordinates. Answer included. Plotted vectors Coordinate graphing, or draw by coordinates, math worksheet with Valentine`s Day two friendly hearts. Coordinate graphing, or draw by coordinates, math worksheet. Coordinate graphing, or draw by coordinates, math worksheet with St Valentine`s Day two friendly hearts: To reveal the mystery picture plot and connect the dots with given coordinates. Answer included.
Free with trial Coordinate graphing, or draw by coordinates, math worksheet with Halloween apothecary and witch`s pot: To reveal the mystery picture plot and connect the dots with given coordinates. Answer included. Plotted vectors Coordinate graphing, or draw by coordinates, math worksheet with Halloween apothecary and witch`s pot. To reveal the mystery picture plot and connect the dots. Coordinate graphing, or draw by coordinates, math worksheet with Halloween apothecary and witch`s pot: To reveal the mystery picture plot and connect the dots with given coordinates. Answer included.
Free with trial This is answer key page for coordinate graphing, or drawing by coordinates, math worksheet with `Happy Easter! ` greeting. Plotted vectors This is answer key page for coordinate graphing, or drawing by coordinates, math worksheet with `Happy Easter!` greeting
Free with trial Digital Geometric Shapes Set. Digitally plotted geometric shapes imaged collection with cube sphere abstract figures white black design vector illustration. Plotted vectors Digital Geometric Shapes Set. Digitally plotted geometric shapes imaged collection with cube sphere abstract figures white black design vector illustration
Free with trial Coordinate graphing, or drawing by coordinates, math worksheet with cheerful alien: Reveal the mystery picture by plotting and connecting the dots with given coordinates. Plotted vectors Coordinate graphing, or drawing by coordinates, math worksheet with cheerful alien: Reveal the mystery picture by plotting and con. Necting the dots with given
Free with trial Coordinate graphing, or draw by coordinates, math worksheet with St Valentine`s Day number fourteen: To reveal the mystery picture plot and connect the dots with given coordinates. Answer included. Plotted vectors Coordinate graphing, or draw by coordinates, math worksheet with Valentine`s Day number 14. Coordinate graphing, or draw by coordinates, math worksheet with St. Coordinate graphing, or draw by coordinates, math worksheet with St Valentine`s Day number fourteen: To reveal the mystery picture plot and connect the dots with given coordinates. Answer included.
Free with trial Coordinate graphing, or draw by coordinates, math worksheet with Halloween candies: To reveal the mystery picture plot and connect the dots with given coordinates. Answer included. Plotted vectors Coordinate graphing, or draw by coordinates, math worksheet with Halloween candies. To reveal the mystery picture plot and connect the dots with given. Coordinate graphing, or draw by coordinates, math worksheet with Halloween candies: To reveal the mystery picture plot and connect the dots with given coordinates. Answer included.
Free with trial This is answer key page for coordinate graphing, or drawing by coordinates, math worksheet with cheerful alien. Plotted vectors This is answer key page for coordinate graphing, or drawing by coordinates, math worksheet with cheerful alien
Free with trial This is answer key page for coordinate graphing, or drawing by coordinates, math worksheet with spaceship or rocket. Plotted vectors This is answer key page for coordinate graphing, or drawing by coordinates, math worksheet with spaceship or rocket
Free with trial Coordinate graphing, or drawing by coordinates, math worksheet with poodle dog: Reveal the mystery picture by plotting and connecting the dots with given coordinates. Plotted vectors Coordinate graphing, or drawing by coordinates, math worksheet with poodle dog: Reveal the mystery picture by plotting and connect. Ing the dots with given
Free with trial Coordinate graphing, or drawing by coordinates, math worksheet with watering can: Reveal the mystery picture by plotting and connecting the dots with given coordinates. Plotted vectors Coordinate graphing, or drawing by coordinates, math worksheet with watering can: Reveal the mystery picture by plotting and conne. Cting the dots with given
Free with trial This is answer key page for coordinate graphing, or drawing by coordinates, math worksheet with watering can. Plotted vectors This is answer key page for coordinate graphing, or drawing by coordinates, math worksheet with watering can
Free with trial This is answer key page for coordinate graphing, or drawing by coordinates, math worksheet with poodle dog. Plotted vectors This is answer key page for coordinate graphing, or drawing by coordinates, math worksheet with poodle dog
Free with trial Coordinate graphing, or draw by coordinates, math worksheet with Thanksgiving Day holiday themed picture puzzle and coloring page wth `Thank you! ` hidden message. Answer included. Plotted vectors Coordinate graphing, or draw by coordinates, math worksheet with Thanksgiving Day holiday themed picture puzzle and coloring page. Wth `Thank you!` hidden. Coordinate graphing, or draw by coordinates, math worksheet with Thanksgiving Day holiday themed picture puzzle and coloring page wth `Thank you!` hidden message. Answer included.
Free with trial Coordinate graphing, or drawing by coordinates, math worksheet with honey bee: Reveal the mystery picture by plotting and connecting the dots with given coordinates. Plotted vectors Coordinate graphing, or drawing by coordinates, math worksheet with honey bee: Reveal the mystery picture by plotting and connecti. Ng the dots with given
Free with trial This is answer key page for coordinate graphing, or drawing by coordinates, math worksheet with swan. Plotted vectors This is answer key page for coordinate graphing, or drawing by coordinates, math worksheet with swan
Free with trial This is answer key page for coordinate graphing, or drawing by coordinates, math worksheet with birds, nestlings, birdhouses. Plotted vectors This is answer key page for coordinate graphing, or drawing by coordinates, math worksheet with birds, nestlings, birdhouses
Free with trial Coordinate graphing, or drawing by coordinates, math worksheet with birds, nestlings, birdhouses: Reveal the mystery picture by plotting and connecting the dots with given coordinates. Plotted vectors Coordinate graphing, or drawing by coordinates, math worksheet with birds, nestlings, birdhouses: Reveal the mystery picture by pl. Otting and connecting the. Coordinate graphing, or drawing by coordinates, math worksheet with birds, nestlings, birdhouses: Reveal the mystery picture by plotting and connecting the dots with given coordinates.
Free with trial Innovative AI visualization of plotted course, ideal for tech presentations, data analysis reports, and futuristic design projects. Showcase progress with clarity. Plotted vectors AI plotted course visualization displays progress and advancement with modern design. Innovative AI visualization of plotted course, ideal for tech presentations. Innovative AI visualization of plotted course, ideal for tech presentations, data analysis reports, and futuristic design projects. Showcase progress with clarity
Free with trial Business Icon of Bar Chart with Plotted Line Graph (2-color, Blue, Data Analytics, Statistics, Performance, Progress. Vector illustration. Original paintings and drawing. Plotted vectors Business Icon of Bar Chart with Plotted Line Graph (2-color, Blue, Data Analytics, Statistics, Performance, Progress. Vector illustration. Original paintings
Free with trial This image displays a graph with fluctuating data points plotted along the y-axis against a range of values on the x-axis. The graph includes two prominent red lines: one horizontal line at y 0 and one vertical line at x 1400. The data points show significant variations around the horizontal line, indicating some form of measurement or signal analysis. Plotted vectors Graph with red lines and fluctuating data. This image displays a graph with fluctuating data points plotted along the y-axis against a range of values on the x. This image displays a graph with fluctuating data points plotted along the y-axis against a range of values on the x-axis. The graph includes two prominent red lines: one horizontal line at y 0 and one vertical line at x 1400. The data points show significant variations around the horizontal line, indicating some form of measurement or signal analysis
Free with trial A single cosine curve plotted on x and y axes with arrowheads and quarter-period tick marks, starting at its peak on the y-axis. Plotted vectors Cosine Wave Icon - cosine curve plotted on labeled axes. A single cosine curve plotted on x and y axes with arrowheads and quarter-period tick marks, starting at. A single cosine curve plotted on x and y axes with arrowheads and quarter-period tick marks, starting at its peak on the y-axis.
Free with trial Data visualization, analytics, communication tools, business trends, market research, statistics. Graph with plotted points and speech bubble. Data visualization and analytics concept. Plotted vectors Data Analysis and Communication Concept with Graph and Speech Bubble. Data visualization, analytics, communication tools, business trends, market research. Data visualization, analytics, communication tools, business trends, market research, statistics. Graph with plotted points and speech bubble. Data visualization and analytics concept
Free with trial A map of galaxies plotted in coordinates, resembling a grid. It features numerous dark specks representing galaxy locations, spread across a white background. The lines intersect at regular intervals, forming a network of squares that organize the vast distribution of celestial objects. This visualization aids in understanding the large-scale structure of the universe, showing how galaxies cluster and disperse over cosmic distances. Plotted vectors A map of galaxies plotted in coordinates, resembling a grid. It features numerous dark specks representing galaxy locations, spread across a white background
Free with trial Cloud computing, data analysis, technology trends, digital storage, business forecasting, online services. A large cloud next to a data chart with plotted points. Cloud computing and data analysis. Plotted vectors Cloud Computing and Data Analytics Concept with Graph Plot on a Grid Background. Cloud computing, data analysis, technology trends, digital storage, business. Cloud computing, data analysis, technology trends, digital storage, business forecasting, online services. A large cloud next to a data chart with plotted points. Cloud computing and data analysis
Free with trial Data analytics, performance trends, business forecasting, economic insights, growth tracking, decision support. Line graph with plotted points on a grid. Data analytics and performance trends. Plotted vectors Data Visualization with Line Chart and Analytics Icons Trends and Performance Metrics. Data analytics, performance trends, business forecasting, economic. Data analytics, performance trends, business forecasting, economic insights, growth tracking, decision support. Line graph with plotted points on a grid. Data analytics and performance trends
Free with trial This graphic illustration features a smooth, symmetrical bell curve plotted against a clean coordinate system. The area under the curve is filled with a solid light blue color, while the axes and outline are rendered in a darker blue tone. A small circular marker highlights the peak of the distribution, emphasizing the central tendency. The overall aesthetic is minimalist, professional and. Plotted vectors A blue bell curve graph displayed on a simple coordinate system grid. This graphic illustration features a smooth, symmetrical bell curve plotted against a clean. This graphic illustration features a smooth, symmetrical bell curve plotted against a clean coordinate system. The area under the curve is filled with a solid light blue color, while the axes and outline are rendered in a darker blue tone. A small circular marker highlights the peak of the distribution, emphasizing the central tendency. The overall aesthetic is minimalist, professional and
Free with trial This minimalist vector illustration features two distinct line graphs plotted against a standard grid axis. The lines exhibit fluctuating patterns that ultimately trend upward, symbolizing growth and positive performance. The design uses a clean, professional aesthetic with muted tones, making it ideal for corporate presentations, financial reports, or educational materials. Plotted vectors A simple line graph showing upward trends on a clean white background. This minimalist vector illustration features two distinct line graphs plotted against a. This minimalist vector illustration features two distinct line graphs plotted against a standard grid axis. The lines exhibit fluctuating patterns that ultimately trend upward, symbolizing growth and positive performance. The design uses a clean, professional aesthetic with muted tones, making it ideal for corporate presentations, financial reports, or educational materials
Free with trial This graphic illustration features a red line chart plotted against a light gray grid background, indicating a consistent decline in value. Multiple downward-pointing arrows and currency symbols are integrated into the design to emphasize the negative economic movement. The overall aesthetic is clean, minimalist and professional, utilizing a high-contrast color palette to convey a sense of urgency. Plotted vectors A red line graph showing a downward trend in financial performance metrics. This graphic illustration features a red line chart plotted against a light gray grid. This graphic illustration features a red line chart plotted against a light gray grid background, indicating a consistent decline in value. Multiple downward-pointing arrows and currency symbols are integrated into the design to emphasize the negative economic movement. The overall aesthetic is clean, minimalist and professional, utilizing a high-contrast color palette to convey a sense of urgency
Free with trial This minimalist graphic illustration features a clean blue line chart plotted against a simple grid. The line moves upward from left to right, indicating growth and positive progress. The design uses a professional color palette of blue and grey, making it ideal for corporate presentations and financial reports. Plotted vectors A blue line graph showing a positive upward trend on a white background. This minimalist graphic illustration features a clean blue line chart plotted against a. This minimalist graphic illustration features a clean blue line chart plotted against a simple grid. The line moves upward from left to right, indicating growth and positive progress. The design uses a professional color palette of blue and grey, making it ideal for corporate presentations and financial reports
Free with trial A simple vector-style icon on a white background shows a blue L-shaped graph axis with short tick marks and an orange, smooth wave line marked by circular points at its peaks and troughs. An orange crescent moon floats above the graph, linking the plotted pattern to nighttime rest or sleep tracking. The bold, clean shapes and limited palette make the design clear and uncluttered, suggesting a compact visual representation of changing sleep cycles. Plotted vectors Sleep Cycle Wave Graph Vector Icon with Crescent Moon for Night Rest Pattern Tracking. A simple vector-style icon on a white background shows a blue L-shaped. A simple vector-style icon on a white background shows a blue L-shaped graph axis with short tick marks and an orange, smooth wave line marked by circular points at its peaks and troughs. An orange crescent moon floats above the graph, linking the plotted pattern to nighttime rest or sleep tracking. The bold, clean shapes and limited palette make the design clear and uncluttered, suggesting a compact visual representation of changing sleep cycles.
Free with trial This educational graphic displays a comparison between two oscillating wave functions plotted against time. On the right, a circular coordinate system demonstrates the phase shift between the two signals using rotating vectors. The clean white background highlights the red and blue lines, making the mathematical concepts clear and easy to interpret for students and researchers. Plotted vectors A scientific diagram illustrating the relationship between wave functions and phasors. This educational graphic displays a comparison between two oscillating. This educational graphic displays a comparison between two oscillating wave functions plotted against time. On the right, a circular coordinate system demonstrates the phase shift between the two signals using rotating vectors. The clean white background highlights the red and blue lines, making the mathematical concepts clear and easy to interpret for students and researchers
Free with trial Dark blue seismic activity diagram, plotted on a graph, shows radio frequency waves and oscilloscope waveform, representing data analysis and scientific measurement. Plotted vectors Dark blue seismic activity diagram, plotted on a graph, shows radio frequency waves and oscilloscope waveform. Representing data analysis and scientific
Free with trial Data analysis, consumer behavior, sustainability, e-commerce, recycling, environmental awareness. Line graph with plotted points, profile of a woman shopping bag with recycling symbol. Data analysis. Plotted vectors Data Analysis Concept with Line Graph, Woman Profile, and Recycling Shopping Bag Icon. Data analysis, consumer behavior, sustainability, e-commerce, recycling. Data analysis, consumer behavior, sustainability, e-commerce, recycling, environmental awareness. Line graph with plotted points, profile of a woman shopping bag with recycling symbol. Data analysis
 Sign in