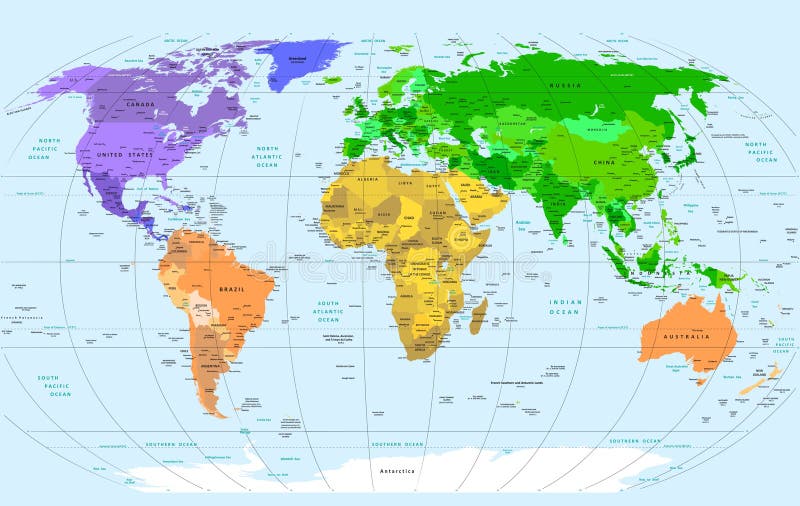
Free with trial Detailed Vector World Map. Layers objects (groups): continents, countries, names of countries, capitals, cites, water resources, meridians. Convenient editing of primary colors. ZIP: eps8 file - meridians in lines. Base map generated using map data from the public domain. - The url of the reference file is : - Software: Xara Designer Pro - Creation date: January, 2012. - Layers of Data Used: Outlines. Primary data vectors Detailed World Map. Detailed Vector World Map. Layers objects (groups): continents, countries, names of countries, capitals, cites, water resources, meridians. Detailed Vector World Map. Layers objects (groups): continents, countries, names of countries, capitals, cites, water resources, meridians. Convenient editing of primary colors. ZIP: eps8 file - meridians in lines. Base map generated using map data from the public domain. - The url of the reference file is : - Software: Xara Designer Pro - Creation date: January, 2012. - Layers of Data Used: Outlines
Free with trial Word cloud - storage. A word cloud of storage related items. Primary data vectors Word cloud - storage. A word cloud of storage related items
Free with trial Evidence-based medicine word collage concept. Vector illustration. Primary data vectors Evidence-based medicine. Word collage concept. Vector illustration
Free with trial Relational database data table related symbol vector illustration concept. Flat. Primary data vectors Relational database data table related symbol vector illustration concept. Flat
Free with trial Education. A globe on a pile of books with its reflection. Primary data vectors Education. A globe on a pile of books with its reflection
Free with trial 5 Elements Diagram with Organs and associated Emotions, Health, Natural Health and Chinese Medecine, Cycle of Life, 4 Seasons. Primary data vectors 5 Elements Diagram with Organs and associated Emotions, Health, Natural Health and Chinese Medecine Illustration. 5 Elements Diagram with Organs and associated. 5 Elements Diagram with Organs and associated Emotions, Health, Natural Health and Chinese Medecine, Cycle of Life, 4 Seasons.
Free with trial Elemental nutritional requirements of plant life, Hand draw chart design vector. Guide of Macronutrients and Micronutrients for Plants. Primary data vectors Guide of Macronutrients and Micronutrients for Plants vector. Elemental nutritional requirements of plant life, Hand draw chart design vector. Guide of. Elemental nutritional requirements of plant life, Hand draw chart design vector. Guide of Macronutrients and Micronutrients for Plants
Free with trial Venn maths vector diagram, color modern icon - white background. Primary data vectors Venn maths vector diagram, color modern icon - white background.
Free with trial Digital geometric data network elements abstract background. Primary colours digital geometric data network elements abstract background. Primary data vectors Digital geometric data network elements abstract background. Primary colours digital geometric data network elements abstract background
Free with trial Primary medical measurements include height, weight, pressure and temperature. Workflow of patient care. Vector illustration in. Tiny style. Primary data vectors Primary medical measurements include height, weight, pressure and temperature. Workflow of patient care. Vector illustration in. Tiny style
Free with trial Calendar 2011, primary colors. Calendar 2011 in primary colors, vector. Primary data vectors Calendar 2011, primary colors. Calendar 2011 in primary colors, vector
Free with trial Opened book and molecular structures. Concept of scientific literature, studies and data, scholarly publication, academic publishing. Creative vector illustration for banner, poster, website. Primary data vectors Opened book and molecular structures. Concept of scientific literature, studies and data, scholarly publication, academic publishing. Creative vector
Free with trial Admission to primary school blank brochure layout design. Enrolling kids. Vertical poster template set with empty copy space for text. Premade corporate reports collection. Editable flyer paper pages. Primary data vectors Admission to primary school blank brochure layout design. Enrolling kids. Vertical poster template set with empty copy space for text. Premade corporate
Free with trial Educational process concept banner with infographic elements. School, college education, preparation for work. Poster template with graphic data visualization, timeline, workflow. Vector illustration. Primary data vectors Educational process concept banner with infographic elements. School, college education, preparation for work. Poster template with graphic data visualization
Free with trial Web buttons. Star shape Web interface button set. Primary data vectors Web buttons. Star shape Web interface button set
Free with trial Background to the frame from flowers for use on various awards, or offer to firms dealing with flowers or congratulations for women and children. Primary data vectors Certificate / Diploma. Background to the frame from flowers for use on various awards, or offer to firms dealing with flowers or congratulations for women and. Background to the frame from flowers for use on various awards, or offer to firms dealing with flowers or congratulations for women and children
Free with trial Learn English with mind map. Irregular Verb. Eps10 vector of Learn English with mind map Irregular Verb. Primary data vectors Learn English with mind map. Irregular Verb. Eps10 vector of Learn English with mind map Irregular Verb
Free with trial Medical Report outline / line flat vector icon - mobile application or button design. Vector design logo for mobile app. Primary data vectors Medical Report outline or line flat vector icon - mobile application or button design - Vector design logo for mobile app. Medical Report outline / line flat. Medical Report outline / line flat vector icon - mobile application or button design. Vector design logo for mobile app
Free with trial This collection presents a carefully designed set of black glyph icons centered on cloud computing concepts, supported by teamwork symbols for wider business and technology projects. Each icon uses a bold solid silhouette with clean edges, balanced proportions and consistent spacing, so the whole sheet looks unified and professional. The primary group covers cloud storage, server, database, upload. Primary data vectors Cloud computing and teamwork icons set, black glyph business symbols. This collection presents a carefully designed set of black glyph icons centered on cloud. This collection presents a carefully designed set of black glyph icons centered on cloud computing concepts, supported by teamwork symbols for wider business and technology projects. Each icon uses a bold solid silhouette with clean edges, balanced proportions and consistent spacing, so the whole sheet looks unified and professional. The primary group covers cloud storage, server, database, upload
Free with trial A clean, black and white silhouette icon set featuring a boy and a girl, both depicted as students. The boy stands on the left, wearing a backpack and holding a book. The girl stands on the right, with her hair in pigtails, also holding a book. This graphic is ideal for representing education, school, learning, and childhood. Its simple, vector-based design makes it versatile for various applications, from websites and presentations to print materials and infographics. Primary data vectors Student Icons: Boy and Girl with Books and Backpacks. A clean, black and white silhouette icon set featuring a boy and a girl, both depicted as students. The boy. A clean, black and white silhouette icon set featuring a boy and a girl, both depicted as students. The boy stands on the left, wearing a backpack and holding a book. The girl stands on the right, with her hair in pigtails, also holding a book. This graphic is ideal for representing education, school, learning, and childhood. Its simple, vector-based design makes it versatile for various applications, from websites and presentations to print materials and infographics.
Free with trial Medical Report outline / line flat vector icon - mobile application or button design. Vector design logo for mobile app. Primary data vectors Medical Report outline or line flat vector icon - mobile application or button design - Vector design logo for mobile app. Medical Report outline / line flat. Medical Report outline / line flat vector icon - mobile application or button design. Vector design logo for mobile app
Free with trial Medical Report outline / line flat vector icon - mobile application or button design. Vector design logo for mobile app. Primary data vectors Medical Report outline or line flat vector icon - mobile application or button design - Vector design logo for mobile app. Medical Report outline / line flat. Medical Report outline / line flat vector icon - mobile application or button design. Vector design logo for mobile app
Free with trial Medical Report outline / line flat vector icon - mobile application or button design. Vector design logo for mobile app. Primary data vectors Medical Report outline or line flat vector icon - mobile application or button design - Vector design logo for mobile app. Medical Report outline / line flat. Medical Report outline / line flat vector icon - mobile application or button design. Vector design logo for mobile app
Free with trial Abstract Infinity Color Concept illustration vector Design template. Suitable for Creative Industry, Multimedia, entertainment, Educations, Shop, and any related business. Primary data vectors Abstract Infinity Color Concept illustration vector. Design template. Suitable for Creative Industry, Multimedia, entertainment, Educations, Shop, and any
Free with trial N, P, K composition decorative label - concentration of nitrogen, phosporous and potassium in gardening fertilizers. Nutrients for Leaves, Flower and Roots. Primary data vectors N, P, K composition label for fertilizers. N, P, K composition decorative label - concentration of nitrogen, phosporous and potassium in gardening fertilizers. N, P, K composition decorative label - concentration of nitrogen, phosporous and potassium in gardening fertilizers. Nutrients for Leaves, Flower and Roots
Free with trial Venn maths vector diagram, color modern icon - white background. Primary data vectors Venn maths vector diagram, color modern icon - white background.
Free with trial Defined benefit pension linear icon. Modern outline Defined benefit pension logo concept on white background from business collection. Suitable for use on web apps, mobile apps and print media. Primary data vectors Defined benefit pension linear icon. Modern outline Defined bene. Fit pension logo concept on white background from business collection. Suitable for use on web. Defined benefit pension linear icon. Modern outline Defined benefit pension logo concept on white background from business collection. Suitable for use on web apps, mobile apps and print media
Free with trial A cartoon illustration of two children in lab coats giving a presentation. Primary data vectors Kids in Science: Cartoon Children Giving a Presentation on a Chart. A cartoon illustration of two children in lab coats giving a presentation. A cartoon illustration of two children in lab coats giving a presentation.
Free with trial Special News rubber stamp. Grunge design with dust scratches. Effects can be easily removed for a clean, crisp look. Color is easily changed. Primary data vectors Special News rubber stamp. Grunge design with dust scratches. Effects can be easily removed for a clean, crisp look. Color is easily changed
Free with trial Special News rubber stamp. Grunge design with dust scratches. Effects can be easily removed for a clean, crisp look. Color is easily changed. Primary data vectors Special News rubber stamp. Grunge design with dust scratches. Effects can be easily removed for a clean, crisp look. Color is easily changed
Free with trial Fundamentals word cloud. Concept. Collage made of words about fundamentals. Vector illustration. Primary data vectors Fundamentals word cloud. Concept. Collage made of words about fundamentals. Vector illustration
Free with trial Grunge black essential word rubber business stamp on white background. Primary data vectors Grunge black essential word rubber business stamp on white background. Grunge black essential word rubber business seal stamp on white background
Free with trial Linear venn diagram icon from Analytics outline collection. Thin line venn diagram vector isolated on white background. venn. Diagram trendy illustration. Primary data vectors Linear venn diagram icon from Analytics outline collection. Thin line venn diagram vector isolated on white background. venn. Diagram trendy illustration
Free with trial Concentration of nitrogen, phosporous and potassium - N, P, K proportions in gardening fertilizers. Nutrients for Leaves, Flower and Roots. Primary data vectors Nitrogen, phosporous, potassium in gardening icons. Concentration of nitrogen, phosporous and potassium - N, P, K proportions in gardening fertilizers. Nutrients. Concentration of nitrogen, phosporous and potassium - N, P, K proportions in gardening fertilizers. Nutrients for Leaves, Flower and Roots
Free with trial Children preschool education tasks vector infographic template. Presentation design elements. Data visualization with 5 steps. Process timeline chart. Workflow layout with linear icons. Primary data vectors Children preschool education tasks vector infographic template. Presentation design elements. Data visualization with 5 steps. Process timeline chart. Workflow
Free with trial Report, medical, health, tick, insurance, umbrella, medical insurance icon. Primary data vectors Report, medical, health, tick, insurance, umbrella, medical insurance icon
Free with trial Defined benefit pension icon. Trendy Defined benefit pension logo concept on white background from business collection. Suitable for use on web apps, mobile apps and print media. Primary data vectors Defined benefit pension icon. Trendy Defined benefit pension log. O concept on white background from business collection. Suitable for use on web apps, mobile
Free with trial Illustration of Oogenesis and spermatogenesis in men and women. the differences, how they work, and explanations. Human anatomy biology. Primary data vectors Oogenesis and spermatogenesis. Illustration of Oogenesis and spermatogenesis in men and women. the differences, how they work, and explanations. Human anatomy. illustration of Oogenesis and spermatogenesis in men and women. the differences, how they work, and explanations. Human anatomy biology
Free with trial Color Wheel on the white background. Color Circle Picker sign. Flat vector Icon for drawing, painting apps and websites. flat style. Primary data vectors Color Wheel on the white background. Color Circle Picker sign. Flat vector Icon for drawing, painting apps and websites. Flat style
Free with trial Important Information sticker isolated on gray background. Simple vector logo. Primary data vectors Important Information sticker isolated on gray background. Simple vector logo
Free with trial Contemporary mother with book sitting on stool and listening to daughter reciting homework assignment while preforming family education at home. Home schooling, home education concept. Primary data vectors Mother tutoring daughter at home. Flat vector illustration. Contemporary mother with book sitting on stool and listening to daughter reciting homework assignment. Contemporary mother with book sitting on stool and listening to daughter reciting homework assignment while preforming family education at home. Home schooling, home education concept
Free with trial On a white background map of Ireland with the border between northern Ireland and the Republic. The two primary colors are orange and green. Primary data vectors Map of the Irish state on a white background. General information division of territory. Vector illustration. On a white background map of Ireland with the. On a white background map of Ireland with the border between northern Ireland and the Republic. The two primary colors are orange and green.
Free with trial A comprehensive educational research methodology diagram comparing primary data and secondary data collection methods. Detailing primary data collected directly from original sources tailored to specific objectives versus secondary data drawn from previously available records, publications, and existing information for cost-effective research. Ideal for academic research manuals, university courseware, and data collection technique infographics. Primary data vectors Primary Data vs Secondary Data Collection Methods Diagram. A comprehensive educational research methodology diagram comparing primary data and secondary data. A comprehensive educational research methodology diagram comparing primary data and secondary data collection methods. Detailing primary data collected directly from original sources tailored to specific objectives versus secondary data drawn from previously available records, publications, and existing information for cost-effective research. Ideal for academic research manuals, university courseware, and data collection technique infographics.
Free with trial The image features a minimalist cloud security and data protection icon set against a solid white background. The primary graphic. Consists of a puffy. Primary data vectors The image features a minimalist cloud security and data protection icon set against a solid white background. The primary graphic. Consists of a puffy
Free with trial A detailed screen displaying various weather and radar data including primary, secondary, air, and thermal information. The primary radar shows a green terrain map with radar signals, the secondary radar displays aircraft targets, the air data section shows a list of aircraft with their respective altitudes and speeds, and the thermal section shows a heat map of weather patterns. Primary data vectors Advanced radar and weather monitoring system displaying primary, secondary, air, and thermal data on a screen. A detailed screen displaying various weather and. A detailed screen displaying various weather and radar data including primary, secondary, air, and thermal information. The primary radar shows a green terrain map with radar signals, the secondary radar displays aircraft targets, the air data section shows a list of aircraft with their respective altitudes and speeds, and the thermal section shows a heat map of weather patterns
Free with trial A filled out questionnaire the results of which will be used as primary data for economic analysis highlighting the various ways data can be collected and analyzed.. Vector illustration. Primary data vectors A filled out questionnaire the results of which will be used as primary data for economic analysis highlighting the. Various ways data can be collected and. A filled out questionnaire the results of which will be used as primary data for economic analysis highlighting the various ways data can be collected and analyzed.. Vector illustration
Free with trial Database Replication and Synchronization Illustration. Simple line art depicting database servers with replication and synchronization processes, showing data transfer between primary and secondary storage units. Primary data vectors Synchronization processes, showing data transfer between primary and secondary storage units. Generative AI. Database Replication and Synchronization. Database Replication and Synchronization Illustration. Simple line art depicting database servers with replication and synchronization processes, showing data transfer between primary and secondary storage units.
Free with trial The image depicts a centralized data center with a main building at the center, surrounded by multiple interconnected nodes. The central building is likely the primary server or data hub, while the surrounding nodes represent various connected devices or external servers. The network is illustrated with lines connecting the central building to the nodes, indicating data flow or communication. Primary data vectors Centralized data center network. The image depicts a centralized data center with a main building at the center, surrounded by multiple interconnected nodes. The. The image depicts a centralized data center with a main building at the center, surrounded by multiple interconnected nodes. The central building is likely the primary server or data hub, while the surrounding nodes represent various connected devices or external servers. The network is illustrated with lines connecting the central building to the nodes, indicating data flow or communication
Free with trial The image features an editable icon with a primary bar graph displaying an upward trend. The main bar graph shows a clear increase in data over time, represented by four bars of increasing height. Below the main bar graph, there are three smaller icons: a simple line graph, a scatter plot, and another bar graph with error bars. The text 'EDITABLE ICON' is prominently displayed at the top,. Primary data vectors Editable icon representing growth and data analysis. The image features an editable icon with a primary bar graph displaying an upward trend. The main bar graph. The image features an editable icon with a primary bar graph displaying an upward trend. The main bar graph shows a clear increase in data over time, represented by four bars of increasing height. Below the main bar graph, there are three smaller icons: a simple line graph, a scatter plot, and another bar graph with error bars. The text 'EDITABLE ICON' is prominently displayed at the top,
Free with trial A detailed vector illustration outlining research methodology, specifically focusing on primary and secondary source analysis. Figures interact with various documents, representing the critical evaluation of historical or academic data. Ideal for academic presentations, research guides, educational materials, and scholarly content on data analysis. vector design Generative AI. Primary data vectors Research Methodology: Primary Secondary Source Analysis, vector design Generative AI. A detailed vector illustration outlining research methodology, specifically. A detailed vector illustration outlining research methodology, specifically focusing on primary and secondary source analysis. Figures interact with various documents, representing the critical evaluation of historical or academic data. Ideal for academic presentations, research guides, educational materials, and scholarly content on data analysis. vector design Generative AI
Free with trial A clear isometric illustration detailing a high availability architecture where user traffic is directed to a primary region supported by data replication a failover trigger mechanism and a secondary region for continuous operation. Primary data vectors Isometric Diagram of Cloud Disaster Recovery with Regional Failover and Data Replication Concept. A clear isometric illustration detailing a high availability. A clear isometric illustration detailing a high availability architecture where user traffic is directed to a primary region supported by data replication a failover trigger mechanism and a secondary region for continuous operation
Free with trial This detailed futuristic tactical overlay interface features data panels showing atmospheric conditions, propulsion. Primary data vectors Futuristic tactical heads-up display interface showing atmospheric data, targeting, and primary scan results. This detailed futuristic tactical overlay interface. This detailed futuristic tactical overlay interface features data panels showing atmospheric conditions, propulsion
Free with trial This flat vector illustration features a financial candlestick chart set against a clean white background. The composition includes red and green vertical bars representing price fluctuations, overlaid with a dynamic blue trend line. At the bottom, a small green bar chart indicates trading volume, completing the data visualization. The bright primary colors create a clear, professional and. Primary data vectors Professional financial data visualization with candlestick bars and trend lines. This flat vector illustration features a financial candlestick chart set against. This flat vector illustration features a financial candlestick chart set against a clean white background. The composition includes red and green vertical bars representing price fluctuations, overlaid with a dynamic blue trend line. At the bottom, a small green bar chart indicates trading volume, completing the data visualization. The bright primary colors create a clear, professional and
Free with trial This flat vector graphic depicts a central blue hexagon containing a stylized person icon, which serves as a hub for various colorful circular nodes. Lines radiate outward from the center to connect with these smaller circles, representing a network, communication, or data distribution system. The design uses a clean, minimalist aesthetic with vibrant primary and secondary colors against a plain. Primary data vectors A digital illustration showing a central user icon connected to multiple data nodes. This flat vector graphic depicts a central blue hexagon containing a. This flat vector graphic depicts a central blue hexagon containing a stylized person icon, which serves as a hub for various colorful circular nodes. Lines radiate outward from the center to connect with these smaller circles, representing a network, communication, or data distribution system. The design uses a clean, minimalist aesthetic with vibrant primary and secondary colors against a plain
Free with trial A clear vector icon of a desktop keyboard, symbolizing typing, data entry, computing, and digital input. Perfect for office productivity, coding, online learning, or technical support. It represents the primary tool for interacting with digital information, vector design Generative AI. Primary data vectors Desktop Keyboard Icon for Typing and Data Entry, vector design Generative AI. A clear vector icon of a desktop keyboard, symbolizing typing, data entry. A clear vector icon of a desktop keyboard, symbolizing typing, data entry, computing, and digital input. Perfect for office productivity, coding, online learning, or technical support. It represents the primary tool for interacting with digital information, vector design Generative AI
Free with trial Diagram featuring a blue cloud icon connected to four blocks via dashed lines, illustrating a network or system structure. The blocks are arranged in a horizontal line beneath the cloud, with three red blocks and one green block in the center. The design likely represents data flow, storage, or hierarchy, emphasizing cloud computing or data management concepts. The simple, flat art style uses primary colors for clear visual distinction. Primary data vectors Cloud computing network vector with blue cloud and connected squares, server architecture icon for data sharing & IT systems. Diagram featuring a blue cloud icon. Diagram featuring a blue cloud icon connected to four blocks via dashed lines, illustrating a network or system structure. The blocks are arranged in a horizontal line beneath the cloud, with three red blocks and one green block in the center. The design likely represents data flow, storage, or hierarchy, emphasizing cloud computing or data management concepts. The simple, flat art style uses primary colors for clear visual distinction.
Free with trial A symbolic balance scale hovers above geometric planes, weighing a glowing data center against community infrastructure elements. Bold saturated primary colors define each side in clean mid-century modern forms without shadows or gradients. Perfect for technology balance concepts and urban planning presentations. Generated with AI. Primary data vectors Balance Scale With Glowing Data Structure And Community Elements Floating On Geometric Planes. A symbolic balance scale hovers above geometric planes, weighing a. A symbolic balance scale hovers above geometric planes, weighing a glowing data center against community infrastructure elements. Bold saturated primary colors define each side in clean mid-century modern forms without shadows or gradients. Perfect for technology balance concepts and urban planning presentations. Generated with AI
Free with trial This technical vector illustration visualizes the critical process of automated cloud disaster recovery where continuous data replication ensures synchronization and a seamless DNS failover redirects traffic instantly when a server outage occurs in the primary computing region. Primary data vectors Cloud Disaster Recovery Architecture Diagram High Availability Infrastructure Solution with DNS Failover and Data Replication betw. This technical vector. This technical vector illustration visualizes the critical process of automated cloud disaster recovery where continuous data replication ensures synchronization and a seamless DNS failover redirects traffic instantly when a server outage occurs in the primary computing region.
Free with trial Collection of various charts and graphs, including pie charts, bar charts, line graphs, and circular diagrams. Primary colors are blue, orange, and black, creating a cohesive visual theme. Top left features a segmented circle with percentage labels. Several vertical bar graphs depict data distribution. A line chart showcases data trends over time, with dots marking data points. Simple icons and circular indicators are present for additional information. Ideal for presenting statistical data clearly and effectively. Primary data vectors Comprehensive set of charts, graphs, and icons for data visualization. Collection of various charts and graphs, including pie charts, bar charts, line graphs. Collection of various charts and graphs, including pie charts, bar charts, line graphs, and circular diagrams. Primary colors are blue, orange, and black, creating a cohesive visual theme. Top left features a segmented circle with percentage labels. Several vertical bar graphs depict data distribution. A line chart showcases data trends over time, with dots marking data points. Simple icons and circular indicators are present for additional information. Ideal for presenting statistical data clearly and effectively.
Free with trial Primary stakeholders concept. Team evaluates financial growth through data analysis, focusing on key investment strategies. Flat vector illustration. Primary data vectors Primary stakeholders concept. Team evaluates. Financial growth through data analysis, focusing on key investment strategies. Flat vector illustration
Free with trial Flat style 2D illustration Illustration of a cloud based data replication and failover system showcasing primary and secondary regions DNS servers and control plane replication. Primary data vectors Cloud Data Replication and Failover Mechanism Diagram Flat style 2D illustration. Flat style 2D illustration Illustration of a cloud based data replication and. Flat style 2D illustration Illustration of a cloud based data replication and failover system showcasing primary and secondary regions DNS servers and control plane replication
Free with trial A clear illustrative diagram showcasing a primary database system with multiple read replicas and its connection to a user application demonstrating data flow and replication architecture. Primary data vectors Database Replication Diagram Primary Database with Multiple Read Replicas and User Application. A clear illustrative diagram showcasing a primary database system. A clear illustrative diagram showcasing a primary database system with multiple read replicas and its connection to a user application demonstrating data flow and replication architecture
Free with trial Primary maintenance forms infographic 5 steps. Strategic asset protection workflows. Enterprise asset reliability. Infochart template. Editable vector info graphics with icons. Data visualization. Primary data vectors Primary maintenance forms infographic 5 steps. Strategic asset protection workflows. Enterprise asset reliability. Infochart template. Editable vector info
Free with trial Data sync and replication between servers on a circuit board, workflow vector illustration. Flat vector illustration. Primary data vectors Data sync and replication between servers on a circuit board. Workflow vector illustration. Flat vector illustration
Free with trial This bright orange background displays several minimalist flat shapes arranged in clean layout. Symbols include yellow dialogue box, rectangular brackets, simple liquid droplet, partial circular slice, plus sharp electrical bolt. Such creative elements provide versatile visual components for various interface designs, effectively conveying abstract concepts through primary colors while maintaining. Primary data vectors Minimalist geometric shapes representing communication and data on orange. This bright orange background displays several minimalist flat shapes arranged in. This bright orange background displays several minimalist flat shapes arranged in clean layout. Symbols include yellow dialogue box, rectangular brackets, simple liquid droplet, partial circular slice, plus sharp electrical bolt. Such creative elements provide versatile visual components for various interface designs, effectively conveying abstract concepts through primary colors while maintaining
Free with trial This image features a document with bold text indicating financial data. The primary heading is 'PAYSTUB', suggesting a record of earnings. Below this, numerical figures and currency symbols are presented, likely representing amounts and denominations. The overall composition is clean and minimalist, with text arranged centrally on a plain background, conveying a sense of official record-keeping. Primary data vectors A document displaying financial information and payment details. This image features a document with bold text indicating financial data. The primary heading is. This image features a document with bold text indicating financial data. The primary heading is 'PAYSTUB', suggesting a record of earnings. Below this, numerical figures and currency symbols are presented, likely representing amounts and denominations. The overall composition is clean and minimalist, with text arranged centrally on a plain background, conveying a sense of official record-keeping
Free with trial This minimalist graphic depicts a central circular icon representing a primary hub, surrounded by smaller circular icons representing individual users or nodes. Curved lines and arrows extend from the center to the outer elements, symbolizing data flow, communication, or network connectivity. The color palette uses clean shades of blue and green against a plain white background to convey a. Primary data vectors A flat vector illustration showing a central hub connecting to various user nodes. This minimalist graphic depicts a central circular icon representing a primary. This minimalist graphic depicts a central circular icon representing a primary hub, surrounded by smaller circular icons representing individual users or nodes. Curved lines and arrows extend from the center to the outer elements, symbolizing data flow, communication, or network connectivity. The color palette uses clean shades of blue and green against a plain white background to convey a
Free with trial Set of colorful icons for data management tasks in soft rounded style. AI generated icons. Primary data vectors Set of colorful icons for data management tasks in soft rounded style. AI generated icons
 Sign in