Free with trial Set of circle percentage diagrams from 0 to 100 for web design, user UI interface or infographic - indicator with blue color. Vector illustration. Progressive plan vectors Set of circle percentage diagrams from 0 to 100 for web design, user UI interface or infographic - indicator with blue color. Vector illustration
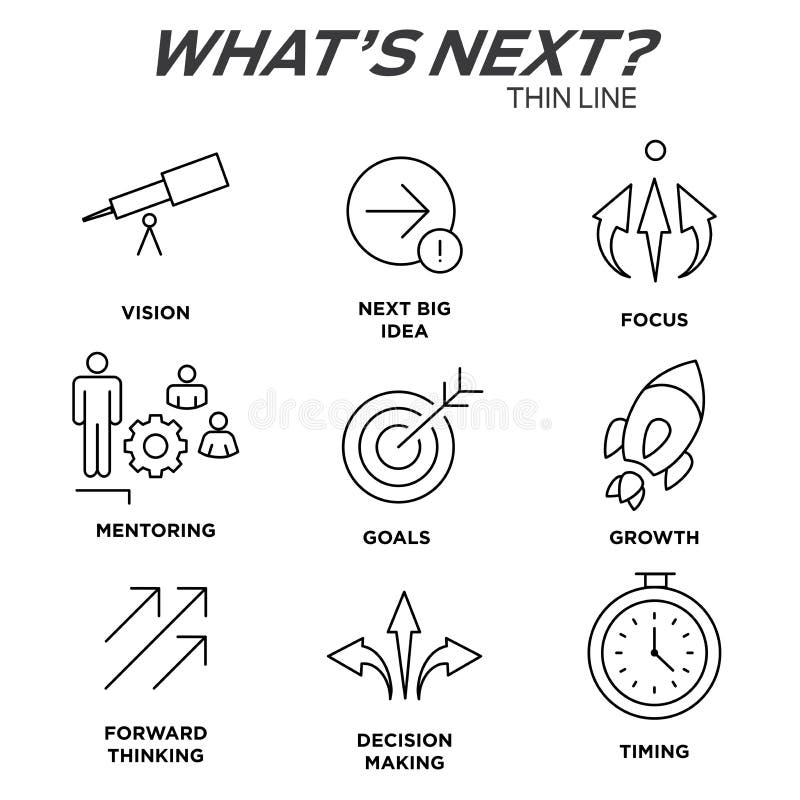
Free with trial What`s Next Icon Set. With Big Idea, Mentoring, Decision Making, and Forward Thinking etc Icons. Progressive plan vectors What`s Next Icon Set. With Big Idea, Mentoring, Decision Making, and Forward Thinking etc Icons
Free with trial What`s Next Icon Set. With Big Idea, Mentoring, Decision Making, and Forward Thinking etc Icons. Progressive plan vectors What`s Next Icon Set. With Big Idea, Mentoring, Decision Making, and Forward Thinking etc Icons
Free with trial Business diagram - progress, growth trend. Progressive block and arrow diagram - 3D. Success in business. Vector Illustration. Progressive plan vectors Business diagram - progress, growth trend. Progressive block and arrow diagram - 3D. Success in business. Vector Illustration
Free with trial Business Success Concept. Background with stair and red arrow. Progressive plan vectors Business Success Concept. Background with stair and red arrow
Free with trial What`s Next Icon Set with Big Idea, Mentoring, Decision Making,. And Forward Thinking etc Icons. Progressive plan vectors What`s Next Icon Set with Big Idea, Mentoring, Decision Making,. And Forward Thinking etc Icons
Free with trial What`s Next Icon Set with Big Idea, Mentoring, Decision Making,. And Forward Thinking etc Icons. Progressive plan vectors What`s Next Icon Set with Big Idea, Mentoring, Decision Making,. And Forward Thinking etc Icons
Free with trial Implementation Word Cloud. On a White Background. Progressive plan vectors Implementation Word Cloud. On a White Background
Free with trial Set of circle percentage diagrams from 0 to 100. For web design, user interface UI or infographic - indicator with green. Progressive plan vectors Set of circle percentage diagrams from 0 to 100. For web design, user interface UI or infographic - indicator with green
Free with trial Set of circle percentage diagrams from 0 to 100. Ready-to-use for web design, user interface UI or infographic - indicator with green. Progressive plan vectors Set of circle percentage diagrams from 0 to 100. Ready-to-use for web design, user interface UI or infographic - indicator with green
Free with trial Set of circular sector percentage diagrams meters from 0 to 100 ready-to-use for web design, user interface UI or infographic - indicator with red. Progressive plan vectors Set of circular sector percentage diagrams from 0 to 100. Set of circular sector percentage diagrams meters from 0 to 100 ready-to-use for web design, user. Set of circular sector percentage diagrams meters from 0 to 100 ready-to-use for web design, user interface UI or infographic - indicator with red
Free with trial Set of circular sector percentage diagrams from 0 to 100 ready-to-use for web design, user interface UI or infographic - indicator with gradient from cyan blue to yellow. Progressive plan vectors Set of circular sector percentage diagrams from 0 to 100. Ready-to-use for web design, user interface UI or infographic - indicator with gradient from cyan blue
Free with trial Infographic elements, timeline of progressive business development with icons and 3 steps options. Business process, thin line. Progressive plan vectors Infographic elements, timeline of progressive business development with icons and 3 steps options. Business process. Thin line
Free with trial Growth of progressive business. Businessman walk on growth of progressive business. Progressive plan vectors Growth of progressive business. Businessman walk on growth of progressive business
Free with trial Businessman walk - progressive business. Businessman walk on growth of progressive business. Progressive plan vectors Businessman walk - progressive business. Businessman walk on growth of progressive business
Free with trial Growth of progressive business. Design template, Running businessman on growth of progressive business, vector illustration. Progressive plan vectors Growth of progressive business. Design template, Running businessman on growth of progressive business, vector illustration
Free with trial Growth of progressive business. Design template, Running businessman on growth of progressive business, vector illustration. Progressive plan vectors Growth of progressive business. Design template, Running businessman on growth of progressive business, vector illustration
Free with trial Vector circular infographic template. A pie chart, chart, plan, or business concept in three parts. Flat style. Progressive plan vectors Vector circular infographic template. A pie chart, chart, plan, or business concept in three parts. Flat style
Free with trial A personalized nutrition plan for those with Parkinsons disease incorporating antioxidants and antiinflammatory foods to support brain health and motor function.. Vector illustration. Progressive plan vectors A personalized nutrition plan for those with Parkinsons disease incorporating antioxidants and antiinflammatory foods to. Support brain health and motor. A personalized nutrition plan for those with Parkinsons disease incorporating antioxidants and antiinflammatory foods to support brain health and motor function.. Vector illustration
Free with trial Vector circular infographic template. A pie chart, chart, plan, or business concept in three parts. Flat style. Progressive plan vectors Vector circular infographic template. A pie chart, chart, plan, or business concept in three parts. Flat style
Free with trial Smart home modern house scheme concept. Flat style floor plan with device sensor communication schematic sketch drawing. Progressive plan vectors Smart home modern house scheme concept. Flat style floor plan with device sensor communication schematic sketch drawing
Free with trial Infographic elements, timeline of progressive business development with icons and 5 steps options. Business process, thin line. Vector illustration. Progressive plan vectors Infographic elements, timeline of progressive business development with icons and 5 steps options. Business process, thin line. Vector illustration
Free with trial Six colorful square elements with thin line symbols inside and pointers connected into row. Concept of 6 successive steps of strategic plan. Creative infographic design template. Vector illustration. Progressive plan vectors Creative infographic design template. Six colorful square elements with thin line symbols inside and pointers connected into row. Concept of 6 successive steps. Six colorful square elements with thin line symbols inside and pointers connected into row. Concept of 6 successive steps of strategic plan. Creative infographic design template. Vector illustration.
Free with trial Five square speech bubbles with linear symbols inside and text boxes placed into horizontal row. Concept of 5 steps of progressive development. Modern infographic design template. Vector illustration. Progressive plan vectors Modern Infographic Template. Five square speech bubbles with linear symbols inside and text boxes placed into horizontal row. Concept of 5 steps of progressive. Five square speech bubbles with linear symbols inside and text boxes placed into horizontal row. Concept of 5 steps of progressive development. Modern infographic design template. Vector illustration.
Free with trial Startup projects, successful business, digital marketing. Innovative growth, achievement of goals, progressive development of business, project promotion through social network. Vector illustration. Progressive plan vectors Startup projects, successful business, digital marketing. Achievement of high goals. Startup projects, successful business, digital marketing. Innovative growth. Startup projects, successful business, digital marketing. Innovative growth, achievement of goals, progressive development of business, project promotion through social network. Vector illustration.
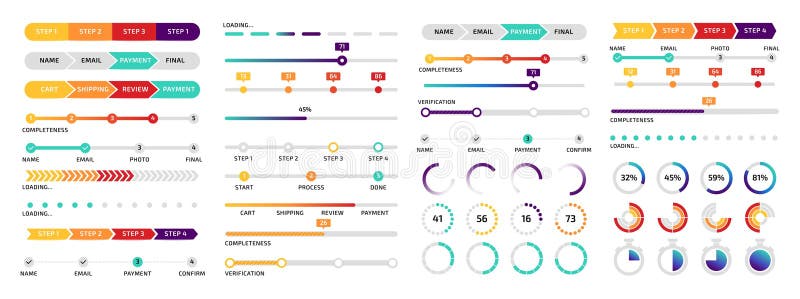
Free with trial Infographic design. Circle and line processing charts. Sequence steps. Loading diagram with percent numbers. Business presentation. Statistic scheme. Vector progressive data indicator elements set. Progressive plan vectors Infographic design. Circle and line charts. Sequence steps. Loading diagram with percent numbers. Business presentation. Infographic design. Circle and line. Infographic design. Circle and line processing charts. Sequence steps. Loading diagram with percent numbers. Business presentation. Statistic scheme. Vector progressive data indicator elements set
Free with trial A group of neurologists radiologists and surgeons are discussing the best surgical approach for a patient with a brain tumor. They carefully plan out the considering potential. Vector. Progressive plan vectors A group of neurologists radiologists and surgeons are discussing the best surgical approach for a patient with a brain. Tumor. They carefully plan out the. A group of neurologists radiologists and surgeons are discussing the best surgical approach for a patient with a brain tumor. They carefully plan out the considering potential. Vector
Free with trial Start. Manager, an employee starts, starts a new business. Progressive plan vectors Start. Manager, an employee starts, starts a new business
Free with trial Layout page of business graph collection. Modern scheme, page structure with text fields, speech bubbles and charts. Progressive plan vectors Layout page of business graph collection. Modern scheme, page structure with text fields, speech bubbles and charts
Free with trial Layout page of business graph collection. Modern scheme, page structure with text fields, speech bubbles and charts. Progressive plan vectors Layout page of business graph collection. Modern scheme, page structure with text fields, speech bubbles and charts
Free with trial Flat infographic collection of charts, graphs, speech bubbles, schemes, diagrams. Trend color set. Rectangle design. Progressive plan vectors Flat infographic collection. Of charts, graphs, speech bubbles, schemes, diagrams. Trend color set. Rectangle design
Free with trial Hand drawn progress concept illustrated by buildings going from very poor to very rich To be used as a concept for progress, architecture trends, wealth and the accumulation of it, time and the stockmarket and many more. Progressive plan vectors Progress. Hand drawn progress concept illustrated by buildings going from very poor to very rich To be used as a concept for progress, architecture trends. Hand drawn progress concept illustrated by buildings going from very poor to very rich To be used as a concept for progress, architecture trends, wealth and the accumulation of it, time and the stockmarket and many more
Free with trial Layout page of business graph collection. Modern scheme, page structure with text fields, speech bubbles and charts. Progressive plan vectors Layout page of business graph collection. Modern scheme, page structure with text fields, speech bubbles and charts
Free with trial Abstract business concept. Background with stair and red arrow. Progressive plan vectors Abstract business concept. Background with stair and red arrow
Free with trial Layout page of business graph collection. Modern scheme, page structure with text fields, speech bubbles and charts. Progressive plan vectors Layout page of business graph collection. Modern scheme, page structure with text fields, speech bubbles and charts
Free with trial Alternative energy efficient eco nature friendly home. Scheme of electricity flow sun wind water collection. Progressive plan vectors Energy efficient eco nature friendly home flat 3d vector. Alternative energy efficient eco nature friendly home. Scheme of electricity flow sun wind water. Alternative energy efficient eco nature friendly home. Scheme of electricity flow sun wind water collection.
Free with trial A diagram showing increasing dose of alcohol in the blood and various stages of alterations in motor coordination. Progressive plan vectors Alcohol effect illustration. A diagram showing increasing dose of alcohol in the blood and various stages of alterations in motor coordination. A diagram showing increasing dose of alcohol in the blood and various stages of alterations in motor coordination.
Free with trial What`s Next Icon Set with Big Idea, Mentoring, Decision Making,. And Forward Thinking etc Icons. Progressive plan vectors What`s Next Icon Set with Big Idea, Mentoring, Decision Making,. And Forward Thinking etc Icons
Free with trial Business man presenting a statistics with pencils. Vector illustration, eps10, business man with pencils. Progressive plan vectors Business man presenting a statistics with pencils. Vector illustration, eps10, business man with pencils
Free with trial Money solution. Illustration of money solution show with money cartoon character bring golden key. Progressive plan vectors Money solution. Illustration of money solution show with money cartoon character bring golden key
Free with trial What`s Next Icon Set. With Big Idea, Mentoring, Decision Making, and Forward Thinking etc Icons. Progressive plan vectors What`s Next Icon Set. With Big Idea, Mentoring, Decision Making, and Forward Thinking etc Icons
Free with trial Five paper white circular elements with thin line icons inside connected into horizontal row. 5 steps of project development. Creative infographic design template. Vector illustration for brochure. Progressive plan vectors Modern infographic design template. Five paper white circular elements with thin line icons inside connected into horizontal row. 5 steps of project development. Five paper white circular elements with thin line icons inside connected into horizontal row. 5 steps of project development. Creative infographic design template. Vector illustration for brochure.
Free with trial Seven paper white overlapping arrows placed in horizontal row. Concept of 7 successive steps of progressive business development. Simple infographic design template. Abstract vector illustration. Progressive plan vectors Modern Infographic Template. Seven paper white overlapping arrows placed in horizontal row. Concept of 7 successive steps of progressive business development. Seven paper white overlapping arrows placed in horizontal row. Concept of 7 successive steps of progressive business development. Simple infographic design template. Abstract vector illustration.
Free with trial Online business. Illustration of cartoon character businessman making money online. Progressive plan vectors Online business. Illustration of cartoon character businessman making money online
Free with trial Diagram with six cards or rectangular frames placed in horizontal row. Business model with 6 stages of progressive development. Flat infographic design layout. Vector illustration for presentation. Progressive plan vectors Modern Infographic Template. Diagram with six cards or rectangular frames placed in horizontal row. Business model with 6 stages of progressive development. Flat. Diagram with six cards or rectangular frames placed in horizontal row. Business model with 6 stages of progressive development. Flat infographic design layout. Vector illustration for presentation.
Free with trial Horizontal chain with 5 connected round paper white links. Concept of five steps of progressive business development. Flat infographic design template. Clean vector illustration for presentation. Progressive plan vectors Modern Vector Infographic Template. Horizontal chain with 5 connected round paper white links. Concept of five steps of progressive business development. Flat. Horizontal chain with 5 connected round paper white links. Concept of five steps of progressive business development. Flat infographic design template. Clean vector illustration for presentation.
Free with trial Triangle divided into 5 numbered pieces, thin line icons and place for text. Pyramid business model with five levels. Creative infographic design template. Vector illustration for presentation. Progressive plan vectors Modern Infographic Template. Triangle divided into 5 numbered pieces, thin line icons and place for text. Pyramid business model with five levels. Creative. Triangle divided into 5 numbered pieces, thin line icons and place for text. Pyramid business model with five levels. Creative infographic design template. Vector illustration for presentation.
Free with trial Four paper white overlapping arrows placed in horizontal row. Concept of 4 successive steps of progressive business development. Simple infographic design template. Abstract vector illustration. Progressive plan vectors Modern Infographic Template. Four paper white overlapping arrows placed in horizontal row. Concept of 4 successive steps of progressive business development. Four paper white overlapping arrows placed in horizontal row. Concept of 4 successive steps of progressive business development. Simple infographic design template. Abstract vector illustration.
Free with trial Linear infographic design template with three elements placed into horizontal row. Concept of 3 successive steps of business development. Vector illustration for process diagram, progress chart. Progressive plan vectors Modern Infographic Template. Linear infographic design template with three elements placed into horizontal row. Concept of 3 successive steps of business. Linear infographic design template with three elements placed into horizontal row. Concept of 3 successive steps of business development. Vector illustration for process diagram, progress chart.
Free with trial Four square elements connected by arrow. Horizontal timeline with 4 steps or stages. Infographic design template. Vector illustration for business development process visualization, progress bar. Progressive plan vectors Modern Infographic Template. Four square elements connected by arrow. Horizontal timeline with 4 steps or stages. Infographic design template. Vector. Four square elements connected by arrow. Horizontal timeline with 4 steps or stages. Infographic design template. Vector illustration for business development process visualization, progress bar.
Free with trial Horizontal flow chart with 4 round elements connected by arrows. Concept of four stages of progressive development. Minimal infographic design template. Flat vector illustration for presentation. Progressive plan vectors Modern Infographic Vector Template. Horizontal flow chart with 4 round elements connected by arrows. Concept of four stages of progressive development. Minimal. Horizontal flow chart with 4 round elements connected by arrows. Concept of four stages of progressive development. Minimal infographic design template. Flat vector illustration for presentation.
Free with trial Flying spaceship and 6 round elements with letters inside arranged in circle and successively connected by arrows. Concept of development cycle. Infographic design template. Vector illustration. Progressive plan vectors Modern Infographic Vector Template. Flying spaceship and 6 round elements with letters inside arranged in circle and successively connected by arrows. Concept of. Flying spaceship and 6 round elements with letters inside arranged in circle and successively connected by arrows. Concept of development cycle. Infographic design template. Vector illustration.
Free with trial Sustainability word cloud. Concept. Vector illustration. Progressive plan vectors Sustainability word cloud. Concept. Vector illustration
Free with trial Set of pie chart in percentage from 1 to 100. For web design, user interface UI or infographic - red, yellow, green, blue, purple and gray. Progressive plan vectors Set of pie chart in percentage from 1 to 100. For web design, user interface UI or infographic - red, yellow, green, blue, purple and gray
Free with trial Set of circle percentage diagrams from 0 to 100. Ready-to-use for web design, user interface UI or infographic - indicator with green. Progressive plan vectors Set of circle percentage diagrams from 0 to 100. Ready-to-use for web design, user interface UI or infographic - indicator with green
Free with trial Loading pie charts set. A set of circles from 0 to 100 percent. Vector illustration. Progressive plan vectors Loading circles from 0 to 100 percent. Loading pie charts set. A set of circles from 0 to 100 percent. Vector illustration. Loading pie charts set. A set of circles from 0 to 100 percent. Vector illustration.
Free with trial Illustration of triangle infographic consists of three color parts with simple signs inside on white background and space for your own text. Progressive plan vectors Infographic with triangle shape. Illustration of triangle infographic consists of three color parts with simple signs inside on white background and space for. Illustration of triangle infographic consists of three color parts with simple signs inside on white background and space for your own text
Free with trial Set of circular sector percentage diagrams meters from 0 to 100 ready-to-use for web design, user interface UI or infographic - indicator with yellow. Progressive plan vectors Set of circular sector arc percentage diagrams. Set of circular sector percentage diagrams meters from 0 to 100 ready-to-use for web design, user interface UI or. Set of circular sector percentage diagrams meters from 0 to 100 ready-to-use for web design, user interface UI or infographic - indicator with yellow
Free with trial Next Logo. Logo vector illustration, can be used for any purpose. Progressive plan vectors Next Logo. Logo vector illustration, can be used for any purpose
Free with trial Next Logo. Logo vector illustration, can be used for any purpose. Progressive plan vectors Next Logo. Logo vector illustration, can be used for any purpose
Free with trial Set of circle percentage diagrams from 0 to 100. Ready-to-use for web design, user interface UI or infographic - indicator with green. Progressive plan vectors Set of circle percentage diagrams from 0 to 100. Ready-to-use for web design, user interface UI or infographic - indicator with green
Free with trial Set of circular sector percentage diagrams meters from 0 to 100 ready-to-use for web design, user interface UI or infographic - indicator with red. Progressive plan vectors Set of circular sector percentage diagrams from 0 to 100. Set of circular sector percentage diagrams meters from 0 to 100 ready-to-use for web design, user. Set of circular sector percentage diagrams meters from 0 to 100 ready-to-use for web design, user interface UI or infographic - indicator with red
Free with trial Set of circular sector percentage diagrams from 0 to 100. Ready-to-use for web design, user interface UI or infographic - indicator with pink. Progressive plan vectors Set of circular sector percentage diagrams from 0 to 100. Ready-to-use for web design, user interface UI or infographic - indicator with pink
Free with trial Set of circle percentage diagrams from 0 to 100 for infographics, 3D design. Progressive plan vectors Set of circle percentage diagrams from 0 to 100 for infographics. 3D design
Free with trial Set of circle percentage diagrams from 0 to 100. Ready-to-use for web design, user interface UI or infographic - indicator with blue. Progressive plan vectors Set of circle percentage diagrams from 0 to 100. Ready-to-use for web design, user interface UI or infographic - indicator with blue
Free with trial Set of circle percentage diagrams from 0 to 100. Ready-to-use for web design, user interface UI or infographic - indicator with blue. Progressive plan vectors Set of circle percentage diagrams from 0 to 100. Ready-to-use for web design, user interface UI or infographic - indicator with blue
Free with trial Set of circle percentage diagrams from 0 to 100. Ready-to-use for web design, user interface UI or infographic - indicator with green. Progressive plan vectors Set of circle percentage diagrams from 0 to 100. Ready-to-use for web design, user interface UI or infographic - indicator with green
Free with trial Set of circular sector percentage diagrams from 0 to 100. Ready-to-use for web design, user interface UI or infographic - indicator with yellow. Progressive plan vectors Set of circular sector percentage diagrams from 0 to 100. Ready-to-use for web design, user interface UI or infographic - indicator with yellow
Free with trial Five circular paper white elements with thin line icons inside, colorful translucent stripe curving around it and text boxes. Realistic infographic design template. Modern vector illustration. Progressive plan vectors Modern infographic design template. Five circular paper white elements with thin line icons inside, colorful translucent stripe curving around it and text boxes. Five circular paper white elements with thin line icons inside, colorful translucent stripe curving around it and text boxes. Realistic infographic design template. Modern vector illustration.
Free with trial Set of circular sector percentage diagrams from 0 to 100. Ready-to-use for web design, user interface UI or infographic - indicator with green. Progressive plan vectors Set of circular sector percentage diagrams from 0 to 100. Ready-to-use for web design, user interface UI or infographic - indicator with green
Free with trial Set of circular sector percentage diagrams from 0 to 100. Ready-to-use for web design, user interface UI or infographic - indicator with blue. Progressive plan vectors Set of circular sector percentage diagrams from 0 to 100. Ready-to-use for web design, user interface UI or infographic - indicator with blue
Free with trial Horizontal stripe or timeline divided into arrow-like parts with year indication inside. Concept of annual development of company. Infographic design template. Vector illustration for presentation. Progressive plan vectors Infographic design template. Horizontal stripe or timeline divided into arrow-like parts with year indication inside. Concept of annual development of company. Horizontal stripe or timeline divided into arrow-like parts with year indication inside. Concept of annual development of company. Infographic design template. Vector illustration for presentation.
Free with trial Curved line divided into 8 lettered colorful sections connected with text boxes and thin line icons by arrows. Simple infographic design layout. Vector illustration for report, presentation, website. Progressive plan vectors Curved line divided into 8 lettered colorful sections connected with text boxes and thin line icons by arrows. Simple. Infographic design layout. Vector. Curved line divided into 8 lettered colorful sections connected with text boxes and thin line icons by arrows. Simple infographic design layout. Vector illustration for report, presentation, website.
Free with trial Set of circle percentage diagrams from 0 to 100. Ready-to-use for web design, user interface UI or infographic - indicator with yellow. Progressive plan vectors Set of circle percentage diagrams from 0 to 100. Ready-to-use for web design, user interface UI or infographic - indicator with yellow
Free with trial Set of circle percentage diagrams from 0 to 100. Ready-to-use for web design, user interface. Progressive plan vectors Set of circle percentage diagrams from 0 to 100. Ready-to-use for web design, user interface
Free with trial Set of circle percentage diagrams from 0 to 100. For web design, user interface UI or infographic - indicator with blue. Progressive plan vectors Set of circle percentage diagrams from 0 to 100. For web design, user interface UI or infographic - indicator with blue
Free with trial Set of circle percentage diagrams from 0 to 100. For web design, user interface UI or infographic - indicator with blue. Progressive plan vectors Set of circle percentage diagrams from 0 to 100. For web design, user interface UI or infographic - indicator with blue
Free with trial Set of circle percentage diagrams from 0 to 100. Ready-to-use for web design, user interface UI or infographic - indicator with blue. Progressive plan vectors Set of circle percentage diagrams from 0 to 100. Ready-to-use for web design, user interface UI or infographic - indicator with blue
Free with trial Set of circle percentage diagrams from 0 to 100. For web design, user interface UI or infographic - indicator with green. Progressive plan vectors Set of circle percentage diagrams from 0 to 100. For web design, user interface UI or infographic - indicator with green
Free with trial Set of circle percentage diagrams from 0 to 100. Ready-to-use for web design, user interface UI or infographic - indicator with green. Progressive plan vectors Set of circle percentage diagrams from 0 to 100. Ready-to-use for web design, user interface UI or infographic - indicator with green
 Sign in