Free with trial This image displays a page from a classic comic book. It features various characters in dramatic panels, expressing different emotions with bold, antiquated, and fictional typography, against a light off-white background. Sequential vectors A page from a vintage comic book with distressed artwork and drama. This image displays a page from a classic comic book. It features various characters in. This image displays a page from a classic comic book. It features various characters in dramatic panels, expressing different emotions with bold, antiquated, and fictional typography, against a light off-white background.
Free with trial Three scenes featuring a couple drinking coffee together at table person pouring morning coffee and intimate conversation moment Line art vector illustration. Sequential vectors Minimalist Line Art Three Scenes With Couple Enjoying Coffee Conversation And Morning Routine. Three scenes featuring a couple drinking coffee together at table. Three scenes featuring a couple drinking coffee together at table person pouring morning coffee and intimate conversation moment Line art vector illustration
Free with trial A comic magazine is a publication that combines engaging storytelling with vivid illustrations, presented in a sequential art format. Sequential vectors Comic Style Welcome Back Ramadan 1444H Festive Greeting Illustration. A comic magazine is a publication that combines engaging storytelling with vivid. A comic magazine is a publication that combines engaging storytelling with vivid illustrations, presented in a sequential art format
Free with trial A clear and concise black and white diagram illustrating the fundamental circular flow of economic activity. It depicts the four main stages: households providing labor, firms producing goods, goods being sold in the market, and households consuming those goods. This infographic uses simple icons and arrows to represent the sequential process, making it an ideal visual aid for explaining basic economic principles, market dynamics, supply chains, or business models in educational materials, presentations, or corporate communications. Sequential vectors Circular Flow of Economic Activity Diagram. A clear and concise black and white diagram illustrating the fundamental circular flow of economic activity. It. A clear and concise black and white diagram illustrating the fundamental circular flow of economic activity. It depicts the four main stages: households providing labor, firms producing goods, goods being sold in the market, and households consuming those goods. This infographic uses simple icons and arrows to represent the sequential process, making it an ideal visual aid for explaining basic economic principles, market dynamics, supply chains, or business models in educational materials, presentations, or corporate communications.
Free with trial This clear, minimalist black and white diagram illustrates the four-step process of cloud file synchronization. It begins with a file being edited on 'Device A', followed by its secure upload to a 'Cloud Server'. The updated file is then downloaded to 'Device B', culminating in the successful synchronization of files across multiple devices. This visual workflow effectively represents modern data management, remote access, and collaborative work scenarios, ideal for explaining cloud storage services, data backup, and multi-device productivity solutions. Sequential vectors Cloud File Synchronization Process Diagram. This clear, minimalist black and white diagram illustrates the four-step process of cloud file synchronization. It. This clear, minimalist black and white diagram illustrates the four-step process of cloud file synchronization. It begins with a file being edited on 'Device A', followed by its secure upload to a 'Cloud Server'. The updated file is then downloaded to 'Device B', culminating in the successful synchronization of files across multiple devices. This visual workflow effectively represents modern data management, remote access, and collaborative work scenarios, ideal for explaining cloud storage services, data backup, and multi-device productivity solutions.
Free with trial Several wavy lines created using colorful arrows, each pointing in varying directions. The arrows are colored in orange, blue, green, and red, forming dynamic and flowing patterns, illustrating complex pathways or movements. Sequential vectors Several wavy lines formed by colorful arrows pointing in different directions. Several wavy lines created using colorful arrows, each pointing in varying. Several wavy lines created using colorful arrows, each pointing in varying directions. The arrows are colored in orange, blue, green, and red, forming dynamic and flowing patterns, illustrating complex pathways or movements
Free with trial The image depicts a series of footprints arranged in a straight line, leading from the bottom left to the top right. Each footprint is clearly defined and spaced evenly, suggesting a deliberate path or journey. The footprints are in black and white, emphasizing the simplicity and uniformity of the sequence. The image can be interpreted as a symbol of progression, movement, or a trail left behind. Sequential vectors Sequential footprints in a linear path. The image depicts a series of footprints arranged in a straight line, leading from the bottom left to the top right. Each. The image depicts a series of footprints arranged in a straight line, leading from the bottom left to the top right. Each footprint is clearly defined and spaced evenly, suggesting a deliberate path or journey. The footprints are in black and white, emphasizing the simplicity and uniformity of the sequence. The image can be interpreted as a symbol of progression, movement, or a trail left behind
Free with trial Gradient Boosting. An ensemble method that builds a strong model from many weak decision trees added one at a time. This reads as a sum: a start dot, then three stumps, each smaller than the last. Below, the running prediction steps up, overshoots a dashed target line and comes back down to it. Error bars between target and steps shrink as each tree corrects what earlier ones missed. Clean single-path design suits AI education, analytics slides and documentation. Sequential vectors Gradient Boosting. Trees added in sequence nudge the prediction up or down while the residual error shrinks. Gradient Boosting. An ensemble method that builds a. Gradient Boosting. An ensemble method that builds a strong model from many weak decision trees added one at a time. This reads as a sum: a start dot, then three stumps, each smaller than the last. Below, the running prediction steps up, overshoots a dashed target line and comes back down to it. Error bars between target and steps shrink as each tree corrects what earlier ones missed. Clean single-path design suits AI education, analytics slides and documentation.
Free with trial Ai-Generated a set of four numbered arrow-shaped designed for use in infographics or presentations. Each arrow is divided into two sections: a dark blue rectangle on the left containing a number (01, 02, 05, and 04), and a white arrow-shaped section on the right with the placeholder text "YOUR TEXT GOES HERE. " The numbering is not sequential (01, 02, 05, 04), suggesting flexibility in arrangement or a specific. Sequential vectors Numbered arrow infographic with placeholder text for information. Ai-Generated a set of four numbered arrow-shaped designed for use in infographics or. Ai-Generated a set of four numbered arrow-shaped designed for use in infographics or presentations. Each arrow is divided into two sections: a dark blue rectangle on the left containing a number (01, 02, 05, and 04), and a white arrow-shaped section on the right with the placeholder text "YOUR TEXT GOES HERE." The numbering is not sequential (01, 02, 05, 04), suggesting flexibility in arrangement or a specific
Free with trial A minimalist vector icon set featuring a layered square or rectangular prism. This image presents two versions: a black icon on a white background and a white icon on a black background, offering versatile use for both dark and light design themes. The isometric design clearly depicts three distinct layers, making it suitable for representing concepts such as stacking, organization, multi-level structures, data storage, file management, or sequential steps. Its clean, simple, and modern aesthetic is perfect for web design, app interfaces, presentations, and abstract illustrations. Sequential vectors Layered Square Box Icons - Black and White Set. A minimalist vector icon set featuring a layered square or rectangular prism. This image presents two versions: a. A minimalist vector icon set featuring a layered square or rectangular prism. This image presents two versions: a black icon on a white background and a white icon on a black background, offering versatile use for both dark and light design themes. The isometric design clearly depicts three distinct layers, making it suitable for representing concepts such as stacking, organization, multi-level structures, data storage, file management, or sequential steps. Its clean, simple, and modern aesthetic is perfect for web design, app interfaces, presentations, and abstract illustrations.
Free with trial A four stage infographic showcasing the GROW coaching model. The horizontal layout uses drop shaped elements to illustrate the steps Goal, Reality, Options, and Will, ideal for training and strategy presentations. Sequential vectors Horizontal GROW Model Infographic Diagram. A four stage infographic showcasing the GROW coaching model. The horizontal layout uses drop shaped elements to. A four stage infographic showcasing the GROW coaching model. The horizontal layout uses drop shaped elements to illustrate the steps Goal, Reality, Options, and Will, ideal for training and strategy presentations.
Free with trial Present ideas clearly with a colorful numbered infographic timeline template featuring 15 connected steps in a modern, professional layout. Ideal for business presentations, project planning, workflows, strategy reports, process diagrams, roadmaps, educational slides, and corporate communication. Sequential vectors Colorful Numbered Infographic Timeline Template 15 Step Process Diagram for Modern Business Presentation. Present ideas clearly with a colorful numbered. Present ideas clearly with a colorful numbered infographic timeline template featuring 15 connected steps in a modern, professional layout. Ideal for business presentations, project planning, workflows, strategy reports, process diagrams, roadmaps, educational slides, and corporate communication.
Free with trial Educational dentistry and dental pathology detailing the progressive stages of tooth decay in full color. The labeled cross section diagram illustrates the sequential progression of dental caries across four anatomical stages, showing the initial white spot lesion, superficial enamel decay, deeper dentin decay, and advanced involvement of the pulp tissue leading to pulpitis and nerve exposure. High quality graphic ideal for dental clinic posters, oral hygiene manuals, pediatric dentistry guides, odontic disease textbooks, patient education brochures, and medical school lecture slides. Sequential vectors Stages of Tooth Decay Dental Caries Progression Enamel Dentin and Pulp Cavity Color Vector Illustration. Educational dentistry and dental pathology detailing the. Educational dentistry and dental pathology detailing the progressive stages of tooth decay in full color. The labeled cross section diagram illustrates the sequential progression of dental caries across four anatomical stages, showing the initial white spot lesion, superficial enamel decay, deeper dentin decay, and advanced involvement of the pulp tissue leading to pulpitis and nerve exposure. High quality graphic ideal for dental clinic posters, oral hygiene manuals, pediatric dentistry guides, odontic disease textbooks, patient education brochures, and medical school lecture slides.
Free with trial Vector Flowchart Diagram Template. This layered illustration visualizes a process, hierarchy, or cycle using gradient blocks and circular nodes, perfect for business reports. The editable graphic features a modern, clean design with dashed connector lines. Sequential vectors Vector Flowchart Diagram Template. This layered illustration visualizes a process, hierarchy, or cycle using gradient blocks and circular nodes, perfect for
Free with trial A comic magazine is a publication that combines engaging storytelling with vivid illustrations, presented in a sequential art format. Sequential vectors Colorful Ramadan Kareem Poster in Comic Style with Clouds and Sparkles. A comic magazine is a publication that combines engaging storytelling with vivid. A comic magazine is a publication that combines engaging storytelling with vivid illustrations, presented in a sequential art format
Free with trial This infographic visually outlines the essential stages of media production, from initial concept to final delivery. It clearly depicts the sequential workflow, starting with Pre-Production (script icon), moving through Filming (camera icon), Post-Production (clapperboard and scissors), Color Grading & Sound (clapperboard with sound waves), and concluding with Final Export (document with cloud upload). The clean, modern line icons and clear text labels make it an ideal visual aid for understanding the filmmaking process, digital content creation, or for use in presentations and educational materials. Sequential vectors Media Production Workflow Diagram with Icons. This infographic visually outlines the essential stages of media production, from initial concept to final delivery. This infographic visually outlines the essential stages of media production, from initial concept to final delivery. It clearly depicts the sequential workflow, starting with Pre-Production (script icon), moving through Filming (camera icon), Post-Production (clapperboard and scissors), Color Grading & Sound (clapperboard with sound waves), and concluding with Final Export (document with cloud upload). The clean, modern line icons and clear text labels make it an ideal visual aid for understanding the filmmaking process, digital content creation, or for use in presentations and educational materials.
Free with trial A comprehensive vector infographic illustrating the seven key steps in a professional career development journey. This sequential diagram begins with self-assessment and acquiring knowledge, progresses through skill development, networking, and gaining first experience, and culminates in successfully transitioning to a new role. The minimalist black and white icons on a clean white background make it ideal for presentations, educational materials, HR training, career counseling, and business strategy visuals focusing on employee growth and career advancement. Sequential vectors Career Development Journey Steps Infographic. A comprehensive vector infographic illustrating the seven key steps in a professional career development journey. A comprehensive vector infographic illustrating the seven key steps in a professional career development journey. This sequential diagram begins with self-assessment and acquiring knowledge, progresses through skill development, networking, and gaining first experience, and culminates in successfully transitioning to a new role. The minimalist black and white icons on a clean white background make it ideal for presentations, educational materials, HR training, career counseling, and business strategy visuals focusing on employee growth and career advancement.
Free with trial A simple illustration of a progress bar, represented by two rows of circles. The circles gradually increase in size and darken in color, indicating advancement or completion. This visual can be used to represent loading, progress, levels, or any sequential process. Isolated on a white background. Sequential vectors Progress Bar with Circles. A simple illustration of a progress bar, represented by two rows of circles. The circles gradually increase in size and darken in. A simple illustration of a progress bar, represented by two rows of circles. The circles gradually increase in size and darken in color, indicating advancement or completion. This visual can be used to represent loading, progress, levels, or any sequential process. Isolated on a white background.
Free with trial The image depicts a three-step process workflow. The first step features a gear icon within a square, symbolizing setup or configuration. An arrow points to the second step, which shows a document icon within a square, representing the creation or review of a document. Another arrow leads to the third step, a checkmark icon within a square, indicating completion or approval. The image illustrates. Sequential vectors Process workflow from setup to approval. The image depicts a three-step process workflow. The first step features a gear icon within a square, symbolizing setup. The image depicts a three-step process workflow. The first step features a gear icon within a square, symbolizing setup or configuration. An arrow points to the second step, which shows a document icon within a square, representing the creation or review of a document. Another arrow leads to the third step, a checkmark icon within a square, indicating completion or approval. The image illustrates
Free with trial The image depicts a series of black paw prints arranged in a diagonal line across a white background. The paw prints are evenly spaced and appear to be in a consistent pattern, suggesting a path or trail. The simplicity of the image, with its stark contrast between black and white, highlights the paw prints prominently, creating a visually appealing and straightforward design. Sequential vectors Sequential paw prints on a clean surface. The image depicts a series of black paw prints arranged in a diagonal line across a white background. The paw prints. The image depicts a series of black paw prints arranged in a diagonal line across a white background. The paw prints are evenly spaced and appear to be in a consistent pattern, suggesting a path or trail. The simplicity of the image, with its stark contrast between black and white, highlights the paw prints prominently, creating a visually appealing and straightforward design
Free with trial The image displays a vertical barcode pattern composed of black and white bars. The bars are arranged in a repeating sequence, with varying widths creating a distinct visual pattern. The barcode is symmetrical and centered, with a consistent spacing between the bars. The overall design is simple yet striking, with a clear contrast between the black and white elements. Sequential vectors Vertical black and white barcode pattern. The image displays a vertical barcode pattern composed of black and white bars. The bars are arranged in a repeating. The image displays a vertical barcode pattern composed of black and white bars. The bars are arranged in a repeating sequence, with varying widths creating a distinct visual pattern. The barcode is symmetrical and centered, with a consistent spacing between the bars. The overall design is simple yet striking, with a clear contrast between the black and white elements
Free with trial Four-Step Timeline Infographic with Color-Coded Options. A visual representation of a four-step workflow with interconnected options and arrows. Sequential vectors Four-Step Timeline Infographic with Color-Coded Options. A visual representation of a four-step workflow with interconnected options and arrows
Free with trial This black and white vector illustration visually represents the sequential journey from an initial concept to a published work. The infographic begins with a glowing lightbulb symbolizing inspiration and idea generation, followed by a document and pen signifying writing and drafting. The process continues with an open book and magnifying glass, denoting research, editing, or learning. It culminates in a closed book with a star and bookmark, representing a completed publication, acquired knowledge, or a significant achievement. This visual metaphor is ideal for illustrating creative workflows, educational paths, or the development of intellectual property. Sequential vectors Idea to Publication Process Workflow Icon Set. This black and white vector illustration visually represents the sequential journey from an initial concept to a. This black and white vector illustration visually represents the sequential journey from an initial concept to a published work. The infographic begins with a glowing lightbulb symbolizing inspiration and idea generation, followed by a document and pen signifying writing and drafting. The process continues with an open book and magnifying glass, denoting research, editing, or learning. It culminates in a closed book with a star and bookmark, representing a completed publication, acquired knowledge, or a significant achievement. This visual metaphor is ideal for illustrating creative workflows, educational paths, or the development of intellectual property.
Free with trial The infographic template features a curved line with arrows, reminiscent of a snake or wave, divided into segments. It's ideal for demonstrating sequential steps, workflows, or a timeline of events. Sequential vectors Business infographic design template with 6 infodatas. Development of the business. The infographic template features a curved line with arrows, reminiscent of. The infographic template features a curved line with arrows, reminiscent of a snake or wave, divided into segments. It's ideal for demonstrating sequential steps, workflows, or a timeline of events.
Free with trial Arrow infographic solid vector icon. This glyph icon shows segmented arrows representing flow. Ideal sign and analytics symbol in presentation or infographic icon sets. Sequential vectors Arrow infographic solid vector icon. This glyph icon shows segmented arrows representing flow. Ideal sign and analytics symbol in presentation or infographic
Free with trial Four black gear lever illustrations on a transparent background. Each icon features a different gear lever design, with stylized variations. The levers have round or geometric bases and vary in shaft length and shape. The first and second levers have simple shapes, while the third and fourth incorporate intricate gear paths representing possible gear positions. The use of solid black color provides a minimalist and modern appearance, suitable for automotive-themed graphics or user interface elements. Sequential vectors Icon, 4 gear lever illustrations, black, transparent background. Four black gear lever illustrations on a transparent background. Each icon features a different. Four black gear lever illustrations on a transparent background. Each icon features a different gear lever design, with stylized variations. The levers have round or geometric bases and vary in shaft length and shape. The first and second levers have simple shapes, while the third and fourth incorporate intricate gear paths representing possible gear positions. The use of solid black color provides a minimalist and modern appearance, suitable for automotive-themed graphics or user interface elements.
Free with trial This vector illustration features a three-step infographic template, ideal for showcasing processes, cycles, or options. Each step is represented by a distinct, numbered (01, 02, 03) folded banner shape in varying colors (brown, red, blue-green), arranged in a circular flow. A subtle world map outline in the background adds a global or international context. This versatile design is perfect for business presentations, marketing materials, educational content, or any project requiring a clear, structured visualization of sequential information, strategy, or workflow across different stages. Sequential vectors Global 3 Step Infographic Template with World Map Background. This vector illustration features a three-step infographic template, ideal for showcasing processes. This vector illustration features a three-step infographic template, ideal for showcasing processes, cycles, or options. Each step is represented by a distinct, numbered (01, 02, 03) folded banner shape in varying colors (brown, red, blue-green), arranged in a circular flow. A subtle world map outline in the background adds a global or international context. This versatile design is perfect for business presentations, marketing materials, educational content, or any project requiring a clear, structured visualization of sequential information, strategy, or workflow across different stages.
Free with trial This image features a collection of numerical icons from one to twelve presented in two distinct styles: square and circular The design is clean and modern using teal numbers on a cream background offering a versatile visual for educational marketing or general design projects. Sequential vectors Set of Numeric Icons with Squares and Circles in Teal and Cream Shades. This image features a collection of numerical icons from one to twelve presented in two. This image features a collection of numerical icons from one to twelve presented in two distinct styles: square and circular The design is clean and modern using teal numbers on a cream background offering a versatile visual for educational marketing or general design projects
Free with trial Productivity workflow icons featuring task management resources planning systems organization tools and efficient business process elements. Sequential vectors Productivity Workflow Management Tools and Task Organization Icons. Productivity workflow icons featuring task management resources planning systems organization. Productivity workflow icons featuring task management resources planning systems organization tools and efficient business process elements
Free with trial A comic magazine is a publication that combines engaging storytelling with vivid illustrations, presented in a sequential art format. Sequential vectors Colorful Ramadan Kareem Greeting Card with Modern Design and Comic Style. A comic magazine is a publication that combines engaging storytelling with vivid. A comic magazine is a publication that combines engaging storytelling with vivid illustrations, presented in a sequential art format
Free with trial A comic magazine is a publication that combines engaging storytelling with vivid illustrations, presented in a sequential art format. Sequential vectors Ramadan Kareem Greeting Artwork with Vibrant Colors and Festive Elements. A comic magazine is a publication that combines engaging storytelling with vivid. A comic magazine is a publication that combines engaging storytelling with vivid illustrations, presented in a sequential art format
Free with trial User Acceptance Testing Workflow Diagram for Software QA. This diagram represents the sequential process of user acceptance testing, illustrating planning. Sequential vectors User Acceptance Testing Workflow Diagram for Software QA. This diagram represents the sequential process of user acceptance testing, illustrating planning
Free with trial This clean, black and white vector illustration depicts a sequential process of idea generation and knowledge organization. It starts with a "Central Topic" (black circle), expands to "Main Branches (Key Ideas)" (interconnected circles), then breaks down into "Sub-Branches (Details)" (many small circles). The final stage, "Discover New Connections," shows how detailed elements can form new relationships. This versatile diagram is ideal for visualizing brainstorming, mind mapping, problem-solving, project planning, and understanding complex information structures in business, education, or research contexts. Sequential vectors Idea Generation and Connection Process Diagram. This clean, black and white vector illustration depicts a sequential process of idea generation and knowledge. This clean, black and white vector illustration depicts a sequential process of idea generation and knowledge organization. It starts with a "Central Topic" (black circle), expands to "Main Branches (Key Ideas)" (interconnected circles), then breaks down into "Sub-Branches (Details)" (many small circles). The final stage, "Discover New Connections," shows how detailed elements can form new relationships. This versatile diagram is ideal for visualizing brainstorming, mind mapping, problem-solving, project planning, and understanding complex information structures in business, education, or research contexts.
Free with trial Curved Roadmap Infographic With Six Milestone Steps And Colorful Markers On White Background Vector Illustration. Sequential vectors Curved Roadmap Infographic With Six Milestone Steps And Colorful Markers On White Background Vector Design. Curved Roadmap Infographic With Six Milestone Steps. Curved Roadmap Infographic With Six Milestone Steps And Colorful Markers On White Background Vector Illustration
Free with trial A branching diagram illustrates how a two-stage random event unfolds: a starting point divides into two paths, and each of those divides again into two more, ending in four possible outcomes. Instead of printed numbers, the thickness of each line shows how likely that path is — a thicker line marks a more likely route, a thinner line marks a less likely one, and every path narrows further than its parent as it moves away from the start. This visualizes a core statistics idea: chances multiply together as an event unfolds, so a compound outcome is always less likely than any single step that leads to it. Small circles mark the start and each decision point along the way. Sequential vectors Probability Tree Icon – branching diagram with line thickness showing outcome likelihood, binary decision tree. A branching diagram illustrates how a two-stage. A branching diagram illustrates how a two-stage random event unfolds: a starting point divides into two paths, and each of those divides again into two more, ending in four possible outcomes. Instead of printed numbers, the thickness of each line shows how likely that path is — a thicker line marks a more likely route, a thinner line marks a less likely one, and every path narrows further than its parent as it moves away from the start. This visualizes a core statistics idea: chances multiply together as an event unfolds, so a compound outcome is always less likely than any single step that leads to it. Small circles mark the start and each decision point along the way.
Free with trial Firewall rule chain icon: a cybersecurity showing how a firewall applies its policy. Incoming packets are checked against an ordered set of rules, one at a time. A rule that does not match is skipped and the packet moves on to the next. The first rule that matches decides the outcome, allow or deny, and the rules after it are never checked. A policy document defines each rule's condition and action. Part of a icon set on cyber attack and defence mechanisms. Sequential vectors Firewall Rule Chain Icon - packets checked against ordered policy rules, first matching rule decides allow or deny. Firewall rule chain icon: a cybersecurity. Firewall rule chain icon: a cybersecurity showing how a firewall applies its policy. Incoming packets are checked against an ordered set of rules, one at a time. A rule that does not match is skipped and the packet moves on to the next. The first rule that matches decides the outcome, allow or deny, and the rules after it are never checked. A policy document defines each rule's condition and action. Part of a icon set on cyber attack and defence mechanisms.
Free with trial A film strip is a continuous ribbon of photographic film containing a series of sequential images or frames. It's commonly used in traditional motion picture and photography processes. With perforated edges and visible frames, the film strip symbolizes classic filmmaking, storytelling, and the art of visual motion. Sequential vectors Film strip. A film strip is a continuous ribbon of photographic film containing a series of sequential images or frames. It's commonly used in traditional motion. A film strip is a continuous ribbon of photographic film containing a series of sequential images or frames. It's commonly used in traditional motion picture and photography processes. With perforated edges and visible frames, the film strip symbolizes classic filmmaking, storytelling, and the art of visual motion.
Free with trial A comic magazine is a publication that combines engaging storytelling with vivid illustrations, presented in a sequential art format. Sequential vectors Colorful Welcome Poster for Ramadan Celebrations 1446H in a Pop Art Style. A comic magazine is a publication that combines engaging storytelling with vivid. A comic magazine is a publication that combines engaging storytelling with vivid illustrations, presented in a sequential art format
Free with trial A comic magazine is a publication that combines engaging storytelling with vivid illustrations, presented in a sequential art format. Sequential vectors Colorful Comic Style Happy Text with Vibrant Background and Cloud Details. A comic magazine is a publication that combines engaging storytelling with vivid. A comic magazine is a publication that combines engaging storytelling with vivid illustrations, presented in a sequential art format
Free with trial A comic magazine is a publication that combines engaging storytelling with vivid illustrations, presented in a sequential art format. Sequential vectors Colorful Ramadan Kareem Illustration With Bright Design and Text Elements. A comic magazine is a publication that combines engaging storytelling with vivid. A comic magazine is a publication that combines engaging storytelling with vivid illustrations, presented in a sequential art format
Free with trial This black and white vector infographic illustrates the step-by-step process of making a delicious pizza. It begins with a dough ball, followed by hands stretching the base, then adding sauce and cheese. The next stage shows applying various toppings like mushrooms and pepperoni, culminating in a baked pizza fresh from the oven. This clear, sequential guide is ideal for recipe instructions, cooking tutorials, food blogs, restaurant menus, or any culinary-themed design needing a visual representation of pizza preparation. Sequential vectors Pizza Making Process Steps Infographic Icon Set. This black and white vector infographic illustrates the step-by-step process of making a delicious pizza. It. This black and white vector infographic illustrates the step-by-step process of making a delicious pizza. It begins with a dough ball, followed by hands stretching the base, then adding sauce and cheese. The next stage shows applying various toppings like mushrooms and pepperoni, culminating in a baked pizza fresh from the oven. This clear, sequential guide is ideal for recipe instructions, cooking tutorials, food blogs, restaurant menus, or any culinary-themed design needing a visual representation of pizza preparation.
Free with trial A clear and concise infographic illustrating the essential steps of personal financial management. This black and white vector image depicts a sequential process starting with earning income (money bag), followed by creating a budget (pie chart), spending on needs (shopping cart in house), saving and investing (piggy bank with plant), and concluding with a financial review (magnifying glass over calendar). Ideal for educational content, financial planning presentations, articles on money management, or illustrating financial literacy concepts. Sequential vectors Personal Financial Management Process Flowchart. A clear and concise infographic illustrating the essential steps of personal financial management. This black. A clear and concise infographic illustrating the essential steps of personal financial management. This black and white vector image depicts a sequential process starting with earning income (money bag), followed by creating a budget (pie chart), spending on needs (shopping cart in house), saving and investing (piggy bank with plant), and concluding with a financial review (magnifying glass over calendar). Ideal for educational content, financial planning presentations, articles on money management, or illustrating financial literacy concepts.
Free with trial Geometric Shape Border Divider Set, Solid Repeat Square Circle Star Triangle Diamond Hexagon. Strip Clipart. Sequential vectors Geometric Shape Border Divider Set, Solid Repeat Square Circle Star Triangle Diamond Hexagon. Strip Clipart
Free with trial Process flow diagram. Process demonstrated through arrow and box elements steps in sequential order. Process flow for systems, engineering, tech concepts, workflows, planning. Sequential vectors Process Flow Diagram with Arrow and Rectangular Component. Process flow diagram. Process demonstrated through arrow and box elements steps in sequential order. Process flow diagram. Process demonstrated through arrow and box elements steps in sequential order. Process flow for systems, engineering, tech concepts, workflows, planning
Free with trial Colorful Roadmap Infographic With Six Steps Labels Trees And Milestone Pointers On Blue Background Vector. Illustration. Sequential vectors Colorful Roadmap Infographic With Six Steps Labels Trees And Milestone Pointers On Blue Background Vector. Illustration
Free with trial Detailed line art illustration of single rose flower buds slowly unfolding from closed sepals to an open bloom. Sequential vectors Elegant rosebud line art icons showing sequential growth and blooming. AI generated detailed line art illustration of single rose flower buds slowly unfolding. detailed line art illustration of single rose flower buds slowly unfolding from closed sepals to an open bloom
Free with trial Infographic featuring vertically stacked, colored bars representing different performance levels. Each bar is labeled with illegible text and color-coded: green, yellow, orange, and red, from top to bottom. Circular icons with arrows or symbols are centered on each bar. Adjacent text boxes provide additional, unclear information with small icons and colored graphs. The background is a light blue with abstract patterns, enhancing the design's visual appeal. The layout indicates a hierarchical or sequential flow. Sequential vectors Colorful Performance Level Infographic Concept. Infographic featuring vertically stacked, colored bars representing different performance levels. Each bar is. Infographic featuring vertically stacked, colored bars representing different performance levels. Each bar is labeled with illegible text and color-coded: green, yellow, orange, and red, from top to bottom. Circular icons with arrows or symbols are centered on each bar. Adjacent text boxes provide additional, unclear information with small icons and colored graphs. The background is a light blue with abstract patterns, enhancing the design's visual appeal. The layout indicates a hierarchical or sequential flow.
Free with trial Icon set illustrating various workflow components in blue glyph design. Features include flowcharts, process mapping, and task management symbols. Key elements include gears, charts, nodes, software screens, and folders, representing business processes and logical flows. Ideal for digital applications in project management and systems analysis. Sequential vectors Workflow icon set displaying business process mapping, sequential task management, and flowchart glyph designs. Icon set illustrating various workflow. Icon set illustrating various workflow components in blue glyph design. Features include flowcharts, process mapping, and task management symbols. Key elements include gears, charts, nodes, software screens, and folders, representing business processes and logical flows. Ideal for digital applications in project management and systems analysis.
Free with trial Dark Background Roadmap Infographic With Six Colorful Steps Arrow Path And Goal Destination Vector Illustration. Sequential vectors Dark Background Roadmap Infographic With Six Colorful Steps Arrow Path And Goal Destination Vector Graphic. Dark Background Roadmap Infographic With Six Colorful. Dark Background Roadmap Infographic With Six Colorful Steps Arrow Path And Goal Destination Vector Illustration
Free with trial Colorful numbered list tags from one to four. Great for step by step infographics, presentation slides, sequential instructions, and menus. Sequential vectors Red and yellow numbered list infographic elements for step by step instructions. Colorful numbered list tags from one to four. Great for step by step. Colorful numbered list tags from one to four. Great for step by step infographics, presentation slides, sequential instructions, and menus
Free with trial Timeline infographics featuring five interconnected circles, each representing a distinct stage or milestone, visually illustrating a sequential process or workflow, vector eps10 illustration. Sequential vectors Timeline Infographics Template. Timeline infographics featuring five interconnected circles, each representing a distinct stage or milestone, visually. Timeline infographics featuring five interconnected circles, each representing a distinct stage or milestone, visually illustrating a sequential process or workflow, vector eps10 illustration
Free with trial A comic magazine is a publication that combines engaging storytelling with vivid illustrations, presented in a sequential art format. Sequential vectors Vibrant Comic Style Illustration with Exaggerated Text and Dynamic Elements. A comic magazine is a publication that combines engaging storytelling with vivid. A comic magazine is a publication that combines engaging storytelling with vivid illustrations, presented in a sequential art format
Free with trial A clean vector illustration presenting three sequential logo concepts based on the letter "C", arranged horizontally on a white background. The first concept features a simple green outline of the letter C, labeled "Simple C Outline". The second concept showcases a bold, solid geometric C in green, labeled "Solid Geometric C". The third concept illustrates an evolving or shattering C design, where fragments break away from the top right, accompanied by small flying bird silhouettes, symbolizing transformation and creativity. Below the designs, descriptive text reads "Letter C Logo Concepts Alphabetical Series" and "Vector Flat Style Single-Color Concept". Perfect for branding, logo inspiration, typography studies, and modern design projects. Sequential vectors Letter C Logo Concepts Set – Simple Outline, Solid Geometric, and Evolution Shatter Design in Green Flat Vector Style. A clean vector illustration presenting. A clean vector illustration presenting three sequential logo concepts based on the letter "C", arranged horizontally on a white background. The first concept features a simple green outline of the letter C, labeled "Simple C Outline". The second concept showcases a bold, solid geometric C in green, labeled "Solid Geometric C". The third concept illustrates an evolving or shattering C design, where fragments break away from the top right, accompanied by small flying bird silhouettes, symbolizing transformation and creativity. Below the designs, descriptive text reads "Letter C Logo Concepts Alphabetical Series" and "Vector Flat Style Single-Color Concept". Perfect for branding, logo inspiration, typography studies, and modern design projects.
Free with trial This infographic visually explains the fundamental economic principle of supply and demand reaching equilibrium. It illustrates a four-step process: starting with high supply and low demand, leading to price drops. These lower prices then stimulate an increase in demand, ultimately resulting in the market price reaching a balanced equilibrium point. This clear, sequential diagram is ideal for educational materials, business presentations, economic analyses, and illustrating market dynamics, making complex concepts easy to understand for students and professionals alike. Sequential vectors Supply and Demand Equilibrium Process Infographic. This infographic visually explains the fundamental economic principle of supply and demand reaching. This infographic visually explains the fundamental economic principle of supply and demand reaching equilibrium. It illustrates a four-step process: starting with high supply and low demand, leading to price drops. These lower prices then stimulate an increase in demand, ultimately resulting in the market price reaching a balanced equilibrium point. This clear, sequential diagram is ideal for educational materials, business presentations, economic analyses, and illustrating market dynamics, making complex concepts easy to understand for students and professionals alike.
Free with trial High-quality image featuring a sequential countdown of metallic numbers from one to nine, arranged in two rows with a reflective chrome finish, ideal for business, finance, technology, and educational projects. Sequential vectors Metallic numbers countdown sequence display. High-quality image featuring a sequential countdown of metallic numbers from one to nine, arranged in two rows with. High-quality image featuring a sequential countdown of metallic numbers from one to nine, arranged in two rows with a reflective chrome finish, ideal for business, finance, technology, and educational projects
Free with trial Silhouettes depict five stages of a person transitioning from standing to running. Each figure shows a progressive change in posture, illustrating the dynamics of motion. The figures are uniformly black against a white background, highlighting the sequential movement in a minimalist style. The simple, linear progression captures the essence of animation, making it suitable for visualizing concepts of motion and action. Sequential vectors Running Man Silhouette Stages Animation Stock Photo. Silhouettes depict five stages of a person transitioning from standing to running. Each figure shows a. Silhouettes depict five stages of a person transitioning from standing to running. Each figure shows a progressive change in posture, illustrating the dynamics of motion. The figures are uniformly black against a white background, highlighting the sequential movement in a minimalist style. The simple, linear progression captures the essence of animation, making it suitable for visualizing concepts of motion and action.
Free with trial This black and white infographic illustrates the Agile Scrum software development process, outlining key stages in a clear, sequential flow. It begins with the Product Backlog, followed by Sprint Planning, where teams define work. The process continues with Development & Coding, then moves to rigorous Testing & QA to ensure quality. Finally, the Sprint Review phase assesses completed work and gathers feedback. This vector illustration is ideal for presentations, educational materials, and project management diagrams to explain agile methodologies, software engineering workflows, and team collaboration in a structured environment. Sequential vectors Agile Scrum Software Development Process Flowchart. This black and white infographic illustrates the Agile Scrum software development process, outlining key. This black and white infographic illustrates the Agile Scrum software development process, outlining key stages in a clear, sequential flow. It begins with the Product Backlog, followed by Sprint Planning, where teams define work. The process continues with Development & Coding, then moves to rigorous Testing & QA to ensure quality. Finally, the Sprint Review phase assesses completed work and gathers feedback. This vector illustration is ideal for presentations, educational materials, and project management diagrams to explain agile methodologies, software engineering workflows, and team collaboration in a structured environment.
Free with trial A modern and clean infographic template featuring four distinct steps or options. Each step is represented by a numbered circle (01, 02, 03, 04) with a vibrant, partially filled colored outline (purple, teal, red). Placeholder text areas are provided for titles and detailed descriptions. The subtle world map background adds a global or international context. Ideal for business presentations, educational materials, marketing strategies, process flows, timelines, or illustrating sequential stages in a clear and engaging manner. Sequential vectors 4 Step Global Infographic Template with World Map Background. A modern and clean infographic template featuring four distinct steps or options. Each step is. A modern and clean infographic template featuring four distinct steps or options. Each step is represented by a numbered circle (01, 02, 03, 04) with a vibrant, partially filled colored outline (purple, teal, red). Placeholder text areas are provided for titles and detailed descriptions. The subtle world map background adds a global or international context. Ideal for business presentations, educational materials, marketing strategies, process flows, timelines, or illustrating sequential stages in a clear and engaging manner.
Free with trial The a step-by-step of how to draw different mustache styles using simple shapes and lines. It nine sequential demonstrating various mustache forms, including thick, thin, curly, and handlebar styles. Each is drawn with black lines on a white background, showing the progression from basic outlines to more detailed facial hair representations. The style is clean and minimalistic, focusing on. Sequential vectors Step-by-step mustache guide with simple sketching techniques beard tutorial step-by-step guide. The a step-by-step of how to draw different mustache styles using. The a step-by-step of how to draw different mustache styles using simple shapes and lines. It nine sequential demonstrating various mustache forms, including thick, thin, curly, and handlebar styles. Each is drawn with black lines on a white background, showing the progression from basic outlines to more detailed facial hair representations. The style is clean and minimalistic, focusing on
Free with trial Educational cell biology infographic diagram illustrating the complete cycle of mitosis cell division. This flat outlines the sequential stages of somatic cell replication, including interphase, prophase, metaphase (chromosomes aligning), anaphase (chromatids separating), telophase (nuclear membrane forming), and the formation of two identical daughter cells. Perfect for biology textbooks, genetics lessons, medical education, school science projects, and research presentations. Sequential vectors Mitosis Cell Division Diagram with Interphase Prophase Metaphase Anaphase Telophase Stages Vector Illustration. Educational cell biology infographic diagram. Educational cell biology infographic diagram illustrating the complete cycle of mitosis cell division. This flat outlines the sequential stages of somatic cell replication, including interphase, prophase, metaphase (chromosomes aligning), anaphase (chromatids separating), telophase (nuclear membrane forming), and the formation of two identical daughter cells. Perfect for biology textbooks, genetics lessons, medical education, school science projects, and research presentations.
Free with trial Educational cell biology infographic diagram illustrating the complete cycle of mitosis cell division. This flat outlines the sequential stages of somatic cell replication, including interphase, prophase, metaphase (chromosomes aligning), anaphase (chromatids separating), telophase (nuclear membrane forming), and the formation of two identical daughter cells. Perfect for biology textbooks, genetics lessons, medical education, school science projects, and research presentations. Sequential vectors Mitosis Cell Division Diagram with Interphase Prophase Metaphase Anaphase Telophase Stages Vector Illustration. Educational cell biology infographic diagram. Educational cell biology infographic diagram illustrating the complete cycle of mitosis cell division. This flat outlines the sequential stages of somatic cell replication, including interphase, prophase, metaphase (chromosomes aligning), anaphase (chromatids separating), telophase (nuclear membrane forming), and the formation of two identical daughter cells. Perfect for biology textbooks, genetics lessons, medical education, school science projects, and research presentations.
Free with trial Three blank vertical frames mockup template delivers a structured triptych framework for organizing creative projects. These independent rectangular panels provide excellent compartmentalization for developing invitations, greeting cards, or custom sublimation projects. Created with definitive outlines, the empty borders function as pristine placeholders for sequential storytelling or gallery displays. Perfect for arranging organized visual portfolios. Hand Drawn with alpha transparent background. Sequential vectors Three blank rectangular panels storyboard layout grid placeholder Hand Drawn with alpha transparent background. Three blank vertical frames mockup template. Three blank vertical frames mockup template delivers a structured triptych framework for organizing creative projects. These independent rectangular panels provide excellent compartmentalization for developing invitations, greeting cards, or custom sublimation projects. Created with definitive outlines, the empty borders function as pristine placeholders for sequential storytelling or gallery displays. Perfect for arranging organized visual portfolios. Hand Drawn with alpha transparent background.
Free with trial Educational cell biology infographic diagram illustrating the complete cycle of mitosis cell division. This flat outlines the sequential stages of somatic cell replication, including interphase, prophase, metaphase (chromosomes aligning), anaphase (chromatids separating), telophase (nuclear membrane forming), and the formation of two identical daughter cells. Perfect for biology textbooks, genetics lessons, medical education, school science projects, and research presentations. Sequential vectors Mitosis Cell Division Diagram with Interphase Prophase Metaphase Anaphase Telophase Stages Vector Illustration. Educational cell biology infographic diagram. Educational cell biology infographic diagram illustrating the complete cycle of mitosis cell division. This flat outlines the sequential stages of somatic cell replication, including interphase, prophase, metaphase (chromosomes aligning), anaphase (chromatids separating), telophase (nuclear membrane forming), and the formation of two identical daughter cells. Perfect for biology textbooks, genetics lessons, medical education, school science projects, and research presentations.
Free with trial This black and white icon set visually represents the complete workflow of book or content production and consumption. It illustrates the sequence from content creation (book and pen), through printing (printer icon), to physical distribution and delivery (delivery truck), culminating in the end-user engaging with the material (person reading a book). Ideal for infographics, presentations, or diagrams explaining publishing cycles, supply chains, educational content flow, or any sequential process involving creation, manufacturing, logistics, and consumption. The minimalist design ensures clarity and versatility. Sequential vectors Book Publishing and Delivery Process Icons Workflow. This black and white icon set visually represents the complete workflow of book or content production and. This black and white icon set visually represents the complete workflow of book or content production and consumption. It illustrates the sequence from content creation (book and pen), through printing (printer icon), to physical distribution and delivery (delivery truck), culminating in the end-user engaging with the material (person reading a book). Ideal for infographics, presentations, or diagrams explaining publishing cycles, supply chains, educational content flow, or any sequential process involving creation, manufacturing, logistics, and consumption. The minimalist design ensures clarity and versatility.
Free with trial This clear, sequential icon set illustrates the complete wood production process, from its natural origin as a tree to its transformation into a finished piece of furniture, specifically a table. The diagram begins with a stylized tree, followed by a cut log, then a stack of processed lumber or planks, and finally, a completed table. Rendered in a simple black silhouette on a white background, this vector graphic effectively conveys the journey of wood from raw material to a manufactured product. Ideal for infographics, educational content, business presentations on forestry, carpentry, manufacturing, and sustainable resource management. Sequential vectors Wood Production Process: From Tree to Table Icon Set. This clear, sequential icon set illustrates the complete wood production process, from its natural origin. This clear, sequential icon set illustrates the complete wood production process, from its natural origin as a tree to its transformation into a finished piece of furniture, specifically a table. The diagram begins with a stylized tree, followed by a cut log, then a stack of processed lumber or planks, and finally, a completed table. Rendered in a simple black silhouette on a white background, this vector graphic effectively conveys the journey of wood from raw material to a manufactured product. Ideal for infographics, educational content, business presentations on forestry, carpentry, manufacturing, and sustainable resource management.
Free with trial This vector illustration depicts the architectural project development process in a clear, step-by-step flowchart. It features five distinct stages: client consultation, conceptual sketches, 3D modeling, construction blueprints, and project supervision. Each stage is represented by a minimalist black and white line icon with a corresponding text label, connected by arrows on a clean white background. This infographic is ideal for illustrating design and construction workflows, business presentations, educational materials, or any content explaining project management in the building industry. Sequential vectors Architectural Project Development Process Flowchart. This vector illustration depicts the architectural project development process in a clear, step-by-step. This vector illustration depicts the architectural project development process in a clear, step-by-step flowchart. It features five distinct stages: client consultation, conceptual sketches, 3D modeling, construction blueprints, and project supervision. Each stage is represented by a minimalist black and white line icon with a corresponding text label, connected by arrows on a clean white background. This infographic is ideal for illustrating design and construction workflows, business presentations, educational materials, or any content explaining project management in the building industry.
Free with trial This black and white vector infographic illustrates the complete news cycle, from an event occurring to its public consumption. It outlines five key stages: an event taking place, a journalist gathering facts, the writing and editing phase, publishing through press or web, and finally, the public consuming the information. This clear, sequential diagram is ideal for presentations, educational materials, or articles explaining media workflow, journalism ethics, or information dissemination in a simple, visual manner. Sequential vectors News Production and Consumption Process Infographic. This black and white vector infographic illustrates the complete news cycle, from an event occurring to its. This black and white vector infographic illustrates the complete news cycle, from an event occurring to its public consumption. It outlines five key stages: an event taking place, a journalist gathering facts, the writing and editing phase, publishing through press or web, and finally, the public consuming the information. This clear, sequential diagram is ideal for presentations, educational materials, or articles explaining media workflow, journalism ethics, or information dissemination in a simple, visual manner.
Free with trial This flat illustration depicts steps to success, a rising progress ladder with numbers indicating sequential stages against a solid background. Sequential vectors Infographic Steps to Success: Flat Illustration of a Rising Progress Ladder. This flat illustration depicts steps to success, a rising progress ladder with. This flat illustration depicts steps to success, a rising progress ladder with numbers indicating sequential stages against a solid background.
Free with trial This comic book layout depicts several individuals engaging in dialogue, capturing various interactions and emotions. The panels display bold colors and dynamic character designs. Sequential vectors Contemporary Comic Book Panel Layout with Characters in a Business Setting. This comic book layout depicts several individuals engaging in dialogue, capturing. This comic book layout depicts several individuals engaging in dialogue, capturing various interactions and emotions. The panels display bold colors and dynamic character designs.
Free with trial Minimalist black and white vector illustration of a continuous workflow cycle featuring a gear and directional arrows, ideal for business, technology, and process management presentations. Sequential vectors Circular process flow diagram with gear and arrows for business workflow. Minimalist black and white vector illustration of a continuous workflow cycle featuring. Minimalist black and white vector illustration of a continuous workflow cycle featuring a gear and directional arrows, ideal for business, technology, and process management presentations
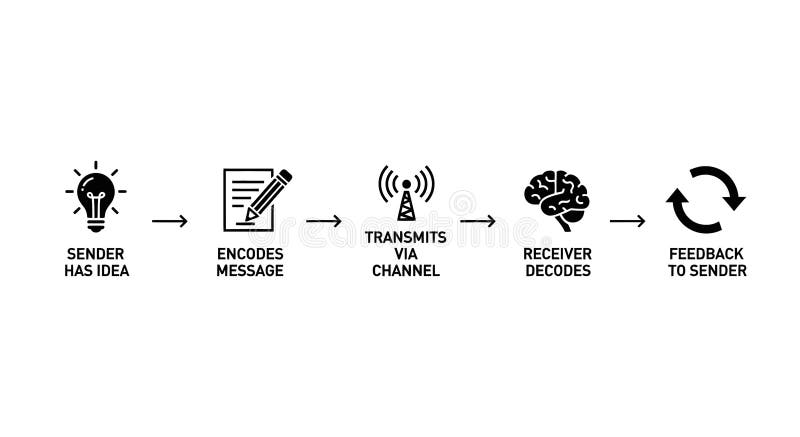
Free with trial This clear, conceptual illustration depicts the fundamental stages of the communication process. It starts with the sender having an idea (lightbulb), followed by encoding the message (document and pencil), transmitting it via a channel (antenna), and then the receiver decoding the message (brain). The diagram concludes with a crucial feedback loop back to the sender, highlighting the cyclical nature of effective communication. Ideal for educational materials, business presentations, training, and explaining communication theory. Sequential vectors Basic Communication Process Model with Feedback Loop. This clear, conceptual illustration depicts the fundamental stages of the communication process. It starts. This clear, conceptual illustration depicts the fundamental stages of the communication process. It starts with the sender having an idea (lightbulb), followed by encoding the message (document and pencil), transmitting it via a channel (antenna), and then the receiver decoding the message (brain). The diagram concludes with a crucial feedback loop back to the sender, highlighting the cyclical nature of effective communication. Ideal for educational materials, business presentations, training, and explaining communication theory.
Free with trial Colorful Milestone Roadmap Illustration with Cars, Traffic Lights, and Finish Line Icons. Vector Illustration. Sequential vectors Colorful Milestone Roadmap Illustration with Cars, Traffic Lights, and Finish Line Icons. Vector Illustration
Free with trial A clean, modern infographic featuring three sequential elements (social, strategy, and analytics) presented on layered white cards with a bold red origami-style background. The design includes icons of people, a cloud, a plane, and data bars to illustrate connectivity, growth, and communication. Ideal for marketing, business strategy, or digital media concepts, this image suits presentations, reports, and web content requiring a sleek data visualization aesthetic. Sequential vectors Infographic Presentation: Social Strategy Steps with Modern Paper Art Design. A clean, modern infographic featuring three sequential elements (social, strategy. A clean, modern infographic featuring three sequential elements (social, strategy, and analytics) presented on layered white cards with a bold red origami-style background. The design includes icons of people, a cloud, a plane, and data bars to illustrate connectivity, growth, and communication. Ideal for marketing, business strategy, or digital media concepts, this image suits presentations, reports, and web content requiring a sleek data visualization aesthetic.
Free with trial A series of textured, egg-like forms are arranged in a growing sequence across a neutral landscape under soft ambient light. The composition evokes themes of growth and progression, making it perfect for developmental concept backgrounds. This minimalist scene captures a sense of rhythmic order through simple shapes. Generated with AI. Sequential vectors Sequential Textured Egg Shapes Arranged in an Ascending Curve with Muted Earthy Tones. A series of textured, egg-like forms are arranged in a growing sequence. A series of textured, egg-like forms are arranged in a growing sequence across a neutral landscape under soft ambient light. The composition evokes themes of growth and progression, making it perfect for developmental concept backgrounds. This minimalist scene captures a sense of rhythmic order through simple shapes. Generated with AI
Free with trial This infographic illustrates the taxation cycle, showing how citizens and businesses contribute taxes. The process begins with taxpayers, followed by government collection of funds. These collected taxes are then budgeted and allocated for various public services, represented by a pie chart and bar graph. Finally, a significant portion of these funds is directed towards infrastructure development, depicted by a construction crane building a bridge and road. This clear, sequential diagram highlights the essential link between tax contributions and public investment. Sequential vectors Taxation Cycle and Infrastructure Development Process. This infographic illustrates the taxation cycle, showing how citizens and businesses contribute taxes. The. This infographic illustrates the taxation cycle, showing how citizens and businesses contribute taxes. The process begins with taxpayers, followed by government collection of funds. These collected taxes are then budgeted and allocated for various public services, represented by a pie chart and bar graph. Finally, a significant portion of these funds is directed towards infrastructure development, depicted by a construction crane building a bridge and road. This clear, sequential diagram highlights the essential link between tax contributions and public investment.
Free with trial Outline Handdrawn Three Number Document Icon Representing Pages. Sequential vectors A simple outline icon depicting three paper documents, with the number three clearly visible on the top sheet. This graphic is. Outline Handdrawn Three Number. Outline Handdrawn Three Number Document Icon Representing Pages
Free with trial Three-step timeline infographic featuring circular icons connected by colored lines. The first circle on the left is green with a white rocket icon. The middle circle is red with a white house icon. The right circle is orange with a white location pin icon. Beneath each circle, placeholder text is paired with a title. The overall design is simplistic with a mix of vibrant colors, providing a clear visual flow. The top of the infographic includes a bold heading. Sequential vectors 3 steps timeline infographics. Three-step timeline infographic featuring circular icons connected by colored lines. The first circle on the left is green with a. Three-step timeline infographic featuring circular icons connected by colored lines. The first circle on the left is green with a white rocket icon. The middle circle is red with a white house icon. The right circle is orange with a white location pin icon. Beneath each circle, placeholder text is paired with a title. The overall design is simplistic with a mix of vibrant colors, providing a clear visual flow. The top of the infographic includes a bold heading.
Free with trial Line graph illustrating performance increase across four sequential quarters on transparent background. Sequential vectors Performance growth chart showing upward trend over four quarters timeline. Line graph illustrating performance increase across four sequential quarters on. Line graph illustrating performance increase across four sequential quarters on transparent background
 Sign in