Free with trial Database and table icons - Vector Icon Set. Split data vectors Database and table icons. Vector Icon Set
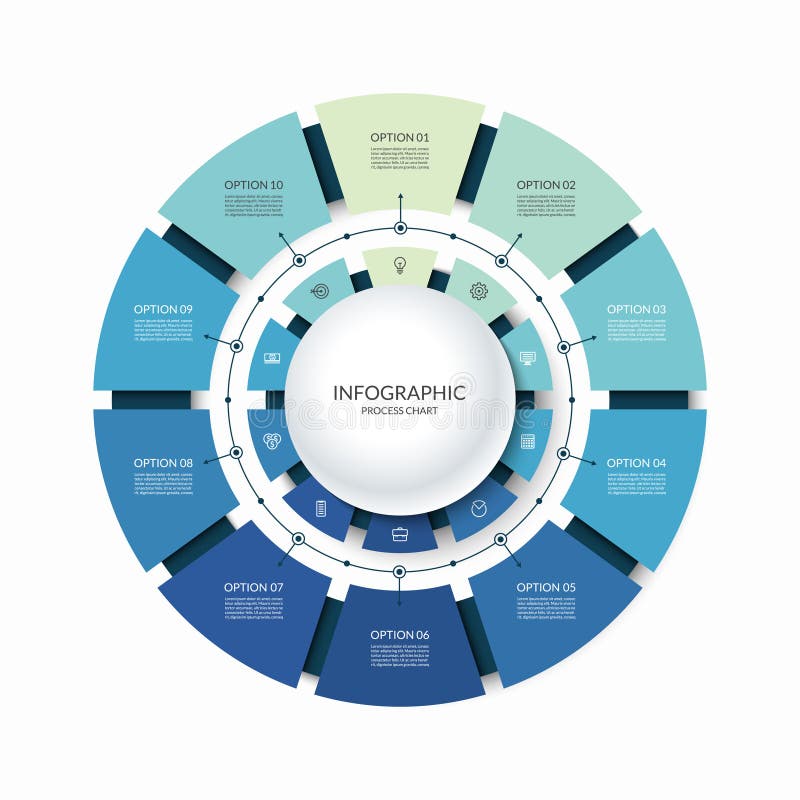
Free with trial Infographic circular chart divided into 10 parts. Step-by step cycle diagram with ten options designed for report, presentation, data visualization. Split data vectors Infographic circular chart divided into 10 parts. Step-by step cycle diagram with ten options. Infographic circular chart divided into 10 parts. Step-by step. Infographic circular chart divided into 10 parts. Step-by step cycle diagram with ten options designed for report, presentation, data visualization.
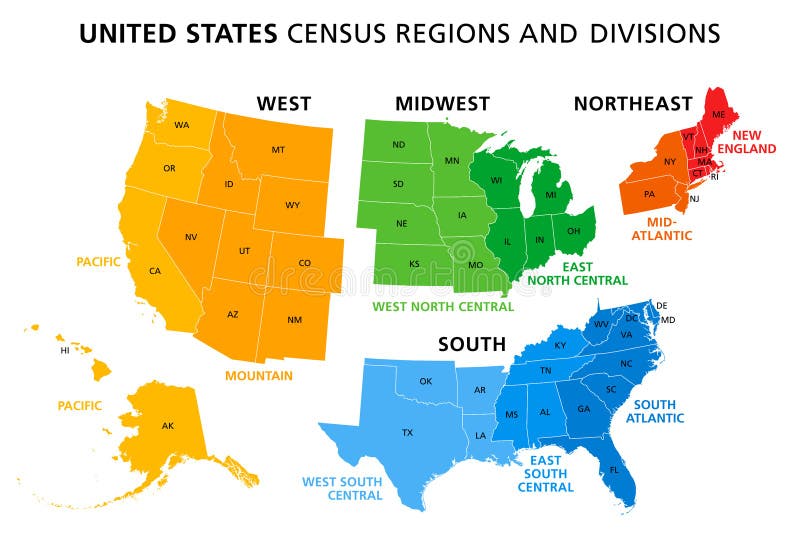
Free with trial Map of United States split into Census regions and divisions. Region definition, widely used for data collection and analysis. Most commonly used classification system. English. Illustration. Vector. Split data vectors Map of United States split into Census regions and divisions. Region definition, widely used for data collection and analysis. Most commonly used
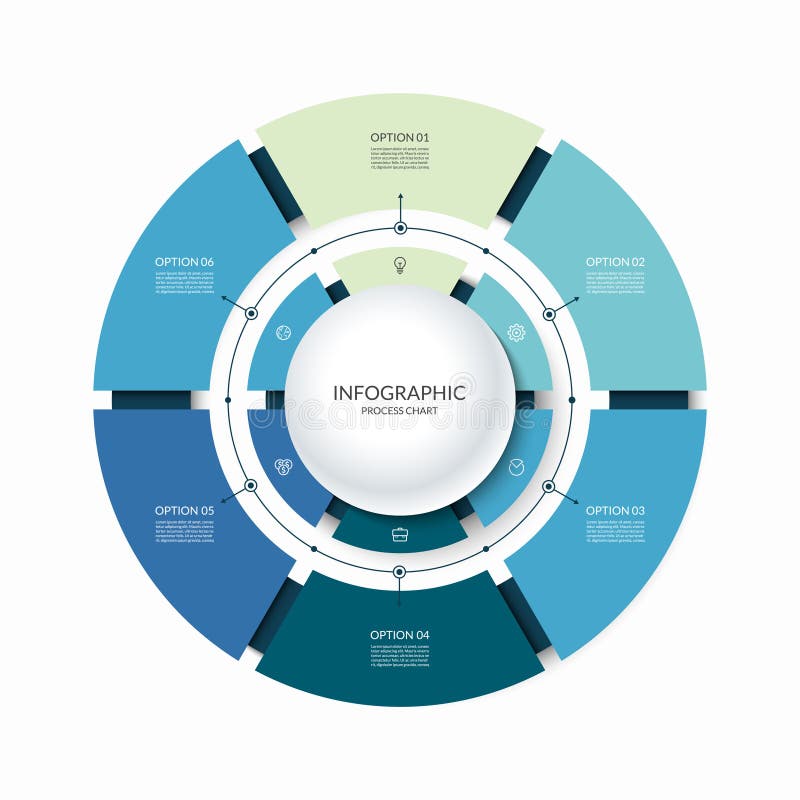
Free with trial Infographic circular chart divided into 6 parts. Step-by step cycle diagram with six options designed for report, presentation, data visualization. Split data vectors Infographic circular chart divided into 6 parts. Step-by step cycle diagram with six options. Infographic circular chart divided into 6 parts. Step-by step. Infographic circular chart divided into 6 parts. Step-by step cycle diagram with six options designed for report, presentation, data visualization.
Free with trial Multitasking Interface Choose Window Hand Finger. List Online Folders Cloud Internet Data File Icon Documents Browser Window Vector Illustration. Split data vectors Multitasking Interface Choose Window Hand Finger. List Online Folders Cloud Internet Data File Icon Documents Browser Window Vector Illustration
Free with trial Blueprint PDA split screen illustration; realistic PDA rendering is on separate layer and complete. Split data vectors Blueprint PDA Device. Blueprint PDA split screen illustration; realistic PDA rendering is on separate layer and complete. Blueprint PDA split screen illustration; realistic PDA rendering is on separate layer and complete.
Free with trial Concept of landing page optimization via split testing method for better conversion rate. Flat design marketing illustration. Split data vectors Split testing - ab testing - landing page optimization. Flat design vector banner. Concept of landing page optimization via split testing method for better. Concept of landing page optimization via split testing method for better conversion rate. Flat design marketing illustration.
Free with trial Infographic semi circular chart divided into 3 parts. Step-by step diagram with three options designed for report, presentation, data visualization. Split data vectors Infographic semi circular chart divided into 3 parts. Step-by step diagram with three options. Infographic semi circular chart divided into 3 parts. Step-by. Infographic semi circular chart divided into 3 parts. Step-by step diagram with three options designed for report, presentation, data visualization.
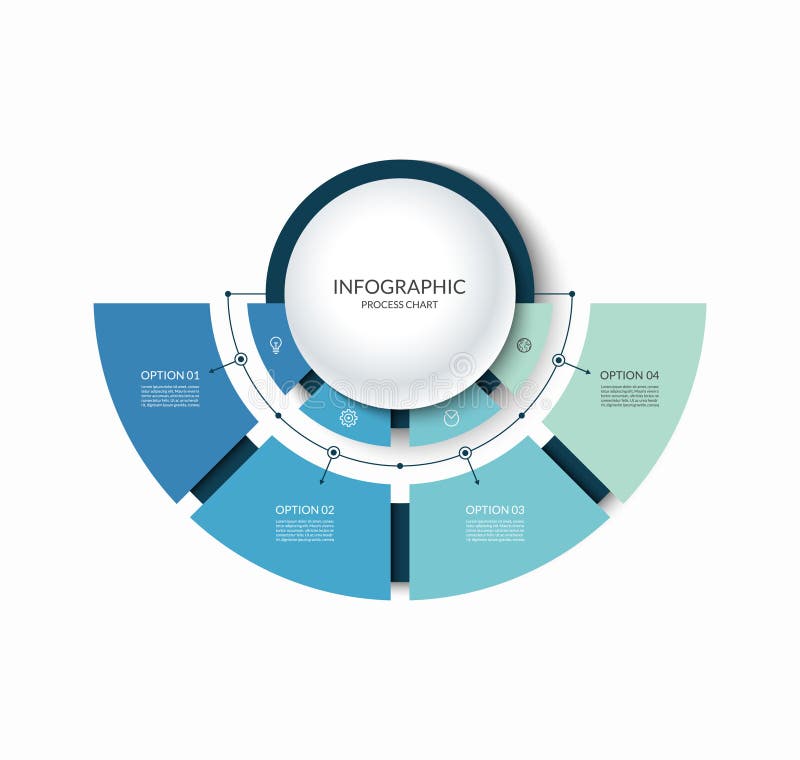
Free with trial Infographic semi circular chart divided into 4 parts. Step-by step diagram with four options designed for report, presentation, data visualization. Split data vectors Infographic semi circular chart divided into 4 parts. Step-by step diagram with four options. Infographic semi circular chart divided into 4 parts. Step-by step. Infographic semi circular chart divided into 4 parts. Step-by step diagram with four options designed for report, presentation, data visualization.
Free with trial Infographic semi circular chart divided into 3 parts. Step-by step diagram with three options designed for report, presentation, data visualization. Split data vectors Infographic semi circular chart divided into 3 parts. Step-by step diagram with three options. Infographic semi circular chart divided into 3 parts. Step-by. Infographic semi circular chart divided into 3 parts. Step-by step diagram with three options designed for report, presentation, data visualization.
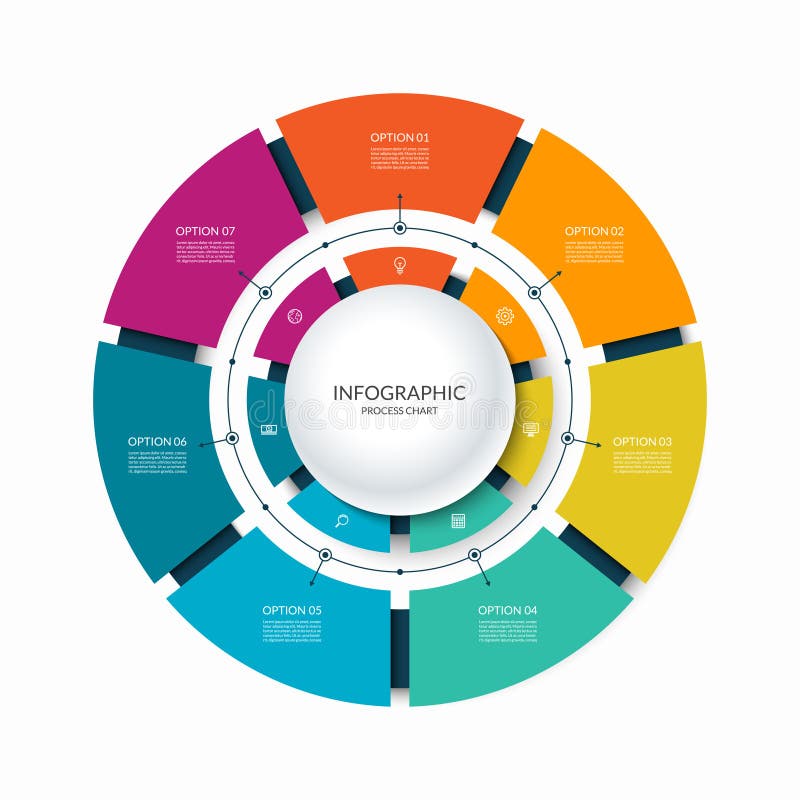
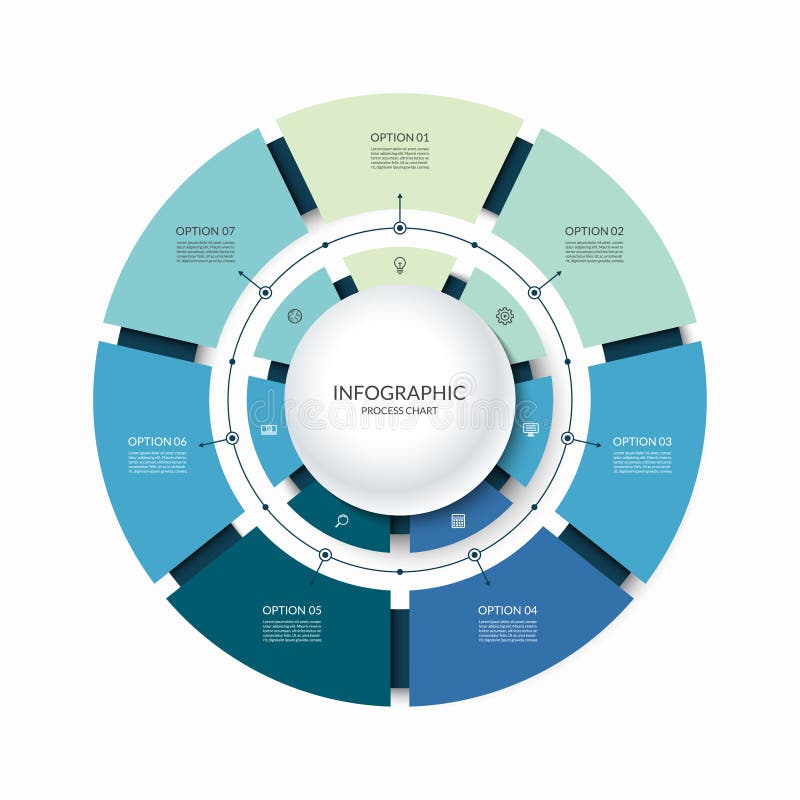
Free with trial Infographic circular chart divided into 7 parts. Step-by step cycle diagram with seven options designed for report, presentation, data visualization. Split data vectors Infographic circular chart divided into 7 parts. Step-by step cycle diagram with seven options. Infographic circular chart divided into 7 parts. Step-by step. Infographic circular chart divided into 7 parts. Step-by step cycle diagram with seven options designed for report, presentation, data visualization.
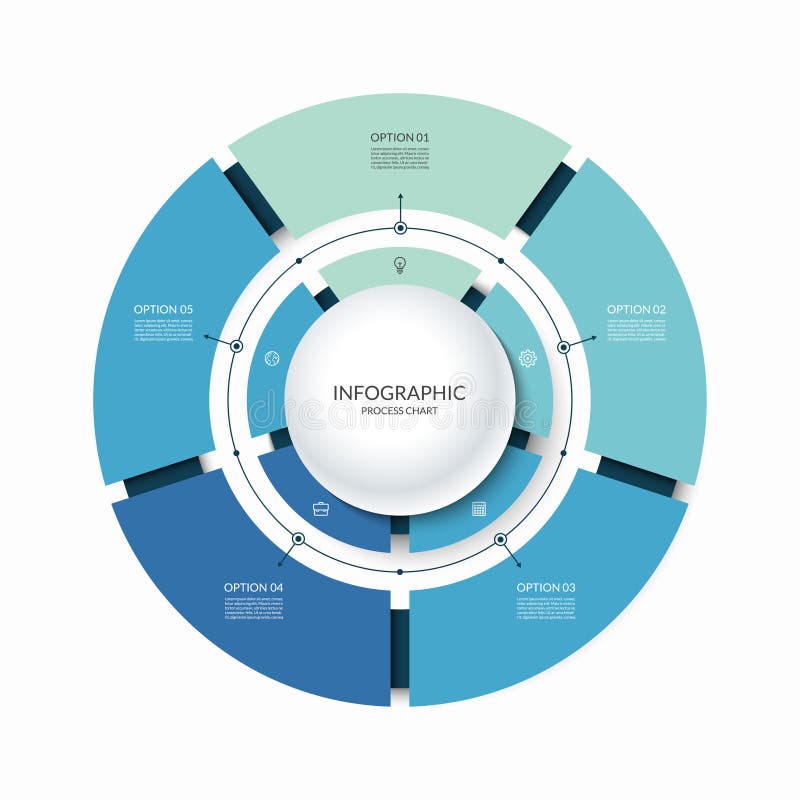
Free with trial Infographic circular chart divided into 5 parts. Step-by step cycle diagram with five options designed for report, presentation, data visualization. Split data vectors Infographic circular chart divided into 5 parts. Step-by step cycle diagram with five options. Infographic circular chart divided into 5 parts. Step-by step. Infographic circular chart divided into 5 parts. Step-by step cycle diagram with five options designed for report, presentation, data visualization.
Free with trial High fiber foods vector infographics. High fiber foods infographics. Barley and bran flakes, black bean, split peas, pear and artichoke, vector illustration. Split data vectors High fiber foods vector infographics. High fiber foods infographics. Barley and bran flakes, black bean, split peas, pear and artichoke, vector illustration
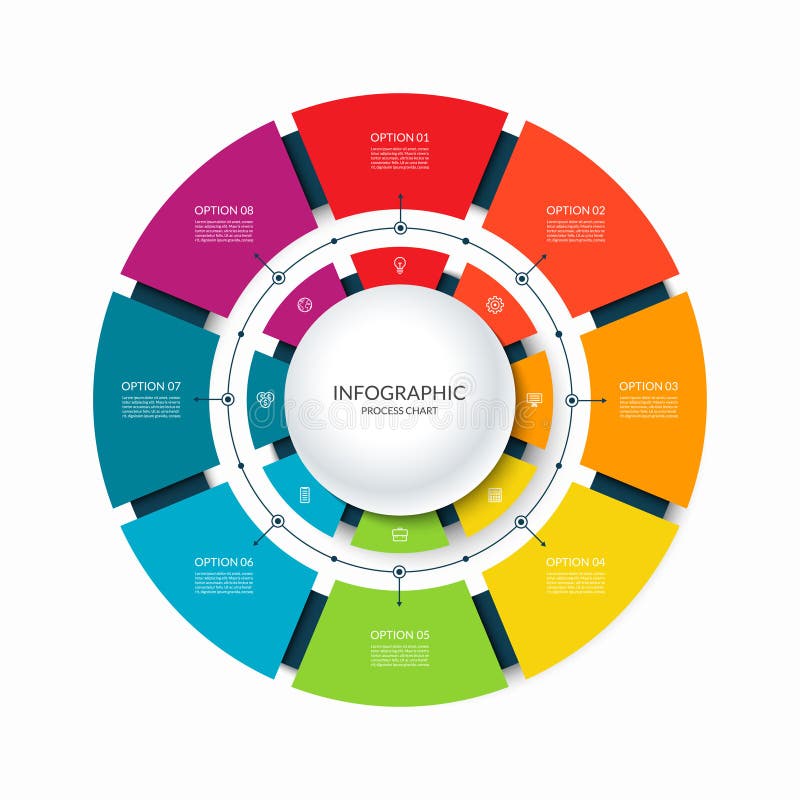
Free with trial Infographic circular chart divided into 8 parts. Step-by step cycle diagram with eight options designed for report, presentation, data visualization. Split data vectors Infographic circular chart divided into 8 parts. Step-by step cycle diagram with eight options. Infographic circular chart divided into 8 parts. Step-by step. Infographic circular chart divided into 8 parts. Step-by step cycle diagram with eight options designed for report, presentation, data visualization.
Free with trial Infographic circular chart divided into 10 parts. Step-by step cycle diagram with ten options designed for report, presentation, data visualization. Split data vectors Infographic circular chart divided into 10 parts. Step-by step cycle diagram with ten options. Infographic circular chart divided into 10 parts. Step-by step. Infographic circular chart divided into 10 parts. Step-by step cycle diagram with ten options designed for report, presentation, data visualization.
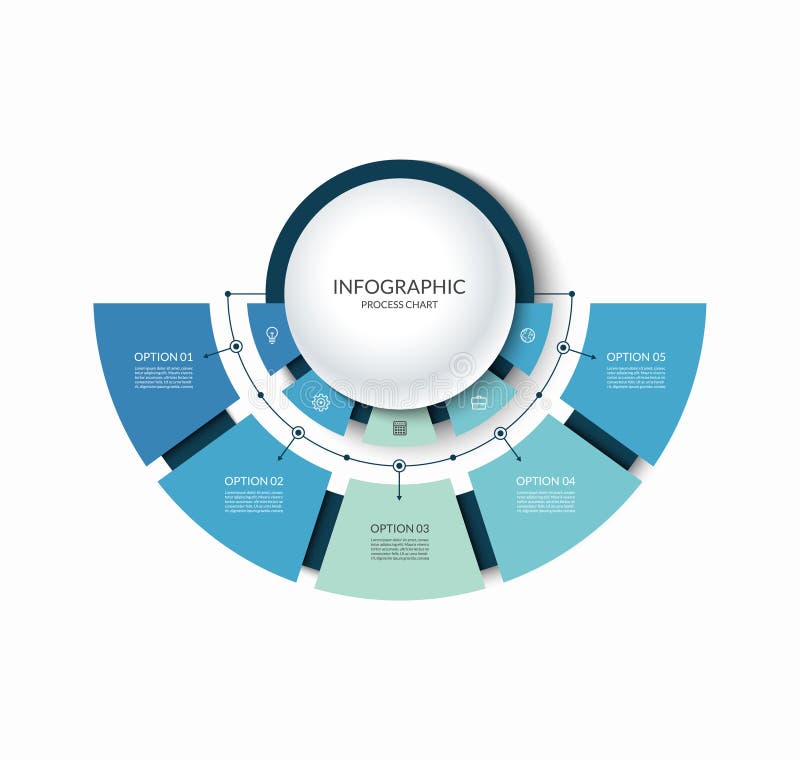
Free with trial Infographic semi circular chart divided into 5 parts. Step-by step diagram with five options designed for report, presentation, data visualization. Split data vectors Infographic semi circular chart divided into 5 parts. Step-by step diagram with five options. Infographic semi circular chart divided into 5 parts. Step-by step. Infographic semi circular chart divided into 5 parts. Step-by step diagram with five options designed for report, presentation, data visualization.
Free with trial Infographic circular chart divided into 7 parts. Step-by step cycle diagram with seven options designed for report, presentation, data visualization. Split data vectors Infographic circular chart divided into 7 parts. Step-by step cycle diagram with seven options. Infographic circular chart divided into 7 parts. Step-by step. Infographic circular chart divided into 7 parts. Step-by step cycle diagram with seven options designed for report, presentation, data visualization.
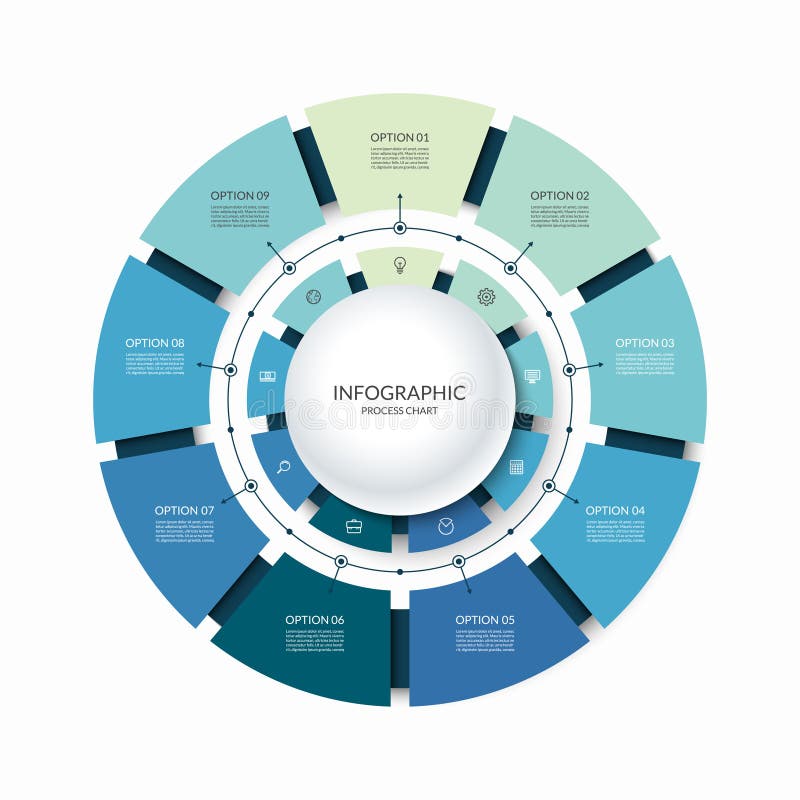
Free with trial Infographic circular chart divided into 9 parts. Step-by step cycle diagram with nine options designed for report, presentation, data visualization. Split data vectors Infographic circular chart divided into 9 parts. Step-by step cycle diagram with nine options. Infographic circular chart divided into 9 parts. Step-by step. Infographic circular chart divided into 9 parts. Step-by step cycle diagram with nine options designed for report, presentation, data visualization.
Free with trial Binary breakdown. Editable vector abstract design of broken code. Split data vectors Binary breakdown. Editable vector abstract design of broken code
Free with trial Pie chart. Color 3d pie chart vector illustration. Split data vectors Pie chart. Color 3d pie chart vector illustration
Free with trial Two large groups of diverse people divided in half by a large open area, isolated on a white background. Split data vectors People divided illustration. Two large groups of diverse people divided in half by a large open area, isolated on a white background. Two large groups of diverse people divided in half by a large open area, isolated on a white background.
Free with trial Broken Polygonal Wireframe Sphere. Fractured Geometric Form. Lines Network Polygons of Circle - Illustration Vector. Split data vectors Broken Polygonal Wireframe Sphere. Fractured Geometric Form. Lines Network Polygons of Circle. Illustration Vector
Free with trial Broken Polygonal Wireframe Sphere. Geometric Form. Lines Network Polygons of Circle - Illustration Vector. Split data vectors Broken Polygonal Wireframe Sphere. Geometric Form. Lines Network Polygons of Circle. Illustration Vector
Free with trial Bipolar disorder infographic. With sample data. Vector illustration. Split data vectors Bipolar disorder infographic. With sample data. Vector illustration
Free with trial Software testing flat icon. Software testing vector illustration. Flat design. Software testing successful. AB testing split comparison web design. Split data vectors Software testing flat icon. Software testing vector illustration. Flat design. Software testing successful. AB testing split comparison web design
Free with trial Vector infographic circle five options design can split data for explain of work ,presentation and planning business. Split data vectors Vector infographic circle five options design can split data for explain of work. Presentation and planning business
Free with trial An innovative flat vector illustration of a human brain split into two halves, depicted as circuit boards with flowing data lines, representing digital thought and cognitive processes. This cutting-edge design is perfect for themes of AI, neuroscience, dual processing, or complex computational concepts. vector design Generative AI. Split data vectors Split Brain Circuitry Digital Thought, vector design Generative AI. An innovative flat vector illustration of a human brain split into two halves, depicted as. An innovative flat vector illustration of a human brain split into two halves, depicted as circuit boards with flowing data lines, representing digital thought and cognitive processes. This cutting-edge design is perfect for themes of AI, neuroscience, dual processing, or complex computational concepts. vector design Generative AI
Free with trial Stock split company do exchange transaction to increase the number of shares by issuing more shares to current. Shareholders vector. Split data vectors Stock split company do exchange transaction to increase the number of shares by issuing more shares to current. Shareholders vector
Free with trial A Cluster splitting into two sub-clusters. Clustering with mixed class labeling split into two groups according to class label of data in the cluster. Split data vectors A Cluster splitting into two sub-clusters. Clustering with mixed class labeling split into two groups according to class label of data in the cluster
Free with trial Multiple Screens Displayed on Computer Monitor for Efficient Multitasking, Financial data indicators on a monitor, Stock market or. Forex trading graph, AI. Split data vectors Multiple Screens Displayed on Computer Monitor for Efficient Multitasking, Financial data indicators on a monitor, Stock market or. Forex trading graph, AI
Free with trial Infographic template with a circle and 4 rectangular parts, elements. Diagram or chart with four options. Can be used for business presentation, brochure, web design, data visualization. Split data vectors Infographic template with 4 options. Infographic template with a circle and 4 rectangular parts, elements. Diagram or chart with four options. Can be used for. Infographic template with a circle and 4 rectangular parts, elements. Diagram or chart with four options. Can be used for business presentation, brochure, web design, data visualization.
Free with trial Landing page template of Simple Data analysis tool. Modern flat design concept of web page design for website and mobile website. Easy to edit and customize. Vector illustration. Split data vectors Flat Modern design of wesite template - Simple Data analysis too. Landing page template of Simple Data analysis tool. Modern flat design concept of web page. Landing page template of Simple Data analysis tool. Modern flat design concept of web page design for website and mobile website. Easy to edit and customize. Vector illustration
Free with trial Landing page template of Data analysis team. Modern flat design concept of web page design for website and mobile website. Easy to edit and customize. Vector illustration. Split data vectors Flat Modern design of wesite template - Data analysis team. Landing page template of Data analysis team. Modern flat design concept of web page design for. Landing page template of Data analysis team. Modern flat design concept of web page design for website and mobile website. Easy to edit and customize. Vector illustration
Free with trial Infographic circular chart divided into 8 parts. Step-by step cycle diagram with eight options designed for report, presentation, data visualization. Split data vectors Infographic circular chart divided into 8 parts. Step-by step cycle diagram with eight options. Infographic circular chart divided into 8 parts. Step-by step. Infographic circular chart divided into 8 parts. Step-by step cycle diagram with eight options designed for report, presentation, data visualization.
Free with trial Infographic circular chart divided into 3 parts. Step-by step cycle diagram with three options designed for report, presentation, data visualization. Split data vectors Infographic circular chart divided into 3 parts. Step-by step cycle diagram with three options. Infographic circular chart divided into 3 parts. Step-by step. Infographic circular chart divided into 3 parts. Step-by step cycle diagram with three options designed for report, presentation, data visualization.
Free with trial Infographic circular chart divided into 3 parts. Step-by step cycle diagram with three options designed for report, presentation, data visualization. Split data vectors Infographic circular chart divided into 3 parts. Step-by step cycle diagram with three options. Infographic circular chart divided into 3 parts. Step-by step. Infographic circular chart divided into 3 parts. Step-by step cycle diagram with three options designed for report, presentation, data visualization.
Free with trial Artificial intelligence vs human brain concept vector illustration. Split brain design with digital circuit side and human organic side divided by lightning bolt. Symbol of technology versus humanity intelligence innovation and future thinking. Split data vectors AI vs Human brain comparison artificial intelligence and human thinking concept. Artificial intelligence vs human brain concept vector illustration. Split brain. Artificial intelligence vs human brain concept vector illustration. Split brain design with digital circuit side and human organic side divided by lightning bolt. Symbol of technology versus humanity intelligence innovation and future thinking.
Free with trial Infographic circular chart divided into 6 parts. Step-by step cycle diagram with six options designed for report, presentation, data visualization. Split data vectors Infographic circular chart divided into 6 parts. Step-by step cycle diagram with six options. Infographic circular chart divided into 6 parts. Step-by step. Infographic circular chart divided into 6 parts. Step-by step cycle diagram with six options designed for report, presentation, data visualization.
Free with trial Infographic semi circular chart divided into 4 parts. Step-by step diagram with four options designed for report, presentation, data visualization. Split data vectors Infographic semi circular chart divided into 4 parts. Step-by step diagram with four options. Infographic semi circular chart divided into 4 parts. Step-by step. Infographic semi circular chart divided into 4 parts. Step-by step diagram with four options designed for report, presentation, data visualization.
Free with trial Landing page template of Data Analysis process. Modern flat design concept of web page design for website and mobile website. Easy to edit and customize. Vector illustration. Split data vectors Flat Modern design of wesite template - Data analysis process. Landing page template of Data Analysis process. Modern flat design concept of web page design for. Landing page template of Data Analysis process. Modern flat design concept of web page design for website and mobile website. Easy to edit and customize. Vector illustration
Free with trial Modern concept of ab testing, website sales page performance, click through rate optimization, conversion analysis. Flat design vector illustration. Split data vectors Website split test, ab testing, landing page performance, expert analyzing ab test result. Flat design vector banner. Modern concept of ab testing, website. Modern concept of ab testing, website sales page performance, click through rate optimization, conversion analysis. Flat design vector illustration.
Free with trial Infographic circular chart divided into 5 parts. Step-by step cycle diagram with five options designed for report, presentation, data visualization. Split data vectors Infographic circular chart divided into 5 parts. Step-by step cycle diagram with five options. Infographic circular chart divided into 5 parts. Step-by step. Infographic circular chart divided into 5 parts. Step-by step cycle diagram with five options designed for report, presentation, data visualization.
Free with trial Infographic template with a circle and 4 rectangular parts, elements. Diagram or chart with four options. Can be used for business presentation, brochure, web design, data visualization. Split data vectors Infographic template with a circle and 4 rectangular parts, elements. Diagram or chart with four options. Can be used for business presentation, brochure, web
Free with trial Infographic square template with 4 steps, parts, elements. Diagram or chart with four options. Can be used for business presentation, brochure, web design, data visualization. Split data vectors Infographic square template with 4 steps, parts, elements. Diagram or chart with four options. Can be used for business presentation, brochure, web design
Free with trial Vector illustration depicts concept of different group, equal tally, demographic, same result, and opposite team. Split data vectors Pie chart showing people are split into 50 50 percent in survey and census. Vector illustration depicts concept of different group, equal tally, demographic. Vector illustration depicts concept of different group, equal tally, demographic, same result, and opposite team
Free with trial Broken head, 3d illustration. The split face of a person. Eps10. Split data vectors Broken head, 3d illustration. The split face of a person. Eps10. Broken head, 3d illustration. The split face of a person
Free with trial Broken head, 3d illustration. The split face of a person. Eps10. Split data vectors Broken head, 3d illustration. The split face of a person. Eps10. Broken head, 3d illustration. The split face of a person
Free with trial Fact analysis and evaluation RGB color icon. Split complex topic into theses. Critical thinking. Analyse information and data. Isolated vector illustration. Simple filled line drawing. Split data vectors Fact analysis and evaluation RGB color icon. Split complex topic into theses. Critical thinking. Analyse information and data. Isolated vector illustration
Free with trial Broken head, 3d illustration. The split face of a person. Eps10. Split data vectors Broken head, 3d illustration. The split face of a person. Eps10. Broken head, 3d illustration. The split face of a person
Free with trial Fact analysis and evaluation black glyph icon. Split complex topic into theses. Critical thinking. Analyse information and data. Silhouette symbol on white space. Vector isolated illustration. Split data vectors Fact analysis and evaluation black glyph icon. Split complex topic into theses. Critical thinking. Analyse information and data. Silhouette symbol on white
Free with trial Flat illustration about stock spilt, a theory based on company stock share split or dividing. Split data vectors Flat illustration about stock spilt. A theory based on company stock share split or dividing
Free with trial Vector illustration of charts in human head. Split data vectors Brain charts. Vector illustration of charts in human head. Vector illustration of charts in human head.
Free with trial Infographic vector 3d big pie chart set a range of percentages to drag and drop into your project with editable transparent drop shadows made in illustrator. Split data vectors Infographic Vector 3d Pie Chart Sets C. Infographic vector 3d big pie chart set a range of percentages to drag and drop into your project with editable. Infographic vector 3d big pie chart set a range of percentages to drag and drop into your project with editable transparent drop shadows made in illustrator
Free with trial 3d Pie Chart. Color 3d pie chart on blue background, vector illustration. Split data vectors 3d Pie Chart. Color 3d pie chart on blue background, vector illustration
Free with trial Measuring brain charts. Set of brain icons of measuring charts. Split data vectors Measuring brain charts. Set of brain icons of measuring charts
Free with trial Vector EPS 10 rose diagram infographics. Four different variables, split 12 and 8 and 6 and 4. Split data vectors Rose diagram builder infographics. Vector EPS 10 rose diagram infographics. Four different variables, split 12 and 8 and 6 and 4. Vector EPS 10 rose diagram infographics. Four different variables, split 12 and 8 and 6 and 4.
Free with trial Set of Vector Elements. Abstract Social and Media Symbols for Your Infographic or Cover Design. Mix of Colorful Shapes. Split data vectors Abstract Social and Media Symbols for Your Infographic or Cover Design. Set of Vector Elements. Abstract Social and Media Symbols for Your Infographic or Cover. Set of Vector Elements. Abstract Social and Media Symbols for Your Infographic or Cover Design. Mix of Colorful Shapes
Free with trial Pie chart infographic wheel piece diagram. Infographic pie chart circle section slice segment. Split data vectors Pie chart infographic wheel piece diagram. Infographic pie chart circle section slice segment.
Free with trial Business market share concept. Businessman stands on pie chart. Cartoon Vector Illustration. Split data vectors Business market share concept. Businessman stands on pie chart. Cartoon Vector Illustration
Free with trial Modern Flat Purple color line designed concepts icons for Seo Optimization, Web Development, Api Interface and Split Testing. Can be used for Web Project and Applications. Vector Illustration. Split data vectors Flat line Purple Designed Concepts 13. Modern Flat Purple color line designed concepts icons for Seo Optimization, Web Development, Api Interface and Split. Modern Flat Purple color line designed concepts icons for Seo Optimization, Web Development, Api Interface and Split Testing. Can be used for Web Project and Applications. Vector Illustration
Free with trial Multipurpose Venn diagram schema template with five oval sets and their intersections, detailed descriptions and sample texts. Split data vectors Multipurpose Venn diagram schema template with five elements. Multipurpose Venn diagram schema template with five oval sets and their intersections, detailed. Multipurpose Venn diagram schema template with five oval sets and their intersections, detailed descriptions and sample texts
Free with trial Multipurpose Venn diagram schema template with three circles. Blue and red circle sets with purple intersection, detailed descriptions and sample texts. Split data vectors Multipurpose Venn diagram schema template with three circles. Blue and red circle sets with purple intersection, detailed descriptions and sample texts
Free with trial Broken Wireframe Sphere. Fractured Geometric Form. Lines Network Polygons of Circle - Illustration Vector. Split data vectors Broken Wireframe Sphere. Fractured Geometric Form. Lines Network Polygons of Circle. Illustration Vector
Free with trial Set line icons. Vector. Tools editor. Set line thin icons. Split data vectors Set line icons. Vector. Tools editor. Set line thin icons. Vector. Tools editor
Free with trial Two arrow double direction option way. Fork path two pathway multi traffic traffic icon. Fork path two pathway multi. Split data vectors Two arrow double direction option way. Fork path two pathway multi traffic traffic icon. Two arrow double direction option way. Fork path two pathway multi
Free with trial Multipurpose Venn diagram dark schema template green and red circle sets with purple intersection, detailed descriptions and sample texts. Split data vectors Multipurpose Venn diagram schema template. Multipurpose Venn diagram dark schema template green and red circle sets with purple intersection, detailed. Multipurpose Venn diagram dark schema template green and red circle sets with purple intersection, detailed descriptions and sample texts
Free with trial Baby infographic. Vector illustration of beautiful newborn infographics. Pink and blue split template with child care graphic objects in cartoonish style. Split data vectors Baby infographic. Vector illustration of beautiful newborn infographics. Pink and blue split template with child care graphic objects in cartoonish style
Free with trial Concept illustrator vector of Split letter `P`Initial Business name logo template. Split data vectors Letters P Company Logo Design. Concept illustrator vector of Split letter `P`Initial Business name logo template. Concept illustrator vector of Split letter `P`Initial Business name logo template.
Free with trial Climate Control Systems Isometric Flowchart. With home devises intended for saving comfortable temperature in room vector illustration. Split data vectors Climate Control Systems Isometric Flowchart. With home devises intended for saving comfortable temperature in room vector illustration
Free with trial Set line CD or DVD disk setting Air conditioner Radio Time management Microwave oven Video camera Blender with bowl and Security icon. Vector. Split data vectors Set line CD or DVD disk setting, Air conditioner, Radio, Time management, Microwave oven, Video camera, Blender with. Set line CD or DVD disk setting Air. Set line CD or DVD disk setting Air conditioner Radio Time management Microwave oven Video camera Blender with bowl and Security icon. Vector.
Free with trial Market share business concept. Businesspeople pushing in different directions pie chart. Economic financial share profit. Vector illustration flat design. Isolated on white background. Split data vectors Market share business concept. Businesspeople pushing in different directions pie chart. Economic financial share profit. Vector illustration flat design
Free with trial Market share business concept. Competing businessman holding in hand pie chart. Competing. Economic financial share profit. Vector illustration flat design. Isolated on white background. Split data vectors Market share business concept. Competing businessman holding in hand pie chart. Competing. Economic financial share profit. Vector illustration flat design
Free with trial Web development - linear round concepts. Vector linear concept of web development. Round banners for web server, virtual storage and adaptive layout technologies. Split data vectors Web development - linear round concepts. Vector linear concept of web development. Round banners for web server, virtual storage and adaptive layout technologies
Free with trial Resources allocation icon on white, eps 10 file, easy to edit. Split data vectors Resources allocation icon on white. Eps 10 file, easy to edit
Free with trial Randomized control group and experimental group in experimentation vector. Split data vectors Randomized control group and experimental group in experimentation vector. Randomized control group and experimental group in experimentation
Free with trial Different between randomized control group and experimental group in experimentation vector. Different between randomized control group and experimental group in. Split data vectors Different between randomized control group and experimental group in experimentation vector. Different between randomized control group and experimental group in
Free with trial Black circle divided into 12 equal sectors isolated on white background. Round shapes cut in twelve slices. Simple circular diagram, statistic wheel, business pie or pizza chart. Vector illustration. Split data vectors Black circle divided into 12 equal sectors isolated on white background. Round shapes cut in twelve slices. Simple. Circular diagram, statistic wheel, business. Black circle divided into 12 equal sectors isolated on white background. Round shapes cut in twelve slices. Simple circular diagram, statistic wheel, business pie or pizza chart. Vector illustration.
Free with trial Different between randomized control group and experimental group in experimentation vector. Different between randomized control group and experimental group in. Split data vectors Different between randomized control group and experimental group in experimentation vector. Different between randomized control group and experimental group in
Free with trial Circles divided into parts from 1 to 18. Black round chart for infographic, pie portion or pizza slice. Wheel division into fractions, circular shape sectors on white background. Split data vectors Circles divided into parts from 1 to 18. Black round chart for infographic, pie portion or pizza slice. Wheel division. Into fractions, circular shape sectors
Free with trial Chart pie with 0 5 10 15 20 25 30 35 40 45 50 55 60 65 70 75 80 85 90 95 100 percent. Percentage circle graph. Vector graphic statistic for presentation. Round diagram symbol. Split data vectors Chart pie with 0 5 10 15 20 25 30 35 40 45 50 55 60 65 70 75 80 85 90 95 100 percent. Percentage circle graph. Vector graphic statistic for presentation. Round
 Sign in