Free with trial Vector image. Developing children skills for drawing and coloring. Scale to any size without loss of resolution. Template example vectors Multiplication table by 7 for kids. Write the numbers in correct circles. Educational page for mathematics baby book. Vector image. Developing children skills. Vector image. Developing children skills for drawing and coloring. Scale to any size without loss of resolution.
Free with trial Vector image. Developing children skills for drawing and coloring. Scale to any size without loss of resolution. Template example vectors Multiplication table by 3 for kids. Write the numbers in correct circles. Educational page for mathematics baby book. Vector image. Developing children skills. Vector image. Developing children skills for drawing and coloring. Scale to any size without loss of resolution.
Free with trial Vector image. Developing children skills for drawing and coloring. Scale to any size without loss of resolution. Template example vectors Multiplication table by 8 for kids. Write the numbers in correct circles. Educational page for mathematics baby book. Vector image. Developing children skills. Vector image. Developing children skills for drawing and coloring. Scale to any size without loss of resolution.
Free with trial Create the image of face of clown using scissors and glue. Educational game for children. Template example vectors Create the image of face of clown using scissors and glue. Educational game for children
Free with trial Vector doodle style green palm tree. Coloring book pages with clear lineart and colored sample. Template example vectors Vector doodle style green palm tree. Coloring book pages with clear lineart and colored sample.
Free with trial Metal fireplace in flat style isolated on white background. Vector illustration of hearth. Template example vectors Design of the fireplace. Vector furnace or stove. Metal fireplace in flat style isolated on white background. Vector illustration of hearth. Metal fireplace in flat style isolated on white background. Vector illustration of hearth.
Free with trial Vector image. Developing children skills for counting and multiplication. Scale to any size without loss of resolution. Template example vectors Educational page for children with multiplication table. Vector image. Developing children skills for counting and multiplication. Scale to any size without. Vector image. Developing children skills for counting and multiplication. Scale to any size without loss of resolution.
Free with trial Vector image. Developing children skills for counting and multiplication. Scale to any size without loss of resolution. Template example vectors Educational page for children with multiplication table. Vector image. Developing children skills for counting and multiplication. Scale to any size without. Vector image. Developing children skills for counting and multiplication. Scale to any size without loss of resolution.
Free with trial Vector image. Scale to any size without loss of resolution. Template example vectors Page shows how to learn step by step to draw a dog. Developing children skills for drawing and coloring. Vector image. Scale to any size without loss of. Vector image. Scale to any size without loss of resolution.
Free with trial Sample print or web page. Infographics. Template example vectors Sample print or web page. Infographics
Free with trial Graph, chart. Infographic elements. Flat design. Simply minimalistic concept. Template example vectors Graph, chart. Infographic elements. Flat design. Simply minimalistic concept
Free with trial Vector cartoon image. Developing children skills for counting and writing. Template example vectors Page with exercises for young children on a square paper. Vector cartoon image. Developing children skills for counting and writing. Vector cartoon image. Developing children skills for counting and writing.
Free with trial Running girl silhouette. Bright watercolor running girl on a white background. Template example vectors Running girl silhouette. Bright watercolor running girl on a white background
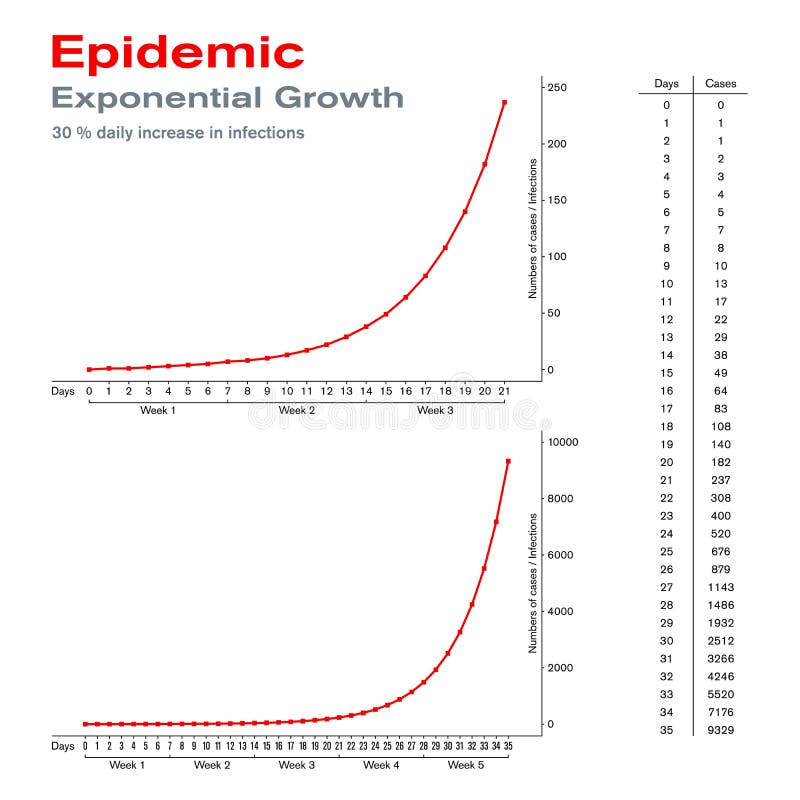
Free with trial Epidemic. Exponential growth. On the example of 30 percent daily increase in infections. Rapid spread and epidemic outbreak of a disease makes it clear how important early countermeasures are. Vector. Template example vectors Epidemic. Exponential growth with 30 percent daily increase in infections. Epidemic. Exponential growth. On the example of 30 percent daily increase in. Epidemic. Exponential growth. On the example of 30 percent daily increase in infections. Rapid spread and epidemic outbreak of a disease makes it clear how important early countermeasures are. Vector.
Free with trial Multiplication table by 8 for kids. Math education. Coloring book. Paint the illustration corresponding to numbers. Logic puzzle game. Printable worksheet for children textbook. Back to school. Template example vectors Multiplication table by 8 for kids. Math education. Coloring book. Paint the illustration corresponding to numbers. Logic puzzle game. Printable worksheet for
Free with trial Vector cartoon image. Scale to any size without loss of resolution. Template example vectors Educational page for young children. Need to find the numbers hidden in the picture and paint them. Logic puzzle game. Vector cartoon image. Scale to any size. Vector cartoon image. Scale to any size without loss of resolution.
Free with trial Image of clown. Cut and glue. Educational game for children. Template example vectors Image of clown. Cut and glue. Educational game for children. Image of clown. Cut and glue. Educational game for children
Free with trial Vector image. Developing children skills for counting. Scale to any size without loss of resolution. Template example vectors Exercises for children - need to help animals to find the correct wagon of train. Connect them by line. Vector image. Developing children skills for counting. Vector image. Developing children skills for counting. Scale to any size without loss of resolution.
Free with trial Background medical company. With silver frames. Template example vectors Background medical company. With silver frames
Free with trial Fireplace in flat style on white background. Vector illustration. Template example vectors Vector illustration Fireplace. Fireplace in flat style on white background. Vector illustration. Fireplace in flat style on white background. Vector illustration.
Free with trial Vector cartoon image. Scale to any size without loss of resolution. Template example vectors Colorful and black and white pattern for coloring. Illustration of cute zebra. Worksheet for children and adults. Vector cartoon image. Scale to any size. Vector cartoon image. Scale to any size without loss of resolution.
Free with trial Vector cartoon image. Developing children skills for counting and writing. Template example vectors Educational page for children with exercises on subtraction. Vector cartoon image. Developing children skills for counting and writing. Vector cartoon image. Developing children skills for counting and writing.
Free with trial 3d, 5 step infographic diagram made of abstract, colorful circles joined by lines in a semi circle with editable, transparent drop shadows on a subtle gradient background made in illustrator. Template example vectors Vector Abstract 3d Circles Linked Number 1 to 5 Infographic. 3d, 5 step infographic diagram made of abstract, colorful circles joined by lines in a semi circle. 3d, 5 step infographic diagram made of abstract, colorful circles joined by lines in a semi circle with editable, transparent drop shadows on a subtle gradient background made in illustrator
Free with trial Vector cartoon image. Scale to any size without loss of resolution. Template example vectors Logic puzzle game for study English. Find the correct places. Vector cartoon image. Scale to any size without loss of resolution. Vector cartoon image. Scale to any size without loss of resolution.
Free with trial Graphic collection of different clouds on a white background. Vector illustration of a graphic collection of different clouds on a white background. Template example vectors Graphic collection of different clouds on a white background. Vector illustration of a graphic collection of different clouds on a white background
Free with trial Vector cartoon image. Scale to any size without loss of resolution. Template example vectors Colorful and black and white pattern for coloring. Illustration of cute kitten. Worksheet for children and adults. Vector cartoon image. Scale to any size. Vector cartoon image. Scale to any size without loss of resolution.
Free with trial Kid’s game. Create the image of face of happy clown using scissors and glue. Template example vectors Create the image of face of happy clown using scissors and glue. Kid’s game. Create the image of face of happy clown using scissors and glue. Kid’s game. Create the image of face of happy clown using scissors and glue.
Free with trial Vector image. Developing children skills for counting and writing. Scale to any size without loss of resolution. Template example vectors Educational page for children on a square paper with numbers. Vector image. Developing children skills for counting and writing. Scale to any size without loss. Vector image. Developing children skills for counting and writing. Scale to any size without loss of resolution.
Free with trial Vector cartoon image. Scale to any size without loss of resolution. Template example vectors Colorful and black and white pattern for coloring. Illustration of two cute foxes. Vector cartoon image. Scale to any size without loss of resolution. Vector cartoon image. Scale to any size without loss of resolution.
Free with trial Create the image of face of amazed clown using scissors and glue. Paper game for children. Vector illustration. Template example vectors Create the image of face of amazed clown using scissors and glue. Paper game for children. Vector illustration
Free with trial Color, cut, glue the image of face dog. Educational game for chi. Ldren. Template example vectors Color, cut, glue the image of face dog. Educational game for chi. Ldren
Free with trial 3d, 4 step infographic diagram made of abstract, colorful circles joined vertically by lines in a zig zag with editable, transparent drop shadows on a subtle gradient background made in illustrator. Template example vectors Vector Abstract 3d Number 1 to 4 Step Infographic Page Layout. 3d, 4 step infographic diagram made of abstract, colorful circles joined vertically by lines in a. 3d, 4 step infographic diagram made of abstract, colorful circles joined vertically by lines in a zig zag with editable, transparent drop shadows on a subtle gradient background made in illustrator
Free with trial Vector cartoon image. Scale to any size without loss of resolution. Template example vectors Logic puzzle game for study English or French. Need to find the correct places for the letters and write them. Vector cartoon image. Scale to any size without. Vector cartoon image. Scale to any size without loss of resolution.
Free with trial Flat chart, graph. Simply color editable. Infographics elements. Template example vectors Flat chart, graph. Simply color editable. Infographics elements
Free with trial Flat chart, graph. Simply color editable. Infographics elements. Template example vectors Flat chart, graph. Simply color editable. Infographics elements
Free with trial Vector image. Developing children skills for drawing and writing. Scale to any size without loss of resolution. Template example vectors Educational page with exercises for children on a square paper. Vector image. Developing children skills for drawing and writing. Scale to any size without loss. Vector image. Developing children skills for drawing and writing. Scale to any size without loss of resolution.
Free with trial Vector image. Developing children skills for drawing and writing. Scale to any size without loss of resolution. Template example vectors Educational page with exercises for children on a square paper. Vector image. Developing children skills for drawing and writing. Scale to any size without loss. Vector image. Developing children skills for drawing and writing. Scale to any size without loss of resolution.
Free with trial Vector image. Developing children skills for drawing and writing. Scale to any size without loss of resolution. Template example vectors Educational page with exercises for children on a square paper. Vector image. Developing children skills for drawing and writing. Scale to any size without loss. Vector image. Developing children skills for drawing and writing. Scale to any size without loss of resolution.
Free with trial Vector image. Developing children skills for drawing and writing. Scale to any size without loss of resolution. Template example vectors Educational page with exercises for children on a square paper. Vector image. Developing children skills for drawing and writing. Scale to any size without loss. Vector image. Developing children skills for drawing and writing. Scale to any size without loss of resolution.
Free with trial Vector image. Developing children skills for drawing and writing. Scale to any size without loss of resolution. Template example vectors Educational page with exercises for children on a square paper. Vector image. Developing children skills for drawing and writing. Scale to any size without loss. Vector image. Developing children skills for drawing and writing. Scale to any size without loss of resolution.
Free with trial Vector image. Developing children skills for drawing and writing. Scale to any size without loss of resolution. Template example vectors Educational page with exercises for children on a square paper. Vector image. Developing children skills for drawing and writing. Scale to any size without loss. Vector image. Developing children skills for drawing and writing. Scale to any size without loss of resolution.
Free with trial Vector image. Developing children skills for drawing and writing. Scale to any size without loss of resolution. Template example vectors Educational page with exercises for children on a square paper. Vector image. Developing children skills for drawing and writing. Scale to any size without loss. Vector image. Developing children skills for drawing and writing. Scale to any size without loss of resolution.
Free with trial Vector image. Developing children skills for drawing and writing. Scale to any size without loss of resolution. Template example vectors Educational page with exercises for children on a square paper. Vector image. Developing children skills for drawing and writing. Scale to any size without loss. Vector image. Developing children skills for drawing and writing. Scale to any size without loss of resolution.
Free with trial Vector image. Developing children skills for drawing and writing. Scale to any size without loss of resolution. Template example vectors Educational page with exercises for children on a square paper. Vector image. Developing children skills for drawing and writing. Scale to any size without loss. Vector image. Developing children skills for drawing and writing. Scale to any size without loss of resolution.
Free with trial Vector cartoon image. Developing children skills for counting and writing. Template example vectors Exercises for children - needs to paint image in relevant colors. Vector cartoon image. Developing children skills for counting and writing. Vector cartoon image. Developing children skills for counting and writing.
Free with trial Vector image. Developing children skills for drawing and writing. Scale to any size without loss of resolution. Template example vectors Educational page with exercises for children on a square paper. Vector image. Developing children skills for drawing and writing. Scale to any size without loss. Vector image. Developing children skills for drawing and writing. Scale to any size without loss of resolution.
Free with trial Vector image. Developing children skills for drawing and writing. Scale to any size without loss of resolution. Template example vectors Educational page with exercises for children on a square paper. Vector image. Developing children skills for drawing and writing. Scale to any size without loss. Vector image. Developing children skills for drawing and writing. Scale to any size without loss of resolution.
Free with trial Vector image. Developing children skills for drawing and writing. Scale to any size without loss of resolution. Template example vectors Educational page with exercises for children on a square paper. Vector image. Developing children skills for drawing and writing. Scale to any size without loss. Vector image. Developing children skills for drawing and writing. Scale to any size without loss of resolution.
Free with trial Vector cartoon image. Scale to any size without loss of resolution. Template example vectors Page shows how to learn step by step to draw a water mill. Developing children skills for drawing and coloring. Vector cartoon image. Scale to any size without. Vector cartoon image. Scale to any size without loss of resolution.
Free with trial Set of colorful, square backgrounds in old retro, vintage style and pastel colors. Template example vectors Colorful, square backgrounds in old style. Set of colorful, square backgrounds in old retro, vintage style and pastel colors. Set of colorful, square backgrounds in old retro, vintage style and pastel colors.
Free with trial Vector image. Developing children skills for drawing and coloring. Scale to any size without loss of resolution. Template example vectors Multiplication table by 3 for kids. Find places for falling numbers and write them. Educational page for math book. Logic puzzle. Vector image. Developing. Vector image. Developing children skills for drawing and coloring. Scale to any size without loss of resolution.
Free with trial Vector image. Developing children skills for drawing and coloring. Scale to any size without loss of resolution. Template example vectors Multiplication table by 5 for kids. Find places for falling numbers and write them. Educational page for math book. Logic puzzle. Vector image. Developing. Vector image. Developing children skills for drawing and coloring. Scale to any size without loss of resolution.
Free with trial Vector image. Developing children skills for drawing and coloring. Scale to any size without loss of resolution. Template example vectors Multiplication table by 2 for kids. Find places for falling numbers and write them. Educational page for math book. Logic puzzle. Vector image. Developing. Vector image. Developing children skills for drawing and coloring. Scale to any size without loss of resolution.
Free with trial Vector cartoon image. Scale to any size without loss of resolution. Template example vectors Logic puzzle game for study English. Find the correct places for the letters and write them in relevant circles. Vector cartoon image. Scale to any size without. Vector cartoon image. Scale to any size without loss of resolution.
Free with trial Vector cartoon image. Scale any size without loss resolution. Template example vectors Logic puzzle game for study English. Find the correct places for the letters and write them in relevant circles. Vector cartoon image. Scale any size without. Vector cartoon image. Scale any size without loss resolution.
Free with trial Vector image. Developing children skills for drawing and coloring. Template example vectors Page with black and white illustration of starfish for coloring. Vector image. Developing children skills for drawing and coloring. Vector image. Developing children skills for drawing and coloring.
Free with trial Vector image. Developing children skills for drawing and coloring. Scale to any size without loss of resolution. Template example vectors Multiplication table by 10 for kids. Find places for falling numbers and write them. Educational page for math book. Logic puzzle. Vector image. Developing. Vector image. Developing children skills for drawing and coloring. Scale to any size without loss of resolution.
Free with trial Abstract background with spectrum wheels. Bright rainbow template design with place for your text. Template example vectors Abstract background with spectrum wheels. Bright rainbow template design with place for your text
Free with trial Create the image of face of girl clown using scissors and glue. Paper game for children. Vector illustration. Template example vectors Create the image of face of girl clown using scissors and glue. Paper game for children. Vector illustration.
Free with trial Whiskey bottle set mockup. Mockup set of whiskey bottle. Transparent glass. Example bottle for cognac and brandy and whickey beverages. Vector Illustration. Template example vectors Whiskey bottle set mockup. Mockup set of whiskey bottle. Transparent glass. Example bottle for cognac and brandy and whickey beverages. Vector Illustration
Free with trial Blank Rx form. For medical treatment prescription and drugs list. Template example vectors Blank Rx form. For medical treatment prescription and drugs list
Free with trial Info graphics set elements of smart phone communication. Template example vectors Info graphics set elements. Info graphics set elements of smart phone communication. Info graphics set elements of smart phone communication.
Free with trial Vector cartoon image. Scale to any size without loss of resolution. Template example vectors Page shows how to learn step by step to draw a smiling hippo. Developing children skills for drawing and coloring. Vector cartoon image. Scale to any size. Vector cartoon image. Scale to any size without loss of resolution.
Free with trial Hand drawn cutting board mockup with usage examples. Vector illustration with old textured plank used as mockup for label, logo, card, poster, advertising bar or pizzeria menu. Template example vectors Hand drawn cutting board mockup with usage examples. Vector illustration with old textured plank used as mockup for label, logo, card, poster, advertising bar
Free with trial Simple of Modern timeline business careers infographic of process with seven steps and full color gradient. Infographics a clipped compound of `information` and `graphics` are graphic visual representations of information, data, or knowledge intended to present information quickly and clearly. They can improve cognition by utilizing graphics to enhance the human visual system`s ability to see patterns and trends. Similar pursuits are information visualization, data visualization, statistical graphics, information design, or information architecture. Infographics have evolved in recent years to be for mass communication, and thus are designed with fewer assumptions about the readers` knowledge base than other types of visualizations. Isotypes are an early example of infographics conveying information quickly and easily to the masses. Template example vectors Modern timeline business careers infographic of process with seven steps and full color gradient. Simple of Modern timeline business careers infographic of. Simple of Modern timeline business careers infographic of process with seven steps and full color gradient. Infographics a clipped compound of `information` and `graphics` are graphic visual representations of information, data, or knowledge intended to present information quickly and clearly. They can improve cognition by utilizing graphics to enhance the human visual system`s ability to see patterns and trends. Similar pursuits are information visualization, data visualization, statistical graphics, information design, or information architecture. Infographics have evolved in recent years to be for mass communication, and thus are designed with fewer assumptions about the readers` knowledge base than other types of visualizations. Isotypes are an early example of infographics conveying information quickly and easily to the masses
Free with trial Vector image. Scale to any size without loss of resolution. Template example vectors Educational page for young children. Need to find the hidden letters of English alphabet and paint them in relevant colors. Vector image. Scale to any size. Vector image. Scale to any size without loss of resolution.
Free with trial Vector cartoon image. Scale to any size without loss of resolution. Template example vectors Colorful and black and white pattern for coloring. Illustration of cute little giraffe. Worksheet for children and adults. Vector cartoon image. Scale to any. Vector cartoon image. Scale to any size without loss of resolution.
Free with trial Vector cartoon image. Scale to any size without loss of resolution. Template example vectors Logic exercise for children. Need to count the quantity of dishes and write the numbers in corresponding circles. Vector cartoon image. Scale to any size. Vector cartoon image. Scale to any size without loss of resolution.
Free with trial Lettering Boom, bomb. Comic text sound effects. Vector bubble icon speech phrase, cartoon exclusive font label tag expression, sounds illustration. Template example vectors Lettering Boom, bomb. Comic text sound effects. Vector bubble icon speech phrase, cartoon exclusive font label tag expression, sounds illustration
Free with trial Funny cool app store game icon. On white background, game logo element,vector illustration. Template example vectors Funny cool app store game icon. On white background, game logo element,vector illustration
Free with trial Vector cartoon image. Scale to any size without loss of resolution. Template example vectors Worksheet with exercises for children with multiplication by four. Need to solve examples and paint the octopus in relevant colors. Vector cartoon image. Scale. Vector cartoon image. Scale to any size without loss of resolution.
Free with trial Vector image. Developing children skills for drawing and writing. Scale to any size without loss of resolution. Template example vectors Educational page with exercises for children on a square paper. Vector image. Developing children skills for drawing and writing. Scale to any size without loss. Vector image. Developing children skills for drawing and writing. Scale to any size without loss of resolution.
Free with trial Vector cartoon image. Scale to any size without loss of resolution. Template example vectors Colorful and black and white pattern for coloring. Illustration of fantasy fairyland dragon. Vector cartoon image. Scale to any size without loss of resolution. Vector cartoon image. Scale to any size without loss of resolution.
Free with trial Create the image of branch of fruit using scissors and glue. Educational game for children. Template example vectors Create the image of branch of fruit using scissors and glue. Educational game for children. Create the image of branch of fruit using scissors and glue
Free with trial Stripes style background. This is stripes styled background. Template example vectors Stripes style background. This is stripes styled background
Free with trial Vector cartoon image. Scale to any size without loss of resolution. Template example vectors Colorful and black and white pattern for coloring. Illustration of cute crab. Vector cartoon image. Scale to any size without loss of resolution. Vector cartoon image. Scale to any size without loss of resolution.
Free with trial Image of cupcake with cherry. Cut and glue. Educational game for children. Template example vectors Image of cupcake with cherry. Cut and glue. Educational game for children. Image of cupcake with cherry. Cut and glue. Educational game for children
Free with trial Vector image. Developing children skills for drawing and coloring. Scale to any size without loss of resolution. Template example vectors Multiplication table by 10 for kids. Write the numbers in correct circles. Educational page for mathematics baby book. Vector image. Developing children skills. Vector image. Developing children skills for drawing and coloring. Scale to any size without loss of resolution.
Free with trial Vector cartoon image. Scale to any size without loss of resolution. Template example vectors Colorful and black and white pattern for coloring. Illustration of cute hippo. Vector cartoon image. Scale to any size without loss of resolution. Vector cartoon image. Scale to any size without loss of resolution.
Free with trial Color, cut and glue to create the image of strawberry berry. Educational game for children. Template example vectors Color, cut and glue to create the image of strawberry berry. Educational game for children. Color, cut and glue to create the image of strawberry berry
 Sign in