Free with trial Algebra. Hand written scribble illustration - mathematical equations. Polynomials with variables (indeterminates. Variables vectors Algebra. Hand written scribble illustration - mathematical equations. Polynomials with variables (indeterminates
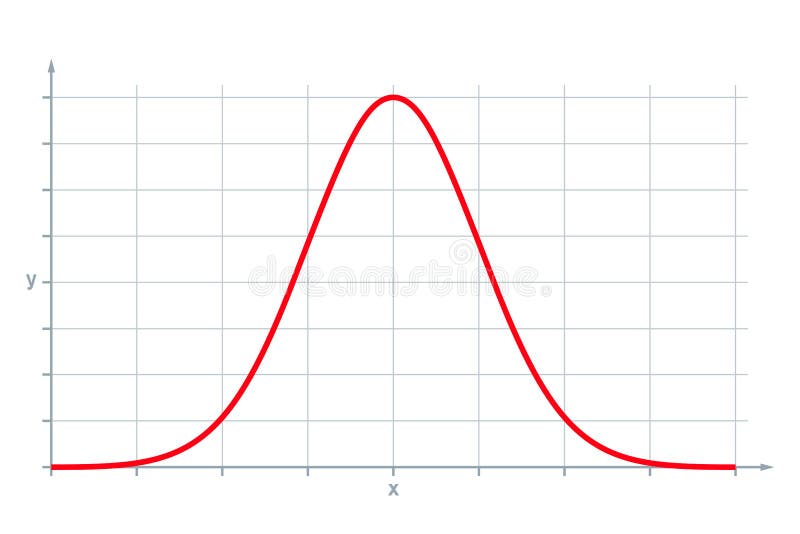
Free with trial Standard normal distribution, also Gaussian distribution or bell curve. Used in statistics and in natural and social sciences to represent real-valued random variables of unknown distributions. Vector. Variables vectors Standard normal distribution, also Gaussian distribution or bell curve. Used in statistics and in natural and social sciences to represent real-valued random
Free with trial Smartphone with two color variables. Variables vectors Realistic mobile phone isolated vector eps10. Smartphone with two color variables. Smartphone with two color variables.
Free with trial Human Design BodyGraph chart. Nine colored energy centers, planets, variables. Hand drawn vector graphic. Variables vectors Human Design BodyGraph chart. Nine colored energy centers, planets, variables. Hand drawn vector graphic.
Free with trial Human Design BodyGraph chart. Nine colored energy centers, planets, variables. Hand drawn vector graphic. Variables vectors Human Design BodyGraph chart. Nine colored energy centers, planets, variables. Hand drawn vector graphic.
Free with trial Vector walking dogs logo design. In five variables. Variables vectors Vector walking dogs logo design. In five variables
Free with trial Math. Hand written scribble illustration - mathematical equations. Polynomials with variables (indeterminates. Variables vectors Math. Hand written scribble illustration - mathematical equations. Polynomials with variables (indeterminates
Free with trial The Two Variables of Acceleration Infographic Diagram with example showing more mass result in less acceleration and more force result in more acceleration and speed physics science education vector. Variables vectors The Two Variables of Acceleration Infographic Diagram. With example showing more mass result in less acceleration and more force result in more acceleration and. The Two Variables of Acceleration Infographic Diagram with example showing more mass result in less acceleration and more force result in more acceleration and speed physics science education vector
Free with trial Geek illustration. A vector illustration of a geeky kid with math symbols in the background. Variables vectors Geek illustration. A vector illustration of a geeky kid with math symbols in the background
Free with trial Mathematics. Hand written doodle illustration - Trigonometric functions. Mathematics scientific education. Variables vectors Mathematics. Hand written doodle illustration - Trigonometric functions. Mathematics scientific education
Free with trial Increase. Illustration 3d in four colors. Variables vectors Increase. Illustration 3d in four colors
Free with trial 10 icon variables, shirt and tie illustration, vector. 10 icon variables, shirt and tie illustration, circle, button, vector. Variables vectors 10 icon variables, shirt and tie illustration, vector. 10 icon variables, shirt and tie illustration, circle, button, vector
Free with trial 7 color variables of shirt and tie illustration, vector. Variables vectors 7 color variables of shirt and tie illustration. Vector
Free with trial A set of measuring instruments used in construction to measure distances and other variables. Vector illustration. Variables vectors A set of measuring instruments used in construction to measure distances and other variables. Vector illustration
Free with trial Experiment outline icons collection. Research, Hypothesis, Variables, Control, Data, Analysis, Procedure vector and. Variables vectors Experiment line icons collection. Research, Hypothesis, Variables, Control, Data, Analysis, Procedure vector and linear. Experiment outline icons collection. Experiment outline icons collection. Research, Hypothesis, Variables, Control, Data, Analysis, Procedure vector and
Free with trial Correlation and results consistency with statistics data tiny person concept. Information research based on information surveillance and variables analysis vector illustration. Graphic presentation. Variables vectors Correlation and results consistency with statistics data tiny person concept. Information research based on information surveillance and variables analysis
Free with trial Programming variables white text illustration with green constellation map as background. Vector. Variables vectors Programming variables white text illustration with green constellation map as background. Vector
Free with trial Human Design BodyGraph chart. Nine colored energy centers, planets, variables. Mandala. Hand drawn vector graphic. Variables vectors Human Design BodyGraph chart. Nine colored energy centers, planets, variables. Mandala. Hand drawn vector graphic.
Free with trial Human Design BodyGraph chart. Nine colored energy centers planets, variables. Inner authority. Five types generator, manifestor, manifesting generator, projector, reflector. Mandala. Vector graphic. Variables vectors Human Design BodyGraph chart. Nine colored energy centers planets, variables. Inner authority. Five types generator. Manifestor, manifesting generator. Human Design BodyGraph chart. Nine colored energy centers planets, variables. Inner authority. Five types generator, manifestor, manifesting generator, projector, reflector. Mandala. Vector graphic.
Free with trial Homeostasis is the state of steady internal, physical, and chemical conditions maintained by living systems. This is the condition of optimal functioning for the organism and includes many variables, such as body temperature and fluid balance, being kept within certain pre-set limit. Variables vectors Biology homeostasis science vector illustration infographic. Homeostasis is the state of steady internal, physical, and chemical conditions maintained by living. homeostasis is the state of steady internal, physical, and chemical conditions maintained by living systems. This is the condition of optimal functioning for the organism and includes many variables, such as body temperature and fluid balance, being kept within certain pre-set limit
Free with trial Human Design BodyGraph chart. Nine colored energy centers, planets, variables. Mandala. Hand drawn vector graphic. Variables vectors Human Design BodyGraph chart. Nine colored energy centers, planets, variables. Mandala. Hand drawn vector graphic.
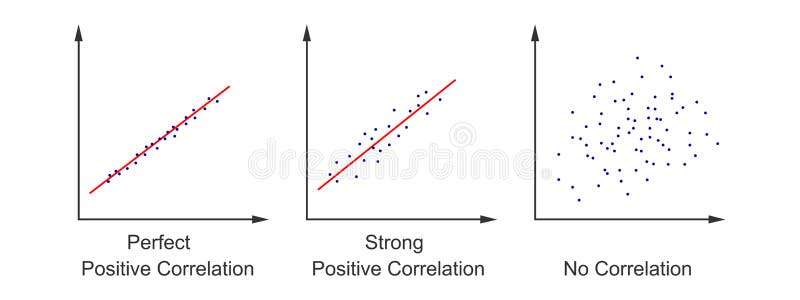
Free with trial Set of scatter plot diagrams. Scattergrams with different types of variables correlation. Data points plotted on a horizontal and a vertical axis on Cartesian plane. Vector flat illustration. Variables vectors Set of scatter plot diagrams. Scattergrams with different types of variables correlation. Data points plotted on a. Horizontal and a vertical axis on Cartesian. Set of scatter plot diagrams. Scattergrams with different types of variables correlation. Data points plotted on a horizontal and a vertical axis on Cartesian plane. Vector flat illustration
Free with trial Longitudinal study is a research design that involves repeated observations of the same variables over short or long periods of ti. Me vector. Variables vectors Longitudinal study is a research design that involves repeated observations of the same variables over short or long periods of ti. Me vector
Free with trial Vector EPS 10 rose diagram infographics. Four different variables, split 12 and 8 and 6 and 4. Variables vectors Rose diagram builder infographics. Vector EPS 10 rose diagram infographics. Four different variables, split 12 and 8 and 6 and 4. Vector EPS 10 rose diagram infographics. Four different variables, split 12 and 8 and 6 and 4.
Free with trial Marketing environment icon collection set. Advertisement strategy vector illustration with competitors, suppliers, intermediaries, partners, customers and political symbols. Variables vectors Marketing environment icon collection set. Ad strategy vector illustration. Marketing environment icon collection set. Advertisement strategy vector. Marketing environment icon collection set. Advertisement strategy vector illustration with competitors, suppliers, intermediaries, partners, customers and political symbols.
Free with trial Isolated smartphones. Isolated smartphone with three display variables vector eps10. Variables vectors Isolated smartphones. Isolated smartphone with three display variables vector eps10
Free with trial Algebra Concept Retro Colorful Word Art Illustration. The word ALGEBRA concept written in colorful retro shapes and colors illustration. Variables vectors Algebra Concept Retro Colorful Word Art Illustration. The word ALGEBRA concept written in colorful retro shapes and colors illustration
Free with trial Banner 4P marketing mix model - price, product, promotion and place - The marketing mix is the set of controllable elements or variables that a company uses to influence and meet the needs of its target customers in the most effective and efficient way possible. These variables are often grouped into four key components, often referred to as the Four Ps of Marketing. Variables vectors Marketing Mix - 4P marketing mix model - thin line two-tone icon concept vector illustration. Banner 4P marketing mix model - price, product, promotion and place. Banner 4P marketing mix model - price, product, promotion and place - The marketing mix is the set of controllable elements or variables that a company uses to influence and meet the needs of its target customers in the most effective and efficient way possible. These variables are often grouped into four key components, often referred to as the Four Ps of Marketing
Free with trial Maths lesson. Hand written doodle illustration - Trigonometric functions. Mathematics scientific education. Variables vectors Maths lesson. Hand written doodle illustration - Trigonometric functions. Mathematics scientific education
Free with trial Cubes in 3d filling in. For conceptual expression. Variables vectors Cubes in 3d filling in. For conceptual expression
Free with trial Correlation vs causation connection and differences analysis outline diagram. Labeled educational explanation scheme with weather example for cause relationship in statistics vector illustration. Variables vectors Correlation vs causation connection and differences analysis outline diagram. Labeled educational explanation scheme with weather example for cause
Free with trial Analysis vector illustration of magnifying glass. On a green background with round chart diagram under it. Variables vectors Analysis vector illustration of magnifying glass. On a green background with round chart diagram under it
Free with trial Trigonometry. Hand written doodle illustration - Trigonometric functions. Mathematics scientific education. Variables vectors Trigonometry. Hand written doodle illustration - Trigonometric functions. Mathematics scientific education
Free with trial Randomized control group and experimental group in experimentation vector. Variables vectors Randomized control group and experimental group in experimentation vector. Randomized control group and experimental group in experimentation
Free with trial Different between randomized control group and experimental group in experimentation vector. Different between randomized control group and experimental group in. Variables vectors Different between randomized control group and experimental group in experimentation vector. Different between randomized control group and experimental group in
Free with trial Social media highlight covers set. Stories pastel modern backgrounds with hands in different gestures and minimal variables linear Icons. Vector illustration for bloggers, cosmetologists, stylists. Variables vectors Social media highlight covers set. Storys background line Icons. Social media highlight covers set. Stories pastel modern backgrounds with hands in different. Social media highlight covers set. Stories pastel modern backgrounds with hands in different gestures and minimal variables linear Icons. Vector illustration for bloggers, cosmetologists, stylists.
Free with trial Different between randomized control group and experimental group in experimentation vector. Different between randomized control group and experimental group in. Variables vectors Different between randomized control group and experimental group in experimentation vector. Different between randomized control group and experimental group in
Free with trial Independent variable with control variable to see dependent variable of the experiment. Vector. Variables vectors Independent variable with control variable to see dependent variable of the experiment. Vector
Free with trial Randomized control group and experimental group in experimentation vector. Variables vectors Randomized control group and experimental group in experimentation vector. Randomized control group and experimental group in experimentation
Free with trial A B Testing concept. Expert analyzing two website versions, making data-driven decisions. Exploring user engagement metrics, optimizing for best performance. Digital strategy evaluation. Flat vector. Variables vectors A B Testing concept. Flat vector illustration. A B Testing concept. Expert analyzing two website versions, making data-driven decisions. Exploring user. A B Testing concept. Expert analyzing two website versions, making data-driven decisions. Exploring user engagement metrics, optimizing for best performance. Digital strategy evaluation. Flat vector
Free with trial Quantitative data compare to Quantitative data of measurement. Vector. Variables vectors Quantitative data compare to Quantitative data of measurement. Vector
Free with trial Machine Icons Set. Collection Of Variable Architecture, Algorithm Illustration, Mechanism Parts And Other Elements. Also. Collection Of. Variables vectors Machine Icons Set. Collection Of Variable Architecture, Algorithm Illustration, Mechanism Parts And Other Elements. Also. Machine Icons Set. Collection Of
Free with trial Causation blue gradient concept icon. Effect reasons. Causal research variables and principles abstract idea thin line illustration. Isolated outline drawing. Myriad Pro-Bold font used. Variables vectors Causation blue gradient concept icon. Effect reasons. Causal research variables and principles abstract idea thin line illustration. Isolated outline drawing
Free with trial Network vector line icons set. Network, Connectivity, LAN, WAN, System, Infrastructure, WiFi illustration outline. Concept signs and symbols. Variables vectors Network vector line icons set. Network, Connectivity, LAN, WAN, System, Infrastructure, WiFi illustration outline. Concept signs and symbols
Free with trial Independent variable with control variable to see dependent variable of the experiment. Vector. Variables vectors Independent variable with control variable to see dependent variable of the experiment. Vector
Free with trial Customer data and analytics vector line icons set. customer, data, analytics, insights, profiling, segmentation, retention illustration outline concept signs and symbols. Variables vectors Customer data and analytics vector line icons set. customer, data, analytics, insights, profiling, segmentation. Retention illustration outline concept signs
Free with trial Customer data and analytics vector line icons set. customer, data, analytics, insights, profiling, segmentation, retention illustration outline concept signs and symbols. Variables vectors Customer data and analytics vector line icons set. customer, data, analytics, insights, profiling, segmentation. Retention illustration outline concept signs
Free with trial Machine Icons Set. Collection Of Analysis Diagram, Variable Architecture, Information Components And Other Elements. Variables vectors Machine Icons Set. Collection Of Analysis Diagram, Variable Architecture, Information Components And Other Elements.
Free with trial Key testing variables infographic 5 steps. Online sales and digital storefronts. Structuring sales funnels. Infochart template. Editable vector info graphics with icons. Data visualization. Variables vectors Key testing variables infographic 5 steps. Online sales and digital storefronts. Structuring sales funnels. Infochart template. Editable vector info graphics
Free with trial A clear educational science diagram defining independent, dependent, and controlled variables using a plant growth experiment context. Illustrating the independent variable (sunlight exposure as the factor changed), dependent variable (plant height as the factor measured), and controlled variables (constant plant species, soil type, and water amount). Essential for biology textbooks, experimental design lessons, and scientific methodology guides. Variables vectors Types of Variables in Scientific Experiment Diagram. A clear educational science diagram defining independent, dependent, and controlled variables using a plant. A clear educational science diagram defining independent, dependent, and controlled variables using a plant growth experiment context. Illustrating the independent variable (sunlight exposure as the factor changed), dependent variable (plant height as the factor measured), and controlled variables (constant plant species, soil type, and water amount). Essential for biology textbooks, experimental design lessons, and scientific methodology guides.
Free with trial The image features an abstract mathematical expression with various variables and symbols. It includes Greek letters such as alpha, beta, and gamma, as well as arithmetic symbols like addition and subtraction. The layout is scattered with different mathematical notations, suggesting a complex or advanced equation or formula. Variables vectors Abstract mathematical expression with variables and symbols. The image features an abstract mathematical expression with various variables and symbols. It. The image features an abstract mathematical expression with various variables and symbols. It includes Greek letters such as alpha, beta, and gamma, as well as arithmetic symbols like addition and subtraction. The layout is scattered with different mathematical notations, suggesting a complex or advanced equation or formula
Free with trial This image depicts a logical truth table involving two variables, labeled 'r' and 'r-bar' (not-r). The table is organized into four quadrants, each representing a combination of the variables in both row and column headers. Each quadrant contains a pair of eyes, with the top-left and bottom-right quadrants showing crossed-out eyes, indicating an unsatisfied or negated condition, while the top-. Variables vectors Diagram showing truth table for logical operations involving two variables r and r-bar. This image depicts a logical truth table involving two variables, labeled. This image depicts a logical truth table involving two variables, labeled 'r' and 'r-bar' (not-r). The table is organized into four quadrants, each representing a combination of the variables in both row and column headers. Each quadrant contains a pair of eyes, with the top-left and bottom-right quadrants showing crossed-out eyes, indicating an unsatisfied or negated condition, while the top-
Free with trial This minimalist illustration visualizes the critical environment variables and connections necessary for My Application to interact successfully with its core dependencies database deployment server and cloud object storage. Variables vectors Application Environment Variables Flowchart Connecting Database Host Server Credentials and Cloud Storage Bucket Keys in Software. This minimalist illustration. This minimalist illustration visualizes the critical environment variables and connections necessary for My Application to interact successfully with its core dependencies database deployment server and cloud object storage
Free with trial A clean simplified technical diagram illustrating the various configuration parameters required for a central application including database host user credentials API keys storage bucket region and environment variables. Variables vectors Application Configuration Diagram Database Credentials API Keys and Environment Variables Concept Illustration. A clean simplified technical diagram illustrating. A clean simplified technical diagram illustrating the various configuration parameters required for a central application including database host user credentials API keys storage bucket region and environment variables
Free with trial A conceptual graphic design featuring a large, grey, rounded cross symbol representing the variable X, positioned next to a yellow square containing the lowercase letter y. This minimalist composition uses bold, flat shapes to represent mathematical variables, algebraic concepts, or coordinate systems. The clean, modern aesthetic is suitable for educational materials, scientific presentations, or abstract design projects focusing on mathematics, logic, and analytical problem-solving. Variables vectors Mathematical X and Y Variables Represented by Geometric Shapes and Letters. A conceptual graphic design featuring a large, grey, rounded cross symbol. A conceptual graphic design featuring a large, grey, rounded cross symbol representing the variable X, positioned next to a yellow square containing the lowercase letter y. This minimalist composition uses bold, flat shapes to represent mathematical variables, algebraic concepts, or coordinate systems. The clean, modern aesthetic is suitable for educational materials, scientific presentations, or abstract design projects focusing on mathematics, logic, and analytical problem-solving.
Free with trial Flat style 2D illustration A clean minimalist line art diagram illustrating a cloud based application environment setup detailing essential configuration variables like API key database URL bucket name and environment mode connecting to backend servers. Variables vectors Cloud Application Architecture Diagram Showing Environment Variables and Server Connection Flat style 2D illustration. Flat style 2D illustration A clean. Flat style 2D illustration A clean minimalist line art diagram illustrating a cloud based application environment setup detailing essential configuration variables like API key database URL bucket name and environment mode connecting to backend servers
Free with trial Computer Screen Displaying Equation. Illustration of a computer monitor showing a mathematical equation with variables and a square root symbol, representing data analysis or calculation. Variables vectors Equation with variables and a square root symbol, representing data analysis or calculation. Generative AI. Computer Screen Displaying Equation.Illustration of. Computer Screen Displaying Equation.Illustration of a computer monitor showing a mathematical equation with variables and a square root symbol, representing data analysis or calculation.
Free with trial This image was created using Generative AI. A scatter plot graph displaying a positive correlation between variables with a regression line on a white background for data analysis and visualization purposes in statistics and business. Variables vectors Scatter plot graph with regression line showing positive correlation between variables on white background. This image was created using Generative AI. A scatter. This image was created using Generative AI. A scatter plot graph displaying a positive correlation between variables with a regression line on a white background for data analysis and visualization purposes in statistics and business
Free with trial The depicts a triangular nomogram, a graphical calculating tool used primarily for solving mathematical problems involving three variables. This specific nomogram is designed in the shape of a rightangled triangle with scales along its edges. The left edge is marked with a logarithmic scale ranging from 1 to 30+, while the bottom edge is marked with a linear scale ranging from 0 to 57. The. Variables vectors The geometric construction of a triangular nomogram illustrating the relationships between variables in a trigonometric or. The depicts a triangular nomogram, a. The depicts a triangular nomogram, a graphical calculating tool used primarily for solving mathematical problems involving three variables. This specific nomogram is designed in the shape of a rightangled triangle with scales along its edges. The left edge is marked with a logarithmic scale ranging from 1 to 30+, while the bottom edge is marked with a linear scale ranging from 0 to 57. The
Free with trial With a determined look on his face a young boy carefully adjusts variables in his code his solution to the coding puzzle slowly taking shape.. Vector illustration. Variables vectors With a determined look on his face a young boy carefully adjusts variables in his code his solution to the coding puzzle. Slowly taking shape.. Vector
Free with trial Causal research variables blue gradient onboarding mobile app screen. Walkthrough 5 steps graphic instructions with linear concepts. UI, UX, GUI template. Myriad Pro-Bold, Regular fonts used. Variables vectors Causal research variables blue gradient onboarding mobile app screen. Walkthrough 5 steps graphic instructions with linear concepts. UI, UX, GUI template
Free with trial Flat style 2D illustration A visual diagram illustrates cloud environment variables showing key value pairs for API keys database URLs port numbers Node js environment settings and S3 bucket names essential for application configuration and deployment in cloud infrastructure. Variables vectors Cloud Environment Variables Diagram API Keys Database URL Port Node Env S3 Bucket Name for Software Development DevOps Flat style. Flat style 2D illustration A. Flat style 2D illustration A visual diagram illustrates cloud environment variables showing key value pairs for API keys database URLs port numbers Node js environment settings and S3 bucket names essential for application configuration and deployment in cloud infrastructure
Free with trial Color trendy posters gradient design set. Abstract geometric multicolored background mockups with fluid variables shapes, digital pattern. Layout for modern flyer, futuristic banner, poster or cover. Variables vectors Color trendy posters gradient design set. Abstract geometric multicolored background mockups with fluid variables shapes, digital. Pattern. Layout for modern. Color trendy posters gradient design set. Abstract geometric multicolored background mockups with fluid variables shapes, digital pattern. Layout for modern flyer, futuristic banner, poster or cover
Free with trial A man in a suit reads his phone in surprise. Sudden variables affecting business. An analyst tries to build a plan. Pop Art Retro Vector Illustration Kitsch Vintage 50s 60s Style. On a white background. Variables vectors Pop Art Retro A man in a suit reads his phone in surprise. Sudden variables affecting business. An analyst tries to. A man in a suit reads his phone in surprise. A man in a suit reads his phone in surprise. Sudden variables affecting business. An analyst tries to build a plan. Pop Art Retro Vector Illustration Kitsch Vintage 50s 60s Style. On a white background
Free with trial Color trendy gradient design set. Abstract geometric multicolored background mockups with fluid variables shapes, digital pattern. Layout for modern flyer, futuristic banner, poster or cover. Variables vectors Color trendy gradient design set. Abstract geometric multicolored background mockups with fluid variables shapes, digital pattern. Layout for modern flyer
Free with trial Color trendy gradient design set. Abstract geometric multicolored background mockups with fluid variables shapes, digital pattern. Layout for modern flyer, futuristic banner, poster or cover - vector. Variables vectors Color trendy gradient design set. Abstract geometric multicolored background mockups with fluid variables shapes, digital pattern. Layout for modern flyer
Free with trial A man in a suit reads his phone in surprise. Sudden variables affecting business. An analyst tries to build a plan. Pop Art Retro Vector Illustration Kitsch Vintage 50s 60s Style. Variables vectors Pop Art Retro A man in a suit reads his phone in surprise. Sudden variables affecting business. An analyst tries to. A man in a suit reads his phone in surprise. A man in a suit reads his phone in surprise. Sudden variables affecting business. An analyst tries to build a plan. Pop Art Retro Vector Illustration Kitsch Vintage 50s 60s Style
Free with trial Algebra system equation set for linear methods determinants matrices substitution graphical solutions variables coefficients rank theorem conditions formulas calculations representation. Variables vectors Algebra system equation set. For linear methods determinants matrices substitution graphical solutions variables coefficients rank theorem conditions formulas. Algebra system equation set for linear methods determinants matrices substitution graphical solutions variables coefficients rank theorem conditions formulas calculations representation
Free with trial A clean educational research methodology diagram comparing qualitative and quantitative research approaches. Highlighting differences in data types, collection methods, and analytical goals: qualitative focus on experiences, words, interviews, and thematic analysis versus quantitative focus on measurable variables, statistical data, experiments, and numerical measurements. Perfect for academic research guides, university courseware, and educational infographics. Variables vectors Qualitative and Quantitative Research Methodology Comparison Diagram. A clean educational research methodology diagram comparing qualitative and quantitative. A clean educational research methodology diagram comparing qualitative and quantitative research approaches. Highlighting differences in data types, collection methods, and analytical goals: qualitative focus on experiences, words, interviews, and thematic analysis versus quantitative focus on measurable variables, statistical data, experiments, and numerical measurements. Perfect for academic research guides, university courseware, and educational infographics.
Free with trial A detailed physics diagram illustrating the bouncing ball trajectory and successive rebound height decay due to mechanical energy loss. Featuring the mathematical equation hn h0 x r^n with defined variables for initial drop height, coefficient of restitution, and bounce count. Variables vectors Bouncing Ball Successive Rebound Heights Restitution Physics Diagram. A detailed physics diagram illustrating the bouncing ball trajectory and successive rebound. A detailed physics diagram illustrating the bouncing ball trajectory and successive rebound height decay due to mechanical energy loss. Featuring the mathematical equation hn h0 x r^n with defined variables for initial drop height, coefficient of restitution, and bounce count.
Free with trial Investor. Emphasizes the need to analyze complex data and make critical decisions amidst uncertain variables. Variables vectors Investor. Emphasizes the need to analyze complex data and make critical decisions amidst uncertain variables.
Free with trial Investor. Emphasizes the need to analyze complex data and make critical decisions amidst uncertain variables. Variables vectors Investor. Emphasizes the need to analyze complex data and make critical decisions amidst uncertain variables.
Free with trial Investor. Emphasizes the need to analyze complex data and make critical decisions amidst uncertain variables. Variables vectors Investor. Emphasizes the need to analyze complex data and make critical decisions amidst uncertain variables.
Free with trial Investor. Emphasizes the need to analyze complex data and make critical decisions amidst uncertain variables. Variables vectors Investor. Emphasizes the need to analyze complex data and make critical decisions amidst uncertain variables.
Free with trial Investor. Emphasizes the need to analyze complex data and make critical decisions amidst uncertain variables. Variables vectors Investor. Emphasizes the need to analyze complex data and make critical decisions amidst uncertain variables.
Free with trial This graphic features a complex algebraic equation rendered in a modern, flat design style with soft drop shadows. The composition includes fractions, square roots and variables arranged horizontally to represent a scientific formula. The color palette utilizes muted blue and warm orange tones against a stark white backdrop, creating a clean and professional aesthetic suitable for educational or. Variables vectors A complex mathematical equation displayed on a clean white background. This graphic features a complex algebraic equation rendered in a modern, flat design style. This graphic features a complex algebraic equation rendered in a modern, flat design style with soft drop shadows. The composition includes fractions, square roots and variables arranged horizontally to represent a scientific formula. The color palette utilizes muted blue and warm orange tones against a stark white backdrop, creating a clean and professional aesthetic suitable for educational or
Free with trial This image displays a complex mathematical formula written in a combination of black and green ink against a clean, isolated white background. The composition features various symbols including summation, square roots and algebraic variables arranged in a linear sequence. The visual style is minimalist and academic, focusing on the clarity of the handwritten characters. The contrast between the. Variables vectors A mathematical equation written in black and green ink on a plain white background. This image displays a complex mathematical formula written in a combination. This image displays a complex mathematical formula written in a combination of black and green ink against a clean, isolated white background. The composition features various symbols including summation, square roots and algebraic variables arranged in a linear sequence. The visual style is minimalist and academic, focusing on the clarity of the handwritten characters. The contrast between the
Free with trial This image features a dynamic arrangement of various mathematical formulas, algebraic expressions and geometric shapes scattered across a clean white background. The composition utilizes a vibrant color palette of blue, green and yellow to highlight different variables, exponents and operators. The visual mood is academic and analytical, representing the complexity of scientific study and logical. Variables vectors A collection of colorful mathematical equations and geometric symbols on white background. This image features a dynamic arrangement of various mathematical. This image features a dynamic arrangement of various mathematical formulas, algebraic expressions and geometric shapes scattered across a clean white background. The composition utilizes a vibrant color palette of blue, green and yellow to highlight different variables, exponents and operators. The visual mood is academic and analytical, representing the complexity of scientific study and logical
Free with trial A dynamic infographic showcasing a multi-line trend graph with distinct data points, ideal for comparing multiple variables over time. This versatile graphic is perfect for business analytics, scientific research, or financial forecasting. It effectively visualizes complex relationships and patterns, suitable for insightful and professional presentations, vector design Generative AI. Variables vectors Multi-Line Trend Graph with Data Points, vector design Generative AI. A dynamic infographic showcasing a multi-line trend graph with distinct data points, ideal. A dynamic infographic showcasing a multi-line trend graph with distinct data points, ideal for comparing multiple variables over time. This versatile graphic is perfect for business analytics, scientific research, or financial forecasting. It effectively visualizes complex relationships and patterns, suitable for insightful and professional presentations, vector design Generative AI
Free with trial The man with dry skin on face illustration. Caused by heat, sunshine, stress and environmental variables, lead to dryness, dehydration, itching, irritation and cracking of skin. Men skin care concept. Variables vectors The man with dry skin on face vector illustration isolated on white background. The man with dry skin on face illustration. Caused by heat, sunshine, stress and. The man with dry skin on face illustration. Caused by heat, sunshine, stress and environmental variables, lead to dryness, dehydration, itching, irritation and cracking of skin. Men skin care concept.
 Sign in