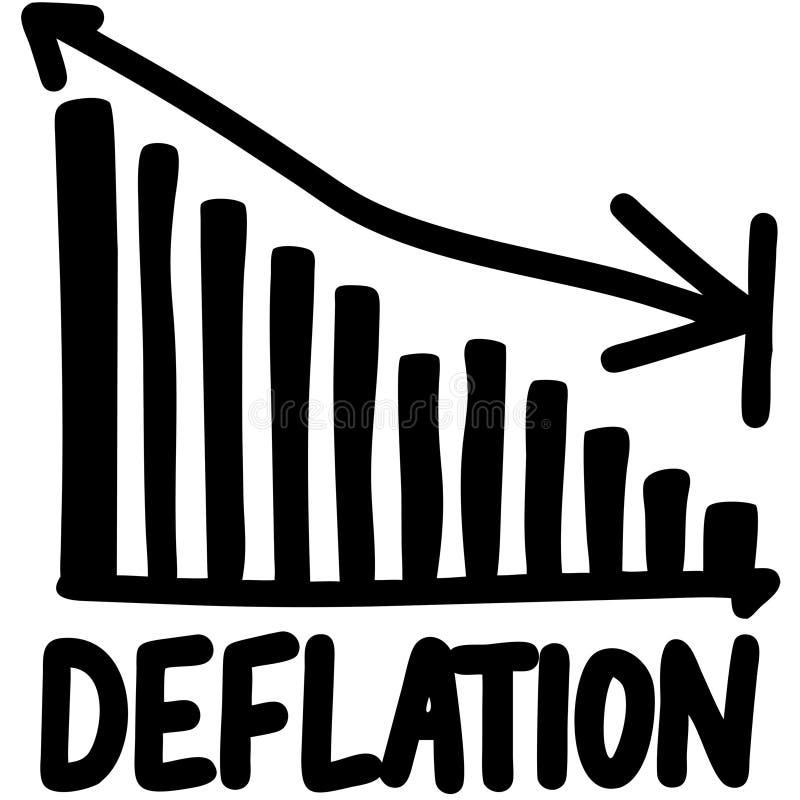
Free with trial This AI-generated illustration depicts the concept of deflation in economics, represented by a downward graph arrow. The monochrome design uses simple graphics to visualize the financial decline, symbolizing a negative trend in the economy. This representation effectively conveys the essence of deflation as a significant economic phenomenon. Visualize vectors Deflation Concept Vector Illustration with Downward Graph Arrow. This AI-generated illustration depicts the concept of deflation in economics, represented by a. This AI-generated illustration depicts the concept of deflation in economics, represented by a downward graph arrow. The monochrome design uses simple graphics to visualize the financial decline, symbolizing a negative trend in the economy. This representation effectively conveys the essence of deflation as a significant economic phenomenon.
Free with trial Man using virtual reality to visualize home design. Illustration of a young man with vr headset touching a 3d model of a house. Visualize vectors Man using virtual reality to visualize home design. Illustration of a young man with vr headset touching a 3d model of a house
Free with trial A detailed technical flat sketch of a unisex track jacket featuring a high collar and front zipper closure. The displays both front and back views, rendered in a clean black and white line art style suitable for apparel design, fashion production, and manufacturing specifications. This vector-style drawing provides a professional template for clothing designers to visualize garment construction, paneling, and overall silhouette for sportswear or casual athletic wear collections. Visualize vectors Technical flat sketch of a zip up track jacket with front and back views for fashion design and apparel manufacturing. A detailed technical flat sketch of a. A detailed technical flat sketch of a unisex track jacket featuring a high collar and front zipper closure. The displays both front and back views, rendered in a clean black and white line art style suitable for apparel design, fashion production, and manufacturing specifications. This vector-style drawing provides a professional template for clothing designers to visualize garment construction, paneling, and overall silhouette for sportswear or casual athletic wear collections.
Free with trial Flat illustration showing a house with two piggy banks in front, stacks of coins, and a rising bar chart with a dollar symbol. Clean minimalist style and warm pastel colors visualize home savings, budgeting, and investment growth. Image created using AI. Visualize vectors Home savings and investment concept illustration with house, piggy banks, coins and growth chart, personal finance theme. Flat illustration showing a house with. Flat illustration showing a house with two piggy banks in front, stacks of coins, and a rising bar chart with a dollar symbol. Clean minimalist style and warm pastel colors visualize home savings, budgeting, and investment growth. Image created using AI.
Free with trial VR Real Estate House logo design offers a modern identity for companies focused on immersive property viewing, and this VR Real Estate House logo helps clients visualize spaces. As a forward-thinking VR Real Estate House logo, this asset effectively bridges architecture with technology. Every VR Real Estate House logo creates a sophisticated, professional impact for agencies adopting cutting-edge solutions for future home sales. Visualize vectors VR Real Estate House Logo Innovative Property Virtual Reality Showcase Branding Concept For Realty Firms. VR Real Estate House logo design offers a modern. VR Real Estate House logo design offers a modern identity for companies focused on immersive property viewing, and this VR Real Estate House logo helps clients visualize spaces. As a forward-thinking VR Real Estate House logo, this asset effectively bridges architecture with technology. Every VR Real Estate House logo creates a sophisticated, professional impact for agencies adopting cutting-edge solutions for future home sales.
Free with trial Idea Generation Strategy and Brainstorming. Acts and integrates to visualize the process. Visualizing analyzing tables, charts and graphs. Set flat vector modern illustration. Visualize vectors Inspiration and Analysis of Results. Visualizing the Process of Ideas. Evaluating Success. Idea Generation Strategy and Brainstorming. Acts and integrates to. Idea Generation Strategy and Brainstorming. Acts and integrates to visualize the process. Visualizing analyzing tables, charts and graphs. Set flat vector modern illustration
Free with trial Visualize financial growth with this vibrant 3D render. A money coin blooms like a flower in a purple pot, symbolizing investment and profit. This creative digital art piece, featuring a dollar sign currency on a white background, represents wealth management and financial success. Its transparency makes it ideal for business, finance, and design projects related to savings. Visualize vectors 3d rendered illustration of a money coin growing like a flower in a purple flower pot symbolizing financial growth. Visualize financial growth with this vibrant. Visualize financial growth with this vibrant 3D render. A money coin blooms like a flower in a purple pot, symbolizing investment and profit. This creative digital art piece, featuring a dollar sign currency on a white background, represents wealth management and financial success. Its transparency makes it ideal for business, finance, and design projects related to savings
Free with trial Magnifying glass with clear optics, transparent backgroun. Visualize vectors Magnifying glass with clear optics, transparent backgroun. Magnifying glass with crystal-clear optics, transparent background
Free with trial Illustration of a person drawing clouds in a notebook. Uses a flat, cartoon style with a clean composition and simple color palette. Visualize vectors Illustration of a creative person drawing clouds with a pencil on a white background. Illustration of a person drawing clouds in a notebook. Uses a flat. Illustration of a person drawing clouds in a notebook. Uses a flat, cartoon style with a clean composition and simple color palette.
Free with trial Visualize a modern smart home with this charming house icon emitting a wifi signal. Ideal for illustrating internet connection, wireless technology, and remote access concepts. Perfect for smart home. Visualize vectors Modern smart home concept represented by a cute house icon with wifi signal above. Visualize a modern smart home with this charming house icon emitting a wifi. Visualize a modern smart home with this charming house icon emitting a wifi signal. Ideal for illustrating internet connection, wireless technology, and remote access concepts. Perfect for smart home.
Free with trial This Image shows a hand pressing down on a tension spring as a flat icon for mechanical force and compression testing concepts The compressed coils visualize applied pressure Great for physics education graphics engineering presentations strength testing industrial safety materials and mechanical aptitude training. Visualize vectors Hand Pressing Down on a Tension Spring Icon for Mechanical Force Concepts Compression Testing and Engineering Themes. This AI Generated Image shows a hand. This Image shows a hand pressing down on a tension spring as a flat icon for mechanical force and compression testing concepts The compressed coils visualize applied pressure Great for physics education graphics engineering presentations strength testing industrial safety materials and mechanical aptitude training
Free with trial This Image shows a hand pressing down on a tension spring as a flat icon for mechanical force and compression testing concepts The compressed coils visualize applied pressure Great for physics education graphics engineering presentations strength testing industrial safety materials and mechanical aptitude training. Visualize vectors Hand Pressing Down on a Tension Spring Icon for Mechanical Force Concepts Compression Testing and Engineering Themes. This AI Generated Image shows a hand. This Image shows a hand pressing down on a tension spring as a flat icon for mechanical force and compression testing concepts The compressed coils visualize applied pressure Great for physics education graphics engineering presentations strength testing industrial safety materials and mechanical aptitude training
Free with trial Computer displaying a mind map for brainstorming new ideas. Mind map displayed on a computer screen, showing connections between different concepts. Visualize vectors Computer displaying a mind map for brainstorming new ideas. Mind map displayed on a computer screen, showing connections between different concepts
Free with trial A modern triangle geometric decorative element, offering a clean and artistic design with sharp angles and structure. Visualize vectors Abstract Geometric Triangle Decor Element Design Concept. A modern triangle geometric decorative element, offering a clean and artistic design with sharp angles. A modern triangle geometric decorative element, offering a clean and artistic design with sharp angles and structure.
Free with trial Chinese New Year Illustration Collection is designed to make your project more astonishing. mmerse yourself in the vibrant traditions of this auspicious celebration and bring your stories to life with these captivating illustrations. Now you can visualize your story using this illustration pack!. Visualize vectors Chineese New Year Flat Illustration. Chinese New Year Illustration Collection is designed to make your project more astonishing. mmerse yourself in the vibrant. Chinese New Year Illustration Collection is designed to make your project more astonishing. mmerse yourself in the vibrant traditions of this auspicious celebration and bring your stories to life with these captivating illustrations. Now you can visualize your story using this illustration pack!
Free with trial Geometric illustration features cyan nodes connected by dark blue lines. Flat graphic style. Represents a network, data connection, and modern technology concept. Visualize vectors Modern Geometric Network Illustration with Cyan Nodes and Dark Blue Lines on Black Background. Geometric illustration features cyan nodes connected by dark blue. Geometric illustration features cyan nodes connected by dark blue lines. Flat graphic style. Represents a network, data connection, and modern technology concept.
Free with trial Infographic template displaying a process with five steps, icons, and text descriptions. Ideal for business, education, and presentations to visualize workflows and concepts. Visualize vectors Infographic template displaying a process with five steps, icons, and text descriptions. Ideal for business, education, and. Presentations to visualize. Infographic template displaying a process with five steps, icons, and text descriptions. Ideal for business, education, and presentations to visualize workflows and concepts.
Free with trial Vibrant Cartoon Explosion Vector Illustration for Creative Projects. This image is generated using AI tool. Visualize vectors Vibrant Cartoon Explosion Vector Illustration for Creative Projects. This image is generated using AI tool
Free with trial Complex lines form abstract shapes, creating an engaging visual effect reminiscent of topography in this dark purple design. Visualize vectors Intricate topographic patterns create a mesmerizing design on a dark purple background. Complex lines form abstract shapes, creating an engaging visual effect. Complex lines form abstract shapes, creating an engaging visual effect reminiscent of topography in this dark purple design.
Free with trial Pie Chart. Visualize data clearly with this pie chart icon for easy analysis. Visualize vectors Pie Chart. Visualize data clearly with this pie chart icon for easy analysis
Free with trial Discover the cuttingedge technology of FutureTech UltraRealistic 8K Rendering of Futuristic Digital Network Grid This innovative system revolutionizes the way we visualize and interact with digital networks offering an unparalleled level of realism and detail Witness the seamless integration of advanced algorithms artificial intelligence and highresolution rendering to create a mesmerizing 8K. Visualize vectors FutureTech: Ultra-Realistic 8K Rendering of Futuristic Digital Network Grid. Discover the cuttingedge technology of FutureTech UltraRealistic 8K Rendering of. Discover the cuttingedge technology of FutureTech UltraRealistic 8K Rendering of Futuristic Digital Network Grid This innovative system revolutionizes the way we visualize and interact with digital networks offering an unparalleled level of realism and detail Witness the seamless integration of advanced algorithms artificial intelligence and highresolution rendering to create a mesmerizing 8K
Free with trial This image presents a collection of stylized flat vector icons representing healthcare management concepts, featuring a hospital bed inside a pink square, a medical building with a heart symbol inside a tan square, a rising trend line graph, and a colorful monthly calendar, all arranged on a solid light beige background to visualize data-driven hospital capacity planning, patient intake scheduling, and clinical resource optimization in a clean, professional, and modern graphic design aesthetic. Visualize vectors Medical facility occupancy tracking icons with medical building heart symbol inside tan square modern graphic design aesthetic. This image presents a collection. This image presents a collection of stylized flat vector icons representing healthcare management concepts, featuring a hospital bed inside a pink square, a medical building with a heart symbol inside a tan square, a rising trend line graph, and a colorful monthly calendar, all arranged on a solid light beige background to visualize data-driven hospital capacity planning, patient intake scheduling, and clinical resource optimization in a clean, professional, and modern graphic design aesthetic
Free with trial Sound waves amplitude colored illustration, depicting the visual representation of sound waves, often used in audio or music-related contexts. Visualize vectors Vibrant Sound Waves Amplitude Illustration Vector Art. Sound waves amplitude colored illustration, depicting the visual representation of sound waves, often used. Sound waves amplitude colored illustration, depicting the visual representation of sound waves, often used in audio or music-related contexts.
Free with trial Sound waves amplitude colored illustration, depicting the visual representation of sound waves, often used in audio or music-related contexts. Visualize vectors Vibrant Sound Waves Amplitude Illustration Vector Art. Sound waves amplitude colored illustration, depicting the visual representation of sound waves, often used. Sound waves amplitude colored illustration, depicting the visual representation of sound waves, often used in audio or music-related contexts.
Free with trial Sound waves amplitude colored illustration, depicting the visual representation of sound waves, often used in audio or music-related contexts. Visualize vectors Vibrant Sound Waves Amplitude Illustration Vector Art. Sound waves amplitude colored illustration, depicting the visual representation of sound waves, often used. Sound waves amplitude colored illustration, depicting the visual representation of sound waves, often used in audio or music-related contexts.
Free with trial This illustration depicts a rustic stone fire pit arranged in a circular formation, perfect for outdoor camping and picnic settings. The hand-drawn style gives it a warm and cozy feel, ideal for gatherings in nature. The detailed sketch showcases the rocks forming the fire pit, inviting you to visualize evening bonfires and leisure time in the backyard or a camping site. Created with AI, this artwork captures the essence of traditional outdoor experiences. Visualize vectors Rustic Stone Fire Pit Illustration for Outdoor Camping and Picnic Themes. This illustration depicts a rustic stone fire pit arranged in a circular formation. This illustration depicts a rustic stone fire pit arranged in a circular formation, perfect for outdoor camping and picnic settings. The hand-drawn style gives it a warm and cozy feel, ideal for gatherings in nature. The detailed sketch showcases the rocks forming the fire pit, inviting you to visualize evening bonfires and leisure time in the backyard or a camping site. Created with AI, this artwork captures the essence of traditional outdoor experiences.
Free with trial A person with VR headset is immersed in digital world. Cityscape is highlighted, combined with data representation in a modern, flat style. Visualize vectors Virtual reality experience within an urban environment featuring financial analysis and futuristic building design. A person with VR headset is immersed in. A person with VR headset is immersed in digital world. Cityscape is highlighted, combined with data representation in a modern, flat style.
Free with trial An Instagram post mockup is a visual representation that allows brands and designers to showcase their content in a realistic setting, helping to visualize how it will appear on the platform. These mockups can enhance marketing presentations, social media strategies, and client proposals by providing a polished and professional look. Visualize vectors An Instagram post mockup is a visual representation that allows brands and designers. To showcase their content in a realistic setting, helping to visualize how. An Instagram post mockup is a visual representation that allows brands and designers to showcase their content in a realistic setting, helping to visualize how it will appear on the platform. These mockups can enhance marketing presentations, social media strategies, and client proposals by providing a polished and professional look.
Free with trial Illustration of a professional person explaining a growth graph on a board during a meeting to visualize corporate financial success and business strategy development. Visualize vectors Professional man pointing at a business growth chart presentation during a team meeting for financial and corporate report. Illustration of a professional person. Illustration of a professional person explaining a growth graph on a board during a meeting to visualize corporate financial success and business strategy development
Free with trial A comprehensive library of blue office and business icons designed to visualize order history, tracking, and management administrative tasks. Visualize vectors Professional set of dark blue business and office icons illustrating various order history management tracking functions. A comprehensive library of blue office. A comprehensive library of blue office and business icons designed to visualize order history, tracking, and management administrative tasks
Free with trial Colorful stylized lightbulb icon symbolizing innovation and ideas. Great for creative projects and business presentations. Visualize vectors Creative Colorful Lightbulb Idea Icon with Stripes, Symbolizing Innovation and Solutions. Colorful stylized lightbulb icon symbolizing innovation and ideas. Colorful stylized lightbulb icon symbolizing innovation and ideas. Great for creative projects and business presentations.
Free with trial Clean line icon depicting cash register machine with dollar receipt. Designed for financial websites accounting platforms or retail apps to visualize payment processing and sales record management systems. Visualize vectors Accounting cash register icon showing dollar sign receipt printout useful for financial retail payment or banking systems. Clean line icon depicting cash. Clean line icon depicting cash register machine with dollar receipt. Designed for financial websites accounting platforms or retail apps to visualize payment processing and sales record management systems
Free with trial Blue artistic presentation board icon illustrating drawing development and mountains within a circle design. AI generated. Visualize vectors Blue artistic presentation board icon illustrating drawing development and mountains within a circle design. AI generated
Free with trial Man using virtual reality for urban planning. Illustration of a smiling man using a vr headset to visualize city architecture. Visualize vectors Man using virtual reality for urban planning. Illustration of a smiling man using a vr headset to visualize city architecture
Free with trial Effective Storytelling through Visual Communication for Brand Promotion. This image is generated using AI tool. Visualize vectors Effective Storytelling through Visual Communication for Brand Promotion. This image is generated using AI tool
Free with trial Effective Storytelling through Visual Communication for Brand Promotion. This image is generated using AI tool. Visualize vectors Effective Storytelling through Visual Communication for Brand Promotion. This image is generated using AI tool
Free with trial Effective Storytelling through Visual Communication for Brand Promotion. This image is generated using AI tool. Visualize vectors Effective Storytelling through Visual Communication for Brand Promotion. This image is generated using AI tool
Free with trial Branches in double exposure, nature and growth symbol; an illustration of branches in double exposure, perfect for nature, growth, or eco-friendly themes. Visualize vectors Double Exposure of Lined Tree Branches for Creative Designs. Branches in double exposure, nature and growth symbol; an illustration of branches in double. Branches in double exposure, nature and growth symbol; an illustration of branches in double exposure, perfect for nature, growth, or eco-friendly themes.
Free with trial Branches in double exposure, nature and growth symbol; an illustration of branches in double exposure, perfect for nature, growth, or eco-friendly themes. Visualize vectors Double Exposure of Lined Tree Branches for Creative Designs. Branches in double exposure, nature and growth symbol; an illustration of branches in double. Branches in double exposure, nature and growth symbol; an illustration of branches in double exposure, perfect for nature, growth, or eco-friendly themes.
Free with trial Explore dynamic GDP growth through captivating vector art. Visualize economic trends in this illustration. Visualize vectors Print GDP Growth Illustrated: Vector Graphic. Explore dynamic GDP growth through captivating vector art. Visualize economic trends in this illustration. Explore dynamic GDP growth through captivating vector art. Visualize economic trends in this illustration.
Free with trial A high-quality technical flat sketch of an ice hockey jersey, showcasing both front and back views. This professional apparel template is designed for fashion designers, garment manufacturers, and sports team uniform creators to visualize colorways, logos, and branding elements. The clean line art is presented in a standard layout, perfect for tech packs, fashion industry production, and sports apparel development. The garment features traditional hockey jersey construction with long sleeves and a V-neck collar for a classic athletic appearance. Visualize vectors Professional ice hockey jersey technical flat sketch front and back view for apparel design and sports team uniform manufacturing. A high-quality technical flat. A high-quality technical flat sketch of an ice hockey jersey, showcasing both front and back views. This professional apparel template is designed for fashion designers, garment manufacturers, and sports team uniform creators to visualize colorways, logos, and branding elements. The clean line art is presented in a standard layout, perfect for tech packs, fashion industry production, and sports apparel development. The garment features traditional hockey jersey construction with long sleeves and a V-neck collar for a classic athletic appearance.
Free with trial This professional business process timeline infographic displays five distinct stages with colorful rounded square icons and text placeholders to visualize organizational workflows and strategic project management steps. Visualize vectors A colorful five step business process timeline infographic featuring icons and descriptive text boxes on a dark blue background. This professional business. This professional business process timeline infographic displays five distinct stages with colorful rounded square icons and text placeholders to visualize organizational workflows and strategic project management steps
Free with trial A vector illustration of brainstorming concepts, symbolizing creativity and idea generation in a modern context. Visualize vectors Creative Abstract Brainstorming Vector Concept Illustration. A vector illustration of brainstorming concepts, symbolizing creativity and idea generation in a. A vector illustration of brainstorming concepts, symbolizing creativity and idea generation in a modern context.
Free with trial A vector illustration of brainstorming concepts, symbolizing creativity and idea generation in a modern context. Visualize vectors Creative Abstract Brainstorming Vector Concept Illustration. A vector illustration of brainstorming concepts, symbolizing creativity and idea generation in a. A vector illustration of brainstorming concepts, symbolizing creativity and idea generation in a modern context.
Free with trial A vector illustration of brainstorming concepts, symbolizing creativity and idea generation in a modern context. Visualize vectors Creative Abstract Brainstorming Vector Concept Illustration. A vector illustration of brainstorming concepts, symbolizing creativity and idea generation in a. A vector illustration of brainstorming concepts, symbolizing creativity and idea generation in a modern context.
Free with trial A vector illustration of brainstorming concepts, symbolizing creativity and idea generation in a modern context. Visualize vectors Creative Abstract Brainstorming Vector Concept Illustration. A vector illustration of brainstorming concepts, symbolizing creativity and idea generation in a. A vector illustration of brainstorming concepts, symbolizing creativity and idea generation in a modern context.
Free with trial A vibrant cartoon character featuring an anthropomorphic, vintage-style camera body in orange and gray hues. This. Visualize vectors A joyous orange and gray photographic device mascot charmingly extends a thumbs-up signifying approval for fantastic visual. A vibrant cartoon character. A vibrant cartoon character featuring an anthropomorphic, vintage-style camera body in orange and gray hues. This.
Free with trial This image displays a minimalist flat vector illustration representing a sustainable construction project timeline set against a soft cream background featuring a continuous blue path that connects a yellow construction crane icon, a green leaf symbol, a colorful monthly calendar, and a geometric network node diagram to visualize the integration of eco-friendly practices with industrial development and scheduling in a modern professional business context using a clean. Visualize vectors Sustainable construction project roadmap featuring crane icon leaf calendar and network connection symbols for environmental. This image displays a minimalist. This image displays a minimalist flat vector illustration representing a sustainable construction project timeline set against a soft cream background featuring a continuous blue path that connects a yellow construction crane icon, a green leaf symbol, a colorful monthly calendar, and a geometric network node diagram to visualize the integration of eco-friendly practices with industrial development and scheduling in a modern professional business context using a clean
Free with trial Home search icon, house with magnifying glass, perfect for real estate, house hunting, or property search visuals. Visualize vectors Search Concept with Magnifying Glass Icon on House Symbol. Home search icon, house with magnifying glass, perfect for real estate, house hunting, or property. Home search icon, house with magnifying glass, perfect for real estate, house hunting, or property search visuals.
Free with trial Home search icon, house with magnifying glass, perfect for real estate, house hunting, or property search visuals. Visualize vectors Search Concept with Magnifying Glass Icon on House Symbol. Home search icon, house with magnifying glass, perfect for real estate, house hunting, or property. Home search icon, house with magnifying glass, perfect for real estate, house hunting, or property search visuals.
Free with trial Home search icon, house with magnifying glass, perfect for real estate, house hunting, or property search visuals. Visualize vectors Search Concept with Magnifying Glass Icon on House Symbol. Home search icon, house with magnifying glass, perfect for real estate, house hunting, or property. Home search icon, house with magnifying glass, perfect for real estate, house hunting, or property search visuals.
Free with trial Collection of vector storefront icons showcasing various commercial enterprises, stores, and amenities to visualize urban development and infrastructure concepts. Visualize vectors Set of vector storefront icons representing different commercial businesses, shops, and services for urban infrastructure concepts. Collection of vector. Collection of vector storefront icons showcasing various commercial enterprises, stores, and amenities to visualize urban development and infrastructure concepts
Free with trial Vibrant cyan 3D audio waveform on a dark navy background to visualize rhythmic beats and sound frequencies for professional studio branding or digital media content. Visualize vectors Cyan digital audio waveform with 3D effect on dark navy blue background for music app interface and podcast cover design. Vibrant cyan 3D audio waveform on a. vibrant cyan 3D audio waveform on a dark navy background to visualize rhythmic beats and sound frequencies for professional studio branding or digital media content
Free with trial This image displays a clean minimalist infographic layout illustrating a four-part industrial process flow featuring a blue factory building, a formal document with a star icon, a complex network node structure representing neural computing, and a stylized eye symbol within a digital scanning frame, all connected by bold lines against a light cream background to visualize the integration of artificial intelligence into manufacturing quality control and certification procedures for modern. Visualize vectors Industrial quality assurance process flow diagram featuring factory automation and artificial intelligence technology systems. This image displays a clean. This image displays a clean minimalist infographic layout illustrating a four-part industrial process flow featuring a blue factory building, a formal document with a star icon, a complex network node structure representing neural computing, and a stylized eye symbol within a digital scanning frame, all connected by bold lines against a light cream background to visualize the integration of artificial intelligence into manufacturing quality control and certification procedures for modern
Free with trial A set of outline icons related to graphs and data analysis, suitable for business and research projects. Visualize vectors Graphs and Data Analysis Outline Icons Set for Professionals. A set of outline icons related to graphs and data analysis, suitable for business and research. A set of outline icons related to graphs and data analysis, suitable for business and research projects.
Free with trial A set of outline icons related to graphs and data analysis, suitable for business and research projects. Visualize vectors Graphs and Data Analysis Outline Icons Set for Professionals. A set of outline icons related to graphs and data analysis, suitable for business and research. A set of outline icons related to graphs and data analysis, suitable for business and research projects.
Free with trial This professional infographic displays a stylized tree with three colored circles representing organizational development, featuring icons for strategy, innovation, and growth to visualize core business management processes. Visualize vectors A colorful infographic tree diagram illustrating organizational development concepts through three distinct circular sections. This professional infographic. This professional infographic displays a stylized tree with three colored circles representing organizational development, featuring icons for strategy, innovation, and growth to visualize core business management processes
Free with trial This vector graphic provides a comprehensive flowchart of the pinocytosis mechanism, designed with a white background for clarity. It illustrates the key steps of the pinocytotic process, including fluid uptake, vesicle formation, and intracellular transport. Ideal for educational purposes and research presentations, this detailed diagram helps visualize how cells internalize fluids and solutes from their environment. Suitable for use in academic and research contexts, it serves as an excellent resource for understanding and teaching the principles of pinocytosis and its significance in cellular biology. Visualize vectors Illustrative Flowchart of Pinocytosis Mechanism on White Background for Research and Teaching. This vector graphic provides a comprehensive flowchart of the. This vector graphic provides a comprehensive flowchart of the pinocytosis mechanism, designed with a white background for clarity. It illustrates the key steps of the pinocytotic process, including fluid uptake, vesicle formation, and intracellular transport. Ideal for educational purposes and research presentations, this detailed diagram helps visualize how cells internalize fluids and solutes from their environment. Suitable for use in academic and research contexts, it serves as an excellent resource for understanding and teaching the principles of pinocytosis and its significance in cellular biology.
Free with trial This image displays a stylized flat vector illustration of an artificial intelligence automation network featuring a central brain icon connected to various peripheral gear modules and cloud computing symbols representing complex data processing workflows, where interconnected circular nodes and directional arrows visualize the systematic flow of information and technological integration across a clean light blue background designed for corporate presentations. Visualize vectors Artificial intelligence network automation diagram illustrating workflow processes and digital connectivity integration systems. This image displays a stylized. This image displays a stylized flat vector illustration of an artificial intelligence automation network featuring a central brain icon connected to various peripheral gear modules and cloud computing symbols representing complex data processing workflows, where interconnected circular nodes and directional arrows visualize the systematic flow of information and technological integration across a clean light blue background designed for corporate presentations
Free with trial This professional infographic displays a five stage customer journey process using vibrant circular icons and numbered steps to effectively visualize marketing workflows for business and sales presentations. Visualize vectors A colorful five step customer journey infographic template featuring circular icons and text placeholders for business marketing. This professional infographic. This professional infographic displays a five stage customer journey process using vibrant circular icons and numbered steps to effectively visualize marketing workflows for business and sales presentations
Free with trial This clean business-themed line icon set features 16 black vector symbols representing key concepts like global strategy, data analysis, digital marketing, communication, growth, planning, teamwork, and innovation. Includes icons such as globe on board, magnifying glass, pie chart, bar graph, briefcase, laptop ID, envelope, rocket, and lightbulb. Ideal for business presentations, websites, mobile apps, infographics, UI UX projects, and startup branding. The minimal line style ensures versatility and clarity in both digital and print formats. Perfect for professionals, marketers, and designers looking to visualize corporate or entrepreneurial ideas effectively. Fully editable vector format. Visualize vectors Business Line Icons Set – Strategy, Global, Marketing, Data, Communication, Teamwork & Analysis Vector Symbols. This clean business-themed line icon set. This clean business-themed line icon set features 16 black vector symbols representing key concepts like global strategy, data analysis, digital marketing, communication, growth, planning, teamwork, and innovation. Includes icons such as globe on board, magnifying glass, pie chart, bar graph, briefcase, laptop ID, envelope, rocket, and lightbulb. Ideal for business presentations, websites, mobile apps, infographics, UI UX projects, and startup branding. The minimal line style ensures versatility and clarity in both digital and print formats. Perfect for professionals, marketers, and designers looking to visualize corporate or entrepreneurial ideas effectively. Fully editable vector format.
Free with trial This high tech digital manufacturing interface features glowing holographic data panels and complex industrial metrics designed to visualize modern automation processes within a dark sophisticated cybernetic environment. Visualize vectors A futuristic digital manufacturing dashboard displaying complex industrial data analytics through advanced holographic technology. This high tech digital. This high tech digital manufacturing interface features glowing holographic data panels and complex industrial metrics designed to visualize modern automation processes within a dark sophisticated cybernetic environment
Free with trial Red banner decorated with writing that is not trivial. This can be used as a graphic design. Visualize vectors Red banner decorated with writing that is not trivial. This can be used as a graphic design
Free with trial This image presents a conceptual flat vector illustration of a circular workflow connecting four distinct elements related to secure digital financial interactions, featuring a payment terminal, a fingerprint sensor icon, a processor chip, and a verified user profile card, all arranged around a central glowing star symbol on a minimalist light background to visualize the integration of advanced technology, authentication, and electronic commerce systems in a clean, professional. Visualize vectors Digital payment security and biometric identification process diagram for modern financial transactions concept with verification. This image presents a. This image presents a conceptual flat vector illustration of a circular workflow connecting four distinct elements related to secure digital financial interactions, featuring a payment terminal, a fingerprint sensor icon, a processor chip, and a verified user profile card, all arranged around a central glowing star symbol on a minimalist light background to visualize the integration of advanced technology, authentication, and electronic commerce systems in a clean, professional
Free with trial Visualize data with this vibrant red dot waveform, perfect for representing progress, trends, and dynamic fluctuations in business, tech, or science. Visualize vectors Dynamic heartbeat line formed by vibrant red dots transitions from black to bright red, symbolizing life and energy. Visualize data with this vibrant red dot. Visualize data with this vibrant red dot waveform, perfect for representing progress, trends, and dynamic fluctuations in business, tech, or science.
Free with trial Visualize data with this vibrant red dot waveform, perfect for representing progress, trends, and dynamic fluctuations in business, tech, or science. Visualize vectors Dynamic heartbeat line formed by vibrant red dots transitions from black to bright red, symbolizing life and energy. Visualize data with this vibrant red dot. Visualize data with this vibrant red dot waveform, perfect for representing progress, trends, and dynamic fluctuations in business, tech, or science.
Free with trial Visualize dynamic data with this sharp line graph, perfect for illustrating financial trends, market analysis, or scientific breakthroughs. Its bold design captivates attention and conveys crucial information instantly. Visualize vectors Dynamic abstract cardiogram pulse line represents health, data, and progress in a clean, modern style. Visualize dynamic data with this sharp line graph, perfect. Visualize dynamic data with this sharp line graph, perfect for illustrating financial trends, market analysis, or scientific breakthroughs. Its bold design captivates attention and conveys crucial information instantly.
Free with trial Visualize dynamic data with this sharp line graph, perfect for illustrating financial trends, market analysis, or scientific breakthroughs. Its bold design captivates attention and conveys crucial information instantly. Visualize vectors Dynamic abstract cardiogram pulse line represents health, data, and progress in a clean, modern style. Visualize dynamic data with this sharp line graph, perfect. Visualize dynamic data with this sharp line graph, perfect for illustrating financial trends, market analysis, or scientific breakthroughs. Its bold design captivates attention and conveys crucial information instantly.
Free with trial Visualize dynamic data with this sharp line graph, perfect for illustrating financial trends, market analysis, or scientific breakthroughs. Its bold design captivates attention and conveys crucial information instantly. Visualize vectors Dynamic abstract cardiogram pulse line represents health, data, and progress in a clean, modern style. Visualize dynamic data with this sharp line graph, perfect. Visualize dynamic data with this sharp line graph, perfect for illustrating financial trends, market analysis, or scientific breakthroughs. Its bold design captivates attention and conveys crucial information instantly.
Free with trial Visualize dynamic data with this sharp line graph, perfect for illustrating financial trends, market analysis, or scientific breakthroughs. Its bold design captivates attention and conveys crucial information instantly. Visualize vectors Dynamic abstract cardiogram pulse line represents health, data, and progress in a clean, modern style. Visualize dynamic data with this sharp line graph, perfect. Visualize dynamic data with this sharp line graph, perfect for illustrating financial trends, market analysis, or scientific breakthroughs. Its bold design captivates attention and conveys crucial information instantly.
Free with trial Visualize dynamic data with this sharp line graph, perfect for illustrating financial trends, market analysis, or scientific breakthroughs. Its bold design captivates attention and conveys crucial information instantly. Visualize vectors Dynamic abstract cardiogram pulse line represents health, data, and progress in a clean, modern style. Visualize dynamic data with this sharp line graph, perfect. Visualize dynamic data with this sharp line graph, perfect for illustrating financial trends, market analysis, or scientific breakthroughs. Its bold design captivates attention and conveys crucial information instantly.
Free with trial Visualize dynamic data with this sharp line graph, perfect for illustrating financial trends, market analysis, or scientific breakthroughs. Its bold design captivates attention and conveys crucial information instantly. Visualize vectors Dynamic abstract cardiogram pulse line represents health, data, and progress in a clean, modern style. Visualize dynamic data with this sharp line graph, perfect. Visualize dynamic data with this sharp line graph, perfect for illustrating financial trends, market analysis, or scientific breakthroughs. Its bold design captivates attention and conveys crucial information instantly.
Free with trial Camping Flat Illustration is designed to make your project more astonishing. mmerse yourself in the vibrant traditions of this auspicious celebration and bring your stories to life with these captivating illustrations. Now you can visualize your story using this illustration pack!. Visualize vectors Camping Illustration. Camping Flat Illustration is designed to make your project more astonishing. mmerse yourself in the vibrant traditions of this auspicious. Camping Flat Illustration is designed to make your project more astonishing. mmerse yourself in the vibrant traditions of this auspicious celebration and bring your stories to life with these captivating illustrations. Now you can visualize your story using this illustration pack!
Free with trial Technical drawing instruments, compass and ruler on blueprint geometric precision, drafting, education, engineering concept. Visualize vectors Technical drawing instruments, compass and ruler on blueprint geometric precision, drafting, education, engineering concept, AI. Technical drawing instruments. Technical drawing instruments, compass and ruler on blueprint geometric precision, drafting, education, engineering concept.
Free with trial Visualize your organization with this dynamic organizational chart vector. Interconnected people illustrate a hierarchy and teamwork concept, representing management, leadership, and seamless communication. Visualize vectors Organizational chart with interconnected people representing a hierarchy and teamwork concept. Visualize your organization with this dynamic organizational chart. Visualize your organization with this dynamic organizational chart vector. Interconnected people illustrate a hierarchy and teamwork concept, representing management, leadership, and seamless communication
Free with trial Isometric illustration of a boy building a house model using a tablet, visualizing the future of construction. Visualize vectors Boy Building House Model, Isometric Illustration, Construction, Real Estate, Design, Future Concept. Isometric illustration of a boy building a house model using. Isometric illustration of a boy building a house model using a tablet, visualizing the future of construction.
Free with trial A creative concept illustration showing a person having a bright idea, symbolized by a glowing brain or light bulb. Visualize vectors Illustration of a person having a bright idea, symbolized by a glowing light bulb. A creative concept illustration showing a person having a bright idea. A creative concept illustration showing a person having a bright idea, symbolized by a glowing brain or light bulb.
Free with trial A creative concept illustration showing a person having a bright idea, symbolized by a glowing brain or light bulb. Visualize vectors Illustration of a person having a bright idea, symbolized by a glowing light bulb. A creative concept illustration showing a person having a bright idea. A creative concept illustration showing a person having a bright idea, symbolized by a glowing brain or light bulb.
Free with trial A creative concept illustration showing a person having a bright idea, symbolized by a glowing brain or light bulb. Visualize vectors Illustration of a person having a bright idea, symbolized by a glowing light bulb. A creative concept illustration showing a person having a bright idea. A creative concept illustration showing a person having a bright idea, symbolized by a glowing brain or light bulb.
Free with trial A creative concept illustration showing a person having a bright idea, symbolized by a glowing brain or light bulb. Visualize vectors Illustration of a person having a bright idea, symbolized by a glowing light bulb. A creative concept illustration showing a person having a bright idea. A creative concept illustration showing a person having a bright idea, symbolized by a glowing brain or light bulb.
 Sign in