Free with trial A vibrant bar graph illustrates a market downturn, symbolizing economic trends, financial instability, risk assessment, and potential recovery. It uses a rainbow color scheme for visual impact. Ideal for promoting your services or creating eye-catching visuals. Open area for featuring your products, copy space, banner, advertisement. . Generative AI. Analysis financial growth decrease illustrations Colorful Bar Graph Showing Market Decline A vibrant bar graph illustrates a market downturn symbolizing economic trends. A vibrant bar graph illustrates a market. A vibrant bar graph illustrates a market downturn, symbolizing economic trends, financial instability, risk assessment, and potential recovery. It uses a rainbow color scheme for visual impact. Ideal for promoting your services or creating eye-catching visuals. Open area for featuring your products, copy space, banner, advertisement. . Generative AI
Free with trial This impactful image features a large, bold red downward arrow on a pristine white background, perfect for conveying a decrease or decline in data. Ideal for use in presentations, reports, and graphs, this professional design element is a clear and effective visual aid. The simplified design and sharp focus on the arrow ensure maximum visual impact and clarity. Whether illustrating a shrinking. Analysis financial growth decrease illustrations Powerful Red Downward Arrow Graphic A Clean Professional Visual Aid for Presentations Reports and Graphs. This impactful image features a large, bold red. This impactful image features a large, bold red downward arrow on a pristine white background, perfect for conveying a decrease or decline in data. Ideal for use in presentations, reports, and graphs, this professional design element is a clear and effective visual aid. The simplified design and sharp focus on the arrow ensure maximum visual impact and clarity. Whether illustrating a shrinking
Free with trial Stock market icons. Set of 15 stock market trendy minimal icons. Bear, Bull, market analysis, Stock Exchange icon. Design signs for web page, mobile app, packaging design. Vector illustration. Analysis financial growth decrease vectors Stock market icons set. Stock market icons. Set of 15 stock market trendy minimal icons. Bear, Bull, market analysis, Stock Exchange icon. Design signs for web. Stock market icons. Set of 15 stock market trendy minimal icons. Bear, Bull, market analysis, Stock Exchange icon. Design signs for web page, mobile app, packaging design. Vector illustration.
Free with trial Vector illustration of a graph with a downward arrow, representing decline or negative growth. Analysis financial growth decrease vectors Professional Graph with Arrow Down Outline Icon Vector Illustration. Vector illustration of a graph with a downward arrow, representing decline or negative. Vector illustration of a graph with a downward arrow, representing decline or negative growth.
Free with trial Miniature shopping cart with red upward trending arrow declining retail sales, negative economic trends. Conceptual image represents falling consumer spending, market downturn financial. Analysis financial growth decrease illustrations Miniature shopping cart with red upward trending arrow declining retail sales, negative economic trends. Conceptual image. Represents falling consumer spending. Miniature shopping cart with red upward trending arrow declining retail sales, negative economic trends. Conceptual image represents falling consumer spending, market downturn financial.
Free with trial This compelling image depicts a visual representation of the current state of the real estate market. Wooden houses, symbolic of residential properties, are nestled within an empty shopping cart. A red downward-trending chart, overlaid with a soft bokeh effect, graphically illustrates the negative market trend. This visual narrative conveys a significant drop in sales, a decrease in property. Analysis financial growth decrease illustrations Wooden Homes in Shopping Cart A Visual Representation of the Declining Real Estate Market and Reduced Demand. This compelling image depicts a visual. This compelling image depicts a visual representation of the current state of the real estate market. Wooden houses, symbolic of residential properties, are nestled within an empty shopping cart. A red downward-trending chart, overlaid with a soft bokeh effect, graphically illustrates the negative market trend. This visual narrative conveys a significant drop in sales, a decrease in property
Free with trial Explore dynamic data visualization showcasing stock market trends with candlestick graphs and blue lighting effects against a dark background for financial analysis. Analysis financial growth decrease illustrations Dynamic Digital Data Visualization with Stock Market Trends and Blue Candlestick Graphs on a Dark Background. Explore dynamic data visualization showcasing stock. Explore dynamic data visualization showcasing stock market trends with candlestick graphs and blue lighting effects against a dark background for financial analysis
Free with trial Abstract watercolor painting depicting a downward market trend, symbolized by red line graph over cityscape, representing financial instability, economic downturn, risk, and uncertainty. Spacious empty area designed for product displays and advertisements. Perfect for banners, branding, and marketing visuals. . Generative AI. Analysis financial growth decrease illustrations Watercolor Cityscape Market Trend Abstract watercolor painting depicting a downward market trend symbolized by red line graph. Abstract watercolor painting. Abstract watercolor painting depicting a downward market trend, symbolized by red line graph over cityscape, representing financial instability, economic downturn, risk, and uncertainty. Spacious empty area designed for product displays and advertisements. Perfect for banners, branding, and marketing visuals. . Generative AI
Free with trial Generative ai, The image shows a bar chart with a red arrow pointing down, indicating a downward trend in a financial market. The glowing blue bars represent rising values, while the red arrow signifies a drop in value,. Analysis financial growth decrease illustrations The image shows a blue and red graph with a red arrow pointing downwards, illustrating a decline in a company stock price. Generative ai, The image shows a bar. generative ai, The image shows a bar chart with a red arrow pointing down, indicating a downward trend in a financial market. The glowing blue bars represent rising values, while the red arrow signifies a drop in value,
Free with trial A vibrant graph displays two contrasting lines, one rising and the other falling, set against a blurred backdrop of light reflections, conveying a sense of motion and change. Analysis financial growth decrease illustrations Dynamic Trends Illustrate Contrasting Growth and Decline in Statistical Data Visualization. A vibrant graph displays two contrasting lines, one rising and the. A vibrant graph displays two contrasting lines, one rising and the other falling, set against a blurred backdrop of light reflections, conveying a sense of motion and change
Free with trial This image showcases a shiny gold percentage symbol against a clean white background. It represents financial concepts, special offers, and marketing strategies effectively. Analysis financial growth decrease illustrations Gold Percentage Symbol on a White Background for Financial and Marketing Concepts, Special Offers, Discounts and Promotions. This image showcases a shiny gold. This image showcases a shiny gold percentage symbol against a clean white background. It represents financial concepts, special offers, and marketing strategies effectively
Free with trial Vibrant bar chart visualization with dark background displaying data trends ,Generative ai. Analysis financial growth decrease illustrations Colorful bar chart on dark background, data visualization for business performance analysis and trend insights. Vibrant bar chart visualization with dark. Vibrant bar chart visualization with dark background displaying data trends ,Generative ai
Free with trial Minimalist black and white outline vector illustration of a simplified line graph icon for business analytics and financial performance tracking in a corporate environment. Analysis financial growth decrease vectors Clean and straightforward icon depicting an increasing and decreasing line graph. Minimalist black and white outline vector illustration of a simplified line. Minimalist black and white outline vector illustration of a simplified line graph icon for business analytics and financial performance tracking in a corporate environment
Free with trial Percentage sign icon, related to accounting, ideal for financial, tax, or business-related designs. Analysis financial growth decrease vectors Professional Percentage Sign Icon for Accounting Purposes. Percentage sign icon, related to accounting, ideal for financial, tax, or business-related designs. Percentage sign icon, related to accounting, ideal for financial, tax, or business-related designs.
Free with trial Set of linear graphs with red and blue lines showing different trends and dynamics vector illustration. Change in time of election results or income. For business analytics, financial reports. Analysis financial growth decrease vectors Set of linear graphs with red and blue lines showing different trends and dynamics vector illustration. Change in time of election. Results or income. For. Set of linear graphs with red and blue lines showing different trends and dynamics vector illustration. Change in time of election results or income. For business analytics, financial reports
Free with trial A striking red arrow plunges downwards, symbolizing a significant drop in data trends. This representation highlights a negative change in performance or market activity. Analysis financial growth decrease illustrations A red downward arrow indicating a sharp decline in numbers during market analysis. A striking red arrow plunges downwards, symbolizing a significant drop in data. A striking red arrow plunges downwards, symbolizing a significant drop in data trends. This representation highlights a negative change in performance or market activity.
Free with trial Economic Downturn. Deflation concept. A visual representation of deflation, showing a decrease in the general pricing and economic activity , high resolution. Analysis financial growth decrease illustrations Economic Downturn. Deflation concept. A visual representation of deflation, showing a decrease in the general pricing and economic activity , high resolution
Free with trial Vector illustration of a graph with a downward arrow, representing decline or negative growth. Analysis financial growth decrease vectors Professional Graph with Arrow Down Outline Icon Vector Illustration. Vector illustration of a graph with a downward arrow, representing decline or negative. Vector illustration of a graph with a downward arrow, representing decline or negative growth.
Free with trial Vector illustration of a graph with a downward arrow, representing decline or negative growth. Analysis financial growth decrease vectors Professional Graph with Arrow Down Outline Icon Vector Illustration. Vector illustration of a graph with a downward arrow, representing decline or negative. Vector illustration of a graph with a downward arrow, representing decline or negative growth.
Free with trial Vector illustration of a graph with a downward arrow, representing decline or negative growth. Analysis financial growth decrease vectors Professional Graph with Arrow Down Outline Icon Vector Illustration. Vector illustration of a graph with a downward arrow, representing decline or negative. Vector illustration of a graph with a downward arrow, representing decline or negative growth.
Free with trial A close-up view of a monitor displaying complex financial data, including stock market charts and numerical values. Stock market Data Displayed on a Monitor. Analysis financial growth decrease illustrations Stock market Data Displayed on a Monitor. A close-up view of a monitor displaying complex financial data, including stock market charts and numerical values. A close-up view of a monitor displaying complex financial data, including stock market charts and numerical values. Stock market Data Displayed on a Monitor
Free with trial Reduction chart icon Vector symbol or sign set collection in black and white outline. Analysis financial growth decrease vectors Decline Chart Icon Illustrating Decrease in Performance, Economic Downturn, and Analytical Data. Reduction chart icon Vector symbol or sign set collection in. Reduction chart icon Vector symbol or sign set collection in black and white outline
Free with trial A minimalistic illustration features a diminishing stack of coins alongside a downward arrow, representing reduced spending. The design uses clean vector style and balanced white tones for clarity. Analysis financial growth decrease illustrations Shrinking stack of coins with downward arrow indicating reduced spending and financial decline. A minimalistic illustration features a diminishing stack of coins. A minimalistic illustration features a diminishing stack of coins alongside a downward arrow, representing reduced spending. The design uses clean vector style and balanced white tones for clarity
Free with trial Concept of falling interest rates, showing a descending graph and coins dropping, illustrating economic impact and financial trends. Analysis financial growth decrease illustrations Falling Interest Rates with Graph and Coins Symbolizing Impact. Concept of falling interest rates, showing a descending graph and coins dropping, illustrating. Concept of falling interest rates, showing a descending graph and coins dropping, illustrating economic impact and financial trends
Free with trial Concept of falling interest rates, showing a descending graph and coins dropping, illustrating economic impact and financial trends. Analysis financial growth decrease illustrations Falling Interest Rates with Graph and Coins Symbolizing Impact. Concept of falling interest rates, showing a descending graph and coins dropping, illustrating. Concept of falling interest rates, showing a descending graph and coins dropping, illustrating economic impact and financial trends
Free with trial Concept of falling interest rates, showing a descending graph and coins dropping, illustrating economic impact and financial trends. Analysis financial growth decrease illustrations Falling Interest Rates with Graph and Coins Symbolizing Impact. Concept of falling interest rates, showing a descending graph and coins dropping, illustrating. Concept of falling interest rates, showing a descending graph and coins dropping, illustrating economic impact and financial trends
Free with trial This image visually depicts the impact of declining currency and interest rates within an economic context. A percentage model, a fundamental tool in economic analysis, serves as the foundation. The downward-pointing arrow dramatically illustrates the negative trend, signifying a decrease in both the value of a specific currency and the interest rates associated with loans and investments. This. Analysis financial growth decrease illustrations Understanding Declining Currency and Interest Rates: A Visual Representation of Economic Trends. This image visually depicts the impact of declining currency and. This image visually depicts the impact of declining currency and interest rates within an economic context. A percentage model, a fundamental tool in economic analysis, serves as the foundation. The downward-pointing arrow dramatically illustrates the negative trend, signifying a decrease in both the value of a specific currency and the interest rates associated with loans and investments. This
Free with trial The image illustrates the concept of deflation, showing a downward trend in the overall price level of goods and services in the economy , vintage charm. Analysis financial growth decrease illustrations Economic downturn. Deflation is a decrease in the general price level in an economy. The image illustrates the concept of deflation, showing a downward trend in. The image illustrates the concept of deflation, showing a downward trend in the overall price level of goods and services in the economy , vintage charm
Free with trial Elevate your financial presentations and data visualizations with these captivating vintage-style arrow graphics. Perfect for illustrating price fluctuations, interest rate movements, and market trends, these retro-inspired up and down arrow designs are a visually engaging way to convey complex information. The sepia tone and textured background add a touch of vintage charm, bringing a classic. Analysis financial growth decrease illustrations Vintage-Inspired Arrow Graphics for Illustrating Price & Interest Rate Trends: A Retro Style Design Element. Elevate your financial presentations and data. Elevate your financial presentations and data visualizations with these captivating vintage-style arrow graphics. Perfect for illustrating price fluctuations, interest rate movements, and market trends, these retro-inspired up and down arrow designs are a visually engaging way to convey complex information. The sepia tone and textured background add a touch of vintage charm, bringing a classic
Free with trial Graph chart infographic report set with statistic arrow data elements for financial market analysis and planning in business performance research for your illustration. Analysis financial growth decrease vectors Graph chart infographic report set. With statistic arrow data elements for financial market analysis and planning in business performance research for your
Free with trial Graph chart infographic report set with statistic arrow data elements for financial market analysis and planning in business performance research for your illustration. Analysis financial growth decrease vectors Graph chart infographic report set. With statistic arrow data elements for financial market analysis and planning in business performance research for your
Free with trial A close-up of a magnifying glass revealing intricate lines of code, generated by AI. The image evokes a sense of mystery and technological advancement, hinting at the power and potential of artificial intelligence in data analysis and cybersecurity. Analysis financial growth decrease illustrations AI Magnifies Code. A close-up of a magnifying glass revealing intricate lines of code, generated by AI. The image evokes a sense of mystery and technological. A close-up of a magnifying glass revealing intricate lines of code, generated by AI. The image evokes a sense of mystery and technological advancement, hinting at the power and potential of artificial intelligence in data analysis and cybersecurity.
Free with trial This image features two variations of a graph icon showing a downward trend. One is a simple outline, while the other is a solid black silhouette. Both depict a graph with a sharp decline, represented by a line with a downward-pointing arrow. The icons are suitable for illustrating concepts like financial loss, economic downturn, negative growth, or any situation involving a decrease in value or performance. Analysis financial growth decrease illustrations Declining Graph Icon Set. This image features two variations of a graph icon showing a downward trend. One is a simple outline, while the other is a solid black. This image features two variations of a graph icon showing a downward trend. One is a simple outline, while the other is a solid black silhouette. Both depict a graph with a sharp decline, represented by a line with a downward-pointing arrow. The icons are suitable for illustrating concepts like financial loss, economic downturn, negative growth, or any situation involving a decrease in value or performance.
Free with trial A minimalist bar chart with a descending line graph overlay, symbolizing financial loss, performance decline, or negative data trends. Ideal for presentations, dashboards, economic reports, and warning visuals. Analysis financial growth decrease vectors Downward Trend Bar Chart Icon. A minimalist bar chart with a descending line graph overlay, symbolizing financial loss, performance decline, or negative data. A minimalist bar chart with a descending line graph overlay, symbolizing financial loss, performance decline, or negative data trends. Ideal for presentations, dashboards, economic reports, and warning visuals
Free with trial Stock crisis red price drop arrow down chart fall. Stock market exchange analysis or forex graph business and finance money losing moving economic inflation deflation investment loss crash. Illustration. Analysis financial growth decrease illustrations Stock crisis red price drop arrow down chart fall. Stock market exchange analysis or forex graph business and finance money losing moving economic inflation
Free with trial Stock crisis red price drop arrow down chart fall. Stock market exchange analysis or forex graph business and finance money losing moving economic inflation deflation investment loss crash. Illustration. Analysis financial growth decrease illustrations Stock crisis red price drop arrow down chart fall. Stock market exchange analysis or forex graph business and finance money losing moving economic inflation
Free with trial Stock crisis red price drop arrow down chart fall. Stock market exchange analysis or forex graph business and finance money losing moving economic inflation deflation investment loss crash. Illustration. Analysis financial growth decrease illustrations Stock crisis red price drop arrow down chart fall. Stock market exchange analysis or forex graph business and finance money losing moving economic inflation
Free with trial Stock crisis red price drop arrow down chart fall. Stock market exchange analysis or forex graph business and finance money losing moving economic inflation deflation investment loss crash. Illustration. Analysis financial growth decrease illustrations Stock crisis red price drop arrow down chart fall. Stock market exchange analysis or forex graph business and finance money losing moving economic inflation
Free with trial A row of colorful wooden blocks, resembling a bar graph, sits on a dark wooden surface. The blocks are various heights and colors, creating a visually appealing and potentially symbolic representation of growth or data. Analysis financial growth decrease illustrations Colorful Wooden Blocks Chart. A row of colorful wooden blocks, resembling a bar graph, sits on a dark wooden surface. The blocks are various heights and colors. A row of colorful wooden blocks, resembling a bar graph, sits on a dark wooden surface. The blocks are various heights and colors, creating a visually appealing and potentially symbolic representation of growth or data.
Free with trial A businessman in a suit interacts with a digital interface illustrating the relationship between quality and cost. The image features a visual representation of increasing quality and decreasing cost, with checkmarks indicating positive outcomes. This concept is ideal for illustrating business strategies, efficiency, and financial planning. The scene includes a clipboard with charts, adding a professional context. Analysis financial growth decrease illustrations Quality vs. Cost: Business Concept. A businessman in a suit interacts with a digital interface illustrating the relationship between quality and cost. The image. A businessman in a suit interacts with a digital interface illustrating the relationship between quality and cost. The image features a visual representation of increasing quality and decreasing cost, with checkmarks indicating positive outcomes. This concept is ideal for illustrating business strategies, efficiency, and financial planning. The scene includes a clipboard with charts, adding a professional context.
Free with trial Strategic Decisions: Integrating Business Analytics with Strategic Thinking. This visual portrays the dynamic interaction between business analytics and strategic thinking, showcasing how analytical insights drive strategic planning and decision-making. It emphasizes the synergy between data analysis and strategic foresight in achieving business goals. --chaos 10 --ar 16:9 --style raw --stylize, immersive wallpaper background. Analysis financial growth decrease illustrations Hand Drawn Colorful Bar Charts and Pie Charts. Strategic Decisions: Integrating Business Analytics with Strategic Thinking. This visual portrays the dynamic. Strategic Decisions: Integrating Business Analytics with Strategic Thinking. This visual portrays the dynamic interaction between business analytics and strategic thinking, showcasing how analytical insights drive strategic planning and decision-making. It emphasizes the synergy between data analysis and strategic foresight in achieving business goals. --chaos 10 --ar 16:9 --style raw --stylize, immersive wallpaper background
Free with trial A worrying business report showing a sharp decline, generated by AI, rests on a wooden desk in an office setting. The red graph line dramatically falls, symbolizing potential losses or market downturn. This AI-generated image is perfect for illustrating financial instability or economic crisis. Analysis financial growth decrease illustrations Declining Business Graph. A worrying business report showing a sharp decline, generated by AI, rests on a wooden desk in an office setting. The red graph line. A worrying business report showing a sharp decline, generated by AI, rests on a wooden desk in an office setting. The red graph line dramatically falls, symbolizing potential losses or market downturn. This AI-generated image is perfect for illustrating financial instability or economic crisis.
Free with trial A candlestick chart showing a significant downward trend. The chart features black candlesticks indicating price fluctuations over time, with red, green, and orange lines tracing different moving averages. A bar graph at the bottom provides additional data. This image can be used to represent financial loss, market downturns, or economic recession. Analysis financial growth decrease illustrations Downward Trend Candlestick Chart. A candlestick chart showing a significant downward trend. The chart features black candlesticks indicating price fluctuations. A candlestick chart showing a significant downward trend. The chart features black candlesticks indicating price fluctuations over time, with red, green, and orange lines tracing different moving averages. A bar graph at the bottom provides additional data. This image can be used to represent financial loss, market downturns, or economic recession.
Free with trial A clean and modern vector illustration of a percentage sign, featuring two pale yellow circles with maroon outlines and a light blue diagonal bar also outlined in maroon. This simple graphic is set against a crisp white background, making it versatile for various design projects. It effectively conveys concepts of discounts, sales, financial rates, statistics, and promotions. Ideal for use in business presentations, marketing materials, educational content, websites, and mobile applications to highlight numerical data or special offers. Analysis financial growth decrease vectors Percentage Sign Vector Icon Illustration. A clean and modern vector illustration of a percentage sign, featuring two pale yellow circles with maroon outlines and. A clean and modern vector illustration of a percentage sign, featuring two pale yellow circles with maroon outlines and a light blue diagonal bar also outlined in maroon. This simple graphic is set against a crisp white background, making it versatile for various design projects. It effectively conveys concepts of discounts, sales, financial rates, statistics, and promotions. Ideal for use in business presentations, marketing materials, educational content, websites, and mobile applications to highlight numerical data or special offers.
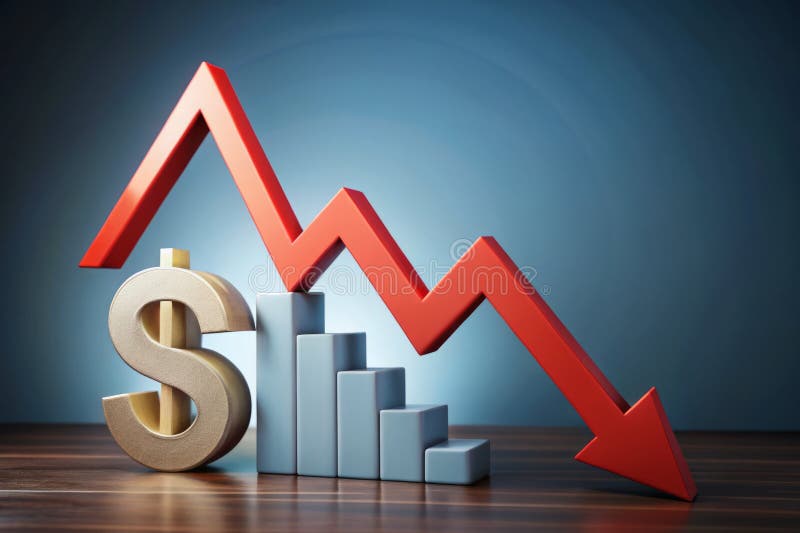
Free with trial 3D illustration of gold bars with a red arrow sloping down, symbolizing financial decrease, and scattered golden coins. Analysis financial growth decrease illustrations Gold bars with red arrow and scattered coins. 3D illustration of gold bars with a red arrow sloping down, symbolizing financial decrease, and scattered golden. 3D illustration of gold bars with a red arrow sloping down, symbolizing financial decrease, and scattered golden coins
Free with trial Strategic Decisions: Integrating Business Analytics with Strategic Thinking. This visual portrays the dynamic interaction between business analytics and strategic thinking, showcasing how analytical insights drive strategic planning and decision-making. It emphasizes the synergy between data analysis and strategic foresight in achieving business goals. --chaos 10 --ar 16:9 --style raw --stylize, aesthetic wallpaper background. Analysis financial growth decrease illustrations Colorful Pie Charts and Bar Graphs on a White Paper. Strategic Decisions: Integrating Business Analytics with Strategic Thinking. This visual portrays the. Strategic Decisions: Integrating Business Analytics with Strategic Thinking. This visual portrays the dynamic interaction between business analytics and strategic thinking, showcasing how analytical insights drive strategic planning and decision-making. It emphasizes the synergy between data analysis and strategic foresight in achieving business goals. --chaos 10 --ar 16:9 --style raw --stylize, aesthetic wallpaper background
Free with trial Golden Data Visualization. AI Generated. Abstract 3D rendering of a golden bar graph, depicting data fluctuations Represents growth and market trends AI. Analysis financial growth decrease illustrations Golden Data Visualization. AI Generated. Abstract 3D rendering of a golden bar graph, depicting data fluctuations Represents growth and market trends AI
Free with trial A 3D icon featuring a dark square base with a gold border. On the base are four vertical bars of varying heights, colored in shades of beige and gold. A red zigzag line representing a downward trend is positioned above the bars, with its peak resting on the tallest bar and its subsequent segments descending. The icon is isolated on a clean white background. Analysis financial growth decrease illustrations Downward financial trend graph icon chart business. A 3D icon featuring a dark square base with a gold border. On the base are four vertical bars of varying. A 3D icon featuring a dark square base with a gold border. On the base are four vertical bars of varying heights, colored in shades of beige and gold. A red zigzag line representing a downward trend is positioned above the bars, with its peak resting on the tallest bar and its subsequent segments descending. The icon is isolated on a clean white background
Free with trial Stock market icons. Set of 20 stock market trendy minimal icons. Bear, Bull, market analysis, Stock Exchange icon. Design signs for web page, mobile app, packaging design. Vector illustration. Analysis financial growth decrease vectors Stock market icons set. Stock market icons. Set of 20 stock market trendy minimal icons. Bear, Bull, market analysis, Stock Exchange icon. Design signs for web. Stock market icons. Set of 20 stock market trendy minimal icons. Bear, Bull, market analysis, Stock Exchange icon. Design signs for web page, mobile app, packaging design. Vector illustration.
Free with trial Financial crisis business market. Currency risk. White background with 3D red button for global inflation concept. Analysis financial growth decrease illustrations 3D illustration of red button switching on global inflation. Financial crisis business market. Currency risk. White background with 3D red button for global. Financial crisis business market. Currency risk. White background with 3D red button for global inflation concept.
Free with trial Downward arrow with SALE, analytics dashboard, and a cloud icon. Ideal for ecommerce, marketing, analysis, cloud services, business strategy, financial review simple landing page. Analysis financial growth decrease vectors Sales Decline with Data Analytics and Cloud Connectivity for Business Insights. Downward arrow with SALE, analytics dashboard, and a cloud icon. Ideal for. Downward arrow with SALE, analytics dashboard, and a cloud icon. Ideal for ecommerce, marketing, analysis, cloud services, business strategy, financial review simple landing page
Free with trial A hand manipulates a red arrow pointing downwards, superimposed on a bar graph, illustrating a market downturn. This image, generated by AI, symbolizes economic recession, financial crisis, or business failure, showcasing the impact of negative trends. Analysis financial growth decrease illustrations Declining Market Trend. A hand manipulates a red arrow pointing downwards, superimposed on a bar graph, illustrating a market downturn. This image, generated by. A hand manipulates a red arrow pointing downwards, superimposed on a bar graph, illustrating a market downturn. This image, generated by AI, symbolizes economic recession, financial crisis, or business failure, showcasing the impact of negative trends.
Free with trial Abstract financial graph fluctuating over dark textured surface Images are created using AI. Analysis financial growth decrease illustrations Abstract financial graph fluctuating over dark textured surface. Images are created using AI
Free with trial Financial concept image featuring a blue bar chart with a red downward arrow, illustrating decline, recession, or loss over time. Ideal for presentations, reports, infographics, economic forecasts, and business documentation. Clean, clear, and professional visual, created ai. Analysis financial growth decrease illustrations Business bar chart showing financial decline with downward arrow. Financial concept image featuring a blue bar chart with a red downward arrow, illustrating. Financial concept image featuring a blue bar chart with a red downward arrow, illustrating decline, recession, or loss over time. Ideal for presentations, reports, infographics, economic forecasts, and business documentation. Clean, clear, and professional visual, created ai.
Free with trial A glowing green bar chart with a data line and grid on a black background, representing financial performance. Analysis financial growth decrease illustrations Glowing Green Bar Chart with Data Line on photo Black graph finance. A glowing green bar chart with a data line and grid on a black background, representing. A glowing green bar chart with a data line and grid on a black background, representing financial performance
Free with trial A visual representation of data showing a decline over a period. The blue bars are arranged in descending order of height, each marked with numerical indicators, suggesting a decrease in value or quantity. Analysis financial growth decrease illustrations Blue bar chart showing decreasing trend over time with numerical labels. A visual representation of data showing a decline over a period. The blue bars are. A visual representation of data showing a decline over a period. The blue bars are arranged in descending order of height, each marked with numerical indicators, suggesting a decrease in value or quantity
Free with trial A person's open palm supports a glowing blue graph illustrating a downward trend for cost and an upward trend for quality against a dark background. Analysis financial growth decrease illustrations Hand holding graph showing decreasing cost and increasing quality decrease. A person's open palm supports a glowing blue graph illustrating a downward trend for. A person's open palm supports a glowing blue graph illustrating a downward trend for cost and an upward trend for quality against a dark background
Free with trial Financial downturn concept. A business professional climbs tall blue bars, carrying a briefcase and analyze declining bar graph and chart using magnifying glass. Analysis financial growth decrease vectors Financial downturn concept, businessman analyze declining bar graph and chart. Financial downturn concept. A business professional climbs tall blue bars. Financial downturn concept. A business professional climbs tall blue bars, carrying a briefcase and analyze declining bar graph and chart using magnifying glass
Free with trial Candlestick chart with buy and sell signals over digital world map and city skyline on dark background, symbolizing global market and forex trading. Analysis financial growth decrease illustrations Global financial chart with buy and sell indicators over world map and cityscape background, illustrating stock market and forex. Candlestick chart with buy and. Candlestick chart with buy and sell signals over digital world map and city skyline on dark background, symbolizing global market and forex trading
Free with trial Circular buttons labeled "BUY" and "SELL" sit on a surface with a glowing stock market chart in the background. The chart features fluctuating orange lines on a dark grid, illustrating price movements and market volatility. The buttons are shiny and metallic, with embossed text, suggesting a dynamic financial environment. The composition emphasizes themes of trading and investment in the stock market. Analysis financial growth decrease illustrations Buy and sell buttons with stock market chart in background, financial concept. Circular buttons labeled 'BUY' and 'SELL' sit on a surface with a glowing stock. Circular buttons labeled "BUY" and "SELL" sit on a surface with a glowing stock market chart in the background. The chart features fluctuating orange lines on a dark grid, illustrating price movements and market volatility. The buttons are shiny and metallic, with embossed text, suggesting a dynamic financial environment. The composition emphasizes themes of trading and investment in the stock market.
Free with trial Elevate your everyday style with Abu Taher's collection of Typography T-Shirt Designs, where words meet artistry. Analysis financial growth decrease vectors Collection of 32 icons representing increase and decrease in business and finance. Elevate your everyday style with Abu Taher's collection of Typography T-Shirt. Elevate your everyday style with Abu Taher's collection of Typography T-Shirt Designs, where words meet artistry
Free with trial Pointing to Graph Showing the Trend of Fluctuations in Financial Stock Values , vibrant highlights. Analysis financial growth decrease illustrations Pointing to Graph Showing the Trend of Fluctuations in Financial Stock Values. Vibrant highlights
Free with trial Cost and quality control, business strategy and project management concept. Businessman use computer laptop with quality control growth graph and cost reduction, control budget cost and improvement. Analysis financial growth decrease illustrations Cost and quality control, business strategy and project management concept. Businessman use computer laptop with quality control. Growth graph and cost. Cost and quality control, business strategy and project management concept. Businessman use computer laptop with quality control growth graph and cost reduction, control budget cost and improvement
Free with trial A character stands isolated on a white background, holding a large red arrow pointing downward, symbolizing decline or decrease. Analysis financial growth decrease illustrations Character Holding a Large Red Downward Arrow Representing Decline on a White Background. A character stands isolated on a white background, holding a large red. A character stands isolated on a white background, holding a large red arrow pointing downward, symbolizing decline or decrease
Free with trial A minimalist 3D white bar chart displays a clear downward trend. Four bars of decreasing height are shown, with a sharp white arrow pointing downwards from the top of the second bar, indicating a significant decline. The chart is presented in isolation against a clean white background, emphasizing the concept of financial or economic downturn. Analysis financial growth decrease illustrations 3D White Bar Chart with a Downward Trending Arrow Symbolizing Decline graph decrease. A minimalist 3D white bar chart displays a clear downward trend. Four bars. A minimalist 3D white bar chart displays a clear downward trend. Four bars of decreasing height are shown, with a sharp white arrow pointing downwards from the top of the second bar, indicating a significant decline. The chart is presented in isolation against a clean white background, emphasizing the concept of financial or economic downturn
Free with trial Happy and sad businessman from rising and falling chart. Business success and failure infographic. Man sitting at computer table. Office manager. Startup project growth. Stock exchange. Vector concept. Analysis financial growth decrease vectors Happy and sad businessman from rising and falling chart. Business success and failure infographic. Man sitting at computer table. Office manager. Startup
Free with trial Financial crisis business market. Currency risk. Red header with arrows and percent signs for global inflation concept. Analysis financial growth decrease illustrations Arrows and percents signs going up to illustrate global inflation over red background banner. Financial crisis business market. Currency risk. Red header with. Financial crisis business market. Currency risk. Red header with arrows and percent signs for global inflation concept.
Free with trial A golden bitcoin coin with a prominent B symbol is centered within a green circular frame. A red downward-pointing arrow and a green upward-pointing arrow are positioned to the right of the coin, suggesting financial fluctuation. Analysis financial growth decrease illustrations Golden bitcoin symbol with downward red arrow and green arrow cryptocurrency digital currency. A golden bitcoin coin with a prominent B symbol is centered within. A golden bitcoin coin with a prominent B symbol is centered within a green circular frame. A red downward-pointing arrow and a green upward-pointing arrow are positioned to the right of the coin, suggesting financial fluctuation
Free with trial A character is gripping a large red arrow pointing downward, representing a decrease or decline in values, set against a clean white background. Analysis financial growth decrease illustrations Character Holding a Large Red Downward Arrow Symbolizes Decline Against a Simple White Background. A character is gripping a large red arrow pointing downward. A character is gripping a large red arrow pointing downward, representing a decrease or decline in values, set against a clean white background
Free with trial Percentage sign icon, related to accounting, ideal for financial, tax, or business-related designs. Analysis financial growth decrease vectors Professional Percentage Sign Icon for Accounting Purposes. Percentage sign icon, related to accounting, ideal for financial, tax, or business-related designs. Percentage sign icon, related to accounting, ideal for financial, tax, or business-related designs.
Free with trial Percentage sign icon, related to accounting, ideal for financial, tax, or business-related designs. Analysis financial growth decrease vectors Professional Percentage Sign Icon for Accounting Purposes. Percentage sign icon, related to accounting, ideal for financial, tax, or business-related designs. Percentage sign icon, related to accounting, ideal for financial, tax, or business-related designs.
Free with trial A character stands isolated and holds a large red downward arrow, representing a decrease in values or metrics. Analysis financial growth decrease illustrations Character Holding a Large Red Downward Arrow Symbolizing Decline on a White Background. A character stands isolated and holds a large red downward arrow. A character stands isolated and holds a large red downward arrow, representing a decrease in values or metrics
Free with trial Reduction chart icon Black line art vector in black and white outline set collection sign. Analysis financial growth decrease vectors Decline Chart Icon Illustrating Decrease in Performance, Economic Downturn, and Analytical Data. Reduction chart icon Black line art vector in black and white. Reduction chart icon Black line art vector in black and white outline set collection sign
Free with trial This infographic illustrates a crucial aspect of data analysis: recognizing and interpreting downward trends. The chart clearly displays a decreasing arrow, highlighting a negative slope and a reduction in value over time. Understanding these downward trends is critical in various fields, from finance and business to investment and market analysis. The visual representation aids in quickly. Analysis financial growth decrease illustrations Analyzing Downward Trends in Data A Comprehensive Guide to Understanding Decreasing Charts and Graphs in Business. This infographic illustrates a crucial aspect. This infographic illustrates a crucial aspect of data analysis: recognizing and interpreting downward trends. The chart clearly displays a decreasing arrow, highlighting a negative slope and a reduction in value over time. Understanding these downward trends is critical in various fields, from finance and business to investment and market analysis. The visual representation aids in quickly
Free with trial A laptop screen shows a graph with orange lines. The graph is showing a downward trend, which could indicate a decrease in stock prices or a decline in a particular market. Analysis financial growth decrease illustrations A laptop screen shows a graph with orange lines. The graph is showing a downward trend, which could indicate a decrease in stock. Prices or a decline in a
Free with trial Inflation graph shows rising costs. Recession question mark graph indicates economic decline. Concepts of market fluctuation, financial crisis and budget challenges. Analysis financial growth decrease illustrations Inflation graph shows rising costs. Recession question mark graph indicates economic decline. Concepts of market fluctuation,. Financial crisis and budget
Free with trial A dramatic image depicting a significant decline in the Chinese economy. The Chinese flag overlays a nighttime Shanghai skyline, with a large red arrow dramatically pointing downwards, superimposed on a falling stock market graph. This image is ideal for illustrating economic news, financial reports, and articles about market volatility and global economic trends. Analysis financial growth decrease illustrations China Economic Downturn: Stock Market Crash and Shanghai Skyline. A dramatic image depicting a significant decline in the Chinese economy. The Chinese flag. A dramatic image depicting a significant decline in the Chinese economy. The Chinese flag overlays a nighttime Shanghai skyline, with a large red arrow dramatically pointing downwards, superimposed on a falling stock market graph. This image is ideal for illustrating economic news, financial reports, and articles about market volatility and global economic trends.
Free with trial Abstract red background, black graph line, decline, instability, financial crisis. Symbolizes risk, uncertainty, downward trend. Can be used for display or montage your products. Generative AI. Analysis financial growth decrease illustrations Red Market Trend Abstract red background black graph line decline instability financial crisis Symbolizes risk uncertainty. Abstract red background, black graph. Abstract red background, black graph line, decline, instability, financial crisis. Symbolizes risk, uncertainty, downward trend. Can be used for display or montage your products. Generative AI
Free with trial This image is a vibrant illustration of decreasing costs, featuring money, a coin, and a downward arrow, all set against a white background, symbolizing financial savings. Analysis financial growth decrease vectors Vector art of a vibrant illustration showcasing the concept of decreasing costs, featuring money, coin, and a downward arrow. This image is a vibrant. This image is a vibrant illustration of decreasing costs, featuring money, a coin, and a downward arrow, all set against a white background, symbolizing financial savings
Free with trial Vibrant red line indicates financial market decline on digital display. Chart shows stock market loss, economy decay, investment risk. Red graph pattern represents trading volatility. Analysis financial growth decrease illustrations Vibrant red line indicates financial market decline on digital display. Chart shows stock market loss, economy decay, investment. Risk. Red graph pattern. Vibrant red line indicates financial market decline on digital display. Chart shows stock market loss, economy decay, investment risk. Red graph pattern represents trading volatility.
 Sign in