Free with trial Digital representation of a house with falling percentage symbol over a cityscape indicating real estate market trends and investment opportunities in financial sector Sigmoid. Analysis financial growth decrease illustrations A businessman holds a tablet displaying a house icon and a decreasing percentage symbol above a city skyline. Digital representation of a house with falling. Digital representation of a house with falling percentage symbol over a cityscape indicating real estate market trends and investment opportunities in financial sector Sigmoid
Free with trial Hand drawn style black fill vector illustration of a bar chart showing a downward trend with an arrow. this graphic has no white fills, perfect for transparent overlays and versatile design use. Analysis financial growth decrease vectors Black fill hand drawn style downward trend bar chart graph. Hand drawn style black fill vector illustration of a bar chart showing a downward trend with an arrow. hand drawn style black fill vector illustration of a bar chart showing a downward trend with an arrow. this graphic has no white fills, perfect for transparent overlays and versatile design use
Free with trial Businessman Presenting a Cost Reduction Graph with Dollar Signs in a Modern Office Environment. Bitwise. Analysis financial growth decrease illustrations Businessman Presenting a Cost Reduction Graph with Dollar Signs in a Modern Office Environment. Bitwise.
Free with trial A businessman's open palm displays a blue upward arrow labeled Quality and a red downward arrow labeled Cost with glowing particles. Analysis financial growth decrease illustrations Businessman\'s hand holding upward quality arrow and downward cost arrow image. A businessman's open palm displays a blue upward arrow labeled Quality and a red. A businessman's open palm displays a blue upward arrow labeled Quality and a red downward arrow labeled Cost with glowing particles
Free with trial Bitcoin coin with lightbulb icon and falling market chart vector illustration. Financial crisis, investment risk, digital currency, economic downturn, crypto innovation, market volatility. Virtual. Analysis financial growth decrease vectors Cryptocurrency Market Decline and Innovation Concept Vector Illustration with Bitcoin and Lightbulb Icon. Bitcoin coin with lightbulb icon and falling market. Bitcoin coin with lightbulb icon and falling market chart vector illustration. Financial crisis, investment risk, digital currency, economic downturn, crypto innovation, market volatility. Virtual
Free with trial A single brown egg in a carton with a glowing red chart showing rising prices. Illustrates food inflation, commodity market volatility, and economic trends. Analysis financial growth decrease illustrations Rising Egg Prices Concept with Red Financial Graph Overlay. A single brown egg in a carton with a glowing red chart showing rising prices. Illustrates food. A single brown egg in a carton with a glowing red chart showing rising prices. Illustrates food inflation, commodity market volatility, and economic trends
Free with trial The chart shows falling oil prices with an oil rig visible in the background. Data highlights market changes. Analysis financial growth decrease illustrations Oil price trends show decline near oil extraction site in industry setting Generative AI. The chart shows falling oil prices with an oil rig visible in the. The chart shows falling oil prices with an oil rig visible in the background. Data highlights market changes
Free with trial A man in a dark suit and blue tie interacts with a glowing blue and white digital graph displaying rising profits and decreasing costs against a blurred city background. Analysis financial growth decrease illustrations Businessman touching glowing digital graph showing rising profits and decreasing costs suit finger. A man in a dark suit and blue tie interacts with a glowing. A man in a dark suit and blue tie interacts with a glowing blue and white digital graph displaying rising profits and decreasing costs against a blurred city background
Free with trial A 3d bar graph showing a downward trend with a red arrow indicating decline, representing business loss. Analysis financial growth decrease vectors Bar chart with red arrow pointing down on white background. A 3d bar graph showing a downward trend with a red arrow indicating decline, representing business. A 3d bar graph showing a downward trend with a red arrow indicating decline, representing business loss
Free with trial A dollar bill connected to a bar graph resembling a sound wave with an arrow. Clear details and vibrant colors. Analysis financial growth decrease illustrations Dollar Bill and Sound Wave Bar Graph with Arrow money finance. A dollar bill connected to a bar graph resembling a sound wave with an arrow. Clear details and. A dollar bill connected to a bar graph resembling a sound wave with an arrow. Clear details and vibrant colors
Free with trial A flat design shows a bar graph depicting decreasing sales, with a downward trending red arrow. Analysis financial growth decrease vectors Decreasing Business Chart Shows a Dramatic Downturn in Sales. A flat design shows a bar graph depicting decreasing sales, with a downward trending red arrow. A flat design shows a bar graph depicting decreasing sales, with a downward trending red arrow.
Free with trial Businessman in Suit Holding Tablet with House Icon and Downward Percentage Symbol Against Urban Skyline Background Sigmoid. Analysis financial growth decrease illustrations A businessman in a suit holds a tablet displaying a house icon with a downward percentage symbol, symbolizing market. Businessman in Suit Holding Tablet with. Businessman in Suit Holding Tablet with House Icon and Downward Percentage Symbol Against Urban Skyline Background Sigmoid
Free with trial Visual representation of decline or negative trend. Downward arrow over a multi-colored bar chart, signifying reduction or decrease. Analysis financial growth decrease vectors Red arrow pointing down at colorful decreasing bar chart graph. Visual representation of decline or negative trend. Downward arrow over a multi-colored bar chart. Visual representation of decline or negative trend. Downward arrow over a multi-colored bar chart, signifying reduction or decrease
Free with trial Bad stock market chart and sad bear. Analysis financial growth decrease illustrations Bad stock market chart and sad bear.
Free with trial A person in a suit holding a magnifying glass showing blue upward and red downward percentage arrows. Analysis financial growth decrease illustrations Person holding magnifying glass with percentage arrows hand blue. A person in a suit holding a magnifying glass showing blue upward and red downward percentage. A person in a suit holding a magnifying glass showing blue upward and red downward percentage arrows.
Free with trial Digital Illustration of Real Estate Market Decline with House Icon and Percentage Symbol Overlaid on Keyboard Imagery Sigmoid. Analysis financial growth decrease illustrations This digital illustration illustrates the decline in the real estate market with a house icon and downward-moving. Digital Illustration of Real Estate Market. Digital Illustration of Real Estate Market Decline with House Icon and Percentage Symbol Overlaid on Keyboard Imagery Sigmoid
Free with trial A 3D red arrow graph sharply descends, symbolizing a significant downturn or loss, set against a dark, textured surface. Analysis financial growth decrease illustrations Red Arrow Graph Showing Sharp Decline on Dark Textured Background. A 3D red arrow graph sharply descends, symbolizing a significant downturn or loss, set against. A 3D red arrow graph sharply descends, symbolizing a significant downturn or loss, set against a dark, textured surface
Free with trial A close-up view of multiple hands working together to hold gears, representing the balance of quality and cost in business. Data visualization appears in the background. Raster. Analysis financial growth decrease illustrations Hands Collaborating with Gears Symbolizing Quality and Cost Management in Business with Data Visualization Elements in. A close-up view of multiple hands working. A close-up view of multiple hands working together to hold gears, representing the balance of quality and cost in business. Data visualization appears in the background. Raster
Free with trial Business team analyzing data for cost reduction with charts, calculators, and documents on a conference table in a modern office setting. Bitwise. Analysis financial growth decrease illustrations Business team analyzing data for cost reduction with charts, calculators, and documents on a conference table in a. Modern office setting. Bitwise
Free with trial Business trend arrow icon in black circle. Upward and downward arrows symbol. Illustration. Analysis financial growth decrease vectors Business trend arrow icon in black circle. Upward and downward arrows symbol. Illustration
Free with trial Business professional analyzing cost trends with keyboard and graphical data representation showing percentages and target icons in an office setting. Glyphic. Analysis financial growth decrease illustrations Business professional analyzing cost trends with keyboard and graphical data representation showing percentages and. Target icons in an office setting. Glyphic
Free with trial Simple flat design illustration of a stock market trend graph with a blue fill. The axis are dark gray and background is black. Analysis financial growth decrease vectors Flat Design Stock Market Trend Graph with Axis on a Black Background. Simple flat design illustration of a stock market trend graph with a blue fill. The axis. Simple flat design illustration of a stock market trend graph with a blue fill. The axis are dark gray and background is black.
Free with trial Futuristic robotic hand interacting with digital home icon and declining percentage graph in urban skyline background illustrating real estate market trends Sigmoid. Analysis financial growth decrease illustrations A robotic hand engages with a digital home icon, displaying a declining graph to represent trends in the real estate. Futuristic robotic hand interacting with. Futuristic robotic hand interacting with digital home icon and declining percentage graph in urban skyline background illustrating real estate market trends Sigmoid
Free with trial Business trend arrow icon with long shadow. Upward and downward arrows symbol. Illustration. Analysis financial growth decrease vectors Business trend arrow icon with long shadow. Upward and downward arrows symbol. Illustration
Free with trial A series of colorful bars representing a graph, each with water droplets, illuminated by a spotlight against a dark background with blurred city lights. Analysis financial growth decrease illustrations Colorful bar graph with water droplets under a spotlight on a dark background with bokeh city lights. A series of colorful bars representing a graph, each with. A series of colorful bars representing a graph, each with water droplets, illuminated by a spotlight against a dark background with blurred city lights
Free with trial Futuristic robotic hand analyzing and adjusting cost trends on a digital interface with graphs, percentages, and focus on accuracy in data visualization and business metrics. Glyphic. Analysis financial growth decrease illustrations Futuristic robotic hand analyzing and adjusting cost trends on a digital interface with graphs, percentages, and focus. On accuracy in data visualization and. Futuristic robotic hand analyzing and adjusting cost trends on a digital interface with graphs, percentages, and focus on accuracy in data visualization and business metrics. Glyphic.
Free with trial Black and white line graph comparing nominal and real return over time with axes labeled. Analysis financial growth decrease illustrations Black and white line graph showing nominal and real return over time chart nominal return. Black and white line graph comparing nominal and real return over time. Black and white line graph comparing nominal and real return over time with axes labeled
Free with trial A 3D rendered bar chart with bars in red, yellow, green, and blue, arranged in descending order of height. A thick black arrow curves downwards from the top left, crossing over the bars and pointing towards the bottom right, indicating a downward trend or decline. The image is set against a clean, white background. Analysis financial growth decrease illustrations Colorful Bar Chart Showing Downward Trend with Black Arrow on White Background graph. A 3D rendered bar chart with bars in red, yellow, green, and blue, arranged. A 3D rendered bar chart with bars in red, yellow, green, and blue, arranged in descending order of height. A thick black arrow curves downwards from the top left, crossing over the bars and pointing towards the bottom right, indicating a downward trend or decline. The image is set against a clean, white background
Free with trial Falling bar graph with downward arrows indicating decline or loss chart. Black bar graph with downward arrows indicating a decline or loss on a white background. Analysis financial growth decrease illustrations Falling bar graph with downward arrows indicating decline or loss chart. Black bar graph with downward arrows indicating a decline or loss on a white background
Free with trial Hands on Laptop with Graph Illustration Representing Cost Reduction in Business Finances with Dollar Symbols and Modern Digital Design Elements. Bitwise. Analysis financial growth decrease illustrations Hands on Laptop with Graph Illustration Representing Cost Reduction in Business Finances with Dollar Symbols and Modern. Digital Design Elements. Bitwise
Free with trial Two contrasting arrows, one green pointing up and one red pointing down, illustrate opposing trends in finance or business, set. Against a light blue background. Analysis financial growth decrease illustrations Two contrasting arrows, one green pointing up and one red pointing down, illustrate opposing trends in finance or business, set. Against a light blue background
Free with trial Collaborative Business Team Working on Cost Reduction Strategies with Visual Graphs and Finances in a Modern Office Space. Bitwise. Analysis financial growth decrease illustrations Collaborative Business Team Working on Cost Reduction Strategies with Visual Graphs and Finances in a Modern Office. Space. Bitwise
Free with trial Up and down directional arrows in vector format for versatile use. Perfect for business infographics and data visualization. EPS 10. Analysis financial growth decrease vectors Up and down directional arrows in vector format for versatile use. Perfect for business infographics and data visualization. EPS 10
Free with trial A black curve graph depicts a revenue slowdown on a white background. Clear details and vibrant colors enhance. Analysis financial growth decrease illustrations Black curve graph showing revenue slowdown on white background chart line. A black curve graph depicts a revenue slowdown on a white background. Clear details. A black curve graph depicts a revenue slowdown on a white background. Clear details and vibrant colors enhance
Free with trial This image presents a compelling visual representation of a global economic downturn. A prominent, three-dimensional white arrow dramatically plunges downward, superimposed on a world map rendered in dark, somber tones. The map serves as a backdrop to several red bar graphs, illustrating a decline in various economic indicators across different regions of the globe. The overall color scheme reinforces a sense of crisis and uncertainty. The arrow's sharp descent visually emphasizes the severity of the economic drop. Numerical data and graphical representations are included, further supporting the downward economic trend. Analysis financial growth decrease illustrations Global Economic Downturn Visualized with 3D Arrow and Charts. This image presents a compelling visual representation of a global economic downturn. A prominent. This image presents a compelling visual representation of a global economic downturn. A prominent, three-dimensional white arrow dramatically plunges downward, superimposed on a world map rendered in dark, somber tones. The map serves as a backdrop to several red bar graphs, illustrating a decline in various economic indicators across different regions of the globe. The overall color scheme reinforces a sense of crisis and uncertainty. The arrow's sharp descent visually emphasizes the severity of the economic drop. Numerical data and graphical representations are included, further supporting the downward economic trend.
Free with trial Minimalist 3D set of green upward and red downward arrows, isolated on a white background. Realistic glossy render for financial market analysis, stock trading indicators, profit and loss comparison. Analysis financial growth decrease vectors Minimalist 3D set of green upward and red downward arrows, isolated on a white background. Realistic glossy render for financial market analysis, stock trading
Free with trial A business professional uses a smartphone to analyze data trends displayed through digital charts and graphs, emphasizing technology in finance. Impute. Analysis financial growth decrease illustrations Business professional analyzing data trends on smartphone with digital charts and graphs in a dark office environment. A business professional uses a smartphone. A business professional uses a smartphone to analyze data trends displayed through digital charts and graphs, emphasizing technology in finance. Impute
Free with trial Two cardboard houses, one larger than the other, depict percentage increases in house prices, generated by AI. This visualization effectively communicates the impact of fluctuating real estate market values. Analysis financial growth decrease illustrations House Price Percentage Increase. Two cardboard houses, one larger than the other, depict percentage increases in house prices, generated by AI. This. Two cardboard houses, one larger than the other, depict percentage increases in house prices, generated by AI. This visualization effectively communicates the impact of fluctuating real estate market values.
Free with trial A striking and impactful collection of illustrations depicting a stock market crash with dramatic downward trend graphs. Analysis financial growth decrease vectors Stock market crash down graph illustration. A striking and impactful collection of illustrations depicting a stock market crash with dramatic downward trend. A striking and impactful collection of illustrations depicting a stock market crash with dramatic downward trend graphs
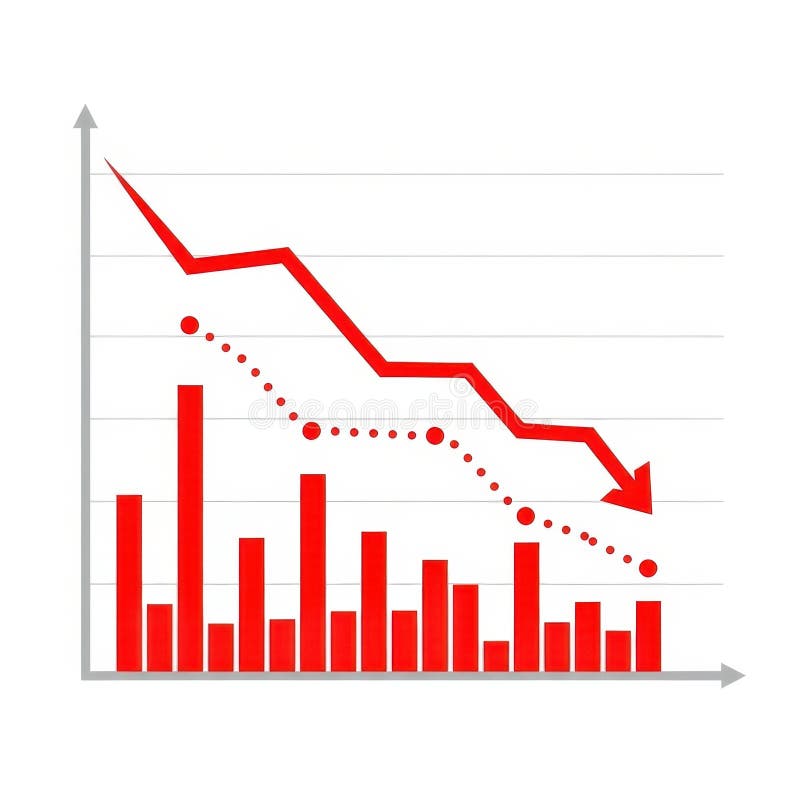
Free with trial A visual representation of negative financial performance. It features red bars and a red line graph showing a downward trend, accompanied by a dotted line indicating a similar pattern. Analysis financial growth decrease illustrations Red downward trending graph with bars and dotted line. A visual representation of negative financial performance. It features red bars and a red line graph. A visual representation of negative financial performance. It features red bars and a red line graph showing a downward trend, accompanied by a dotted line indicating a similar pattern
Free with trial Colorful bar charts illustrating positive and negative business trends from january to may provide a clear visual. Representation of performance. Analysis financial growth decrease vectors Colorful bar charts illustrating positive and negative business trends from january to may provide a clear visual. Representation of performance
Free with trial Colorful bar charts illustrating positive and negative business trends from january to may provide a clear visual. Representation of performance. Analysis financial growth decrease illustrations Colorful bar charts illustrating positive and negative business trends from january to may provide a clear visual. Representation of performance
Free with trial Futuristic Robot Hand Touching Cost Reduction Graph with Dollar Sign in Digital Environment Representing Innovation and Technology in Business Analytics. Bitwise. Analysis financial growth decrease illustrations Futuristic Robot Hand Touching Cost Reduction Graph with Dollar Sign in Digital Environment Representing Innovation and. Technology in Business Analytics
Free with trial Outline Simple Line Graph with Data Points and Axis Symbol. Analysis financial growth decrease vectors A simple, clean outline icon representing a line graph with distinct data points connected by a line, featuring a basic axis. This. Outline Simple Line Graph. Outline Simple Line Graph with Data Points and Axis Symbol
Free with trial Three DownwardPointing Arrows on a White Background. Three black arrows pointing downwards against a clean, bright white background. Generative AI. Analysis financial growth decrease illustrations Three DownwardPointing Arrows on a White Background. Three black arrows pointing downwards against a clean, bright white background. Generative AI
Free with trial Stock market profit with uptrend candle sticks and money coins. 3D render vector illustration, arrow and stacking coins on green background. Uptrend stock and crypto currency investment situation. Analysis financial growth decrease vectors Stock market profit with uptrend candle sticks and money coins. 3D render vector illustration, arrow and stacking coins. On green background. Uptrend stock and. Stock market profit with uptrend candle sticks and money coins. 3D render vector illustration, arrow and stacking coins on green background. Uptrend stock and crypto currency investment situation
Free with trial A collection of red and green arrows, some pointing up and others down, symbolizing market fluctuations and financial performance. Analysis financial growth decrease illustrations Upward and downward arrows representing market trends. A collection of red and green arrows, some pointing up and others down, symbolizing market fluctuations. A collection of red and green arrows, some pointing up and others down, symbolizing market fluctuations and financial performance
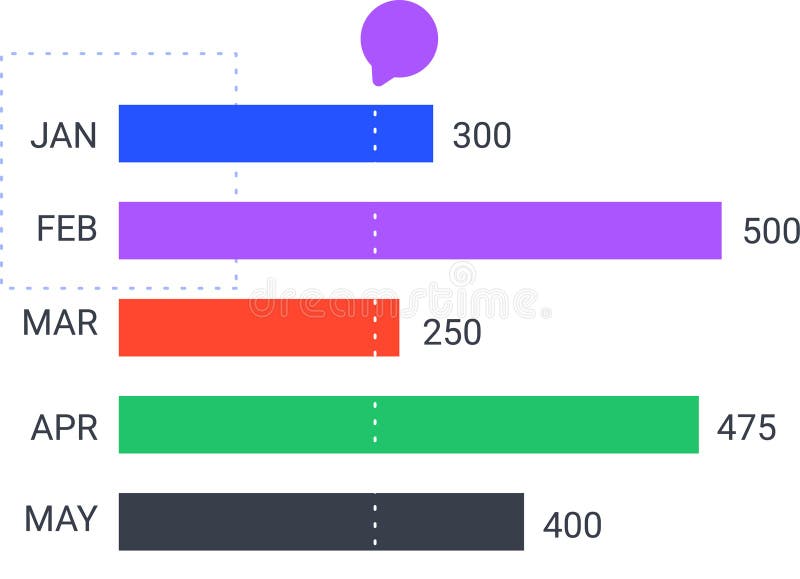
Free with trial Colorful horizontal bar chart is displaying monthly statistics from january to may, indicating trends and performance. With a speech bubble above. Analysis financial growth decrease vectors Colorful horizontal bar chart is displaying monthly statistics from january to may, indicating trends and performance. With a speech bubble above
Free with trial Colorful horizontal bar chart is displaying monthly statistics from january to may, indicating trends and performance. With a speech bubble above. Analysis financial growth decrease vectors Colorful horizontal bar chart is displaying monthly statistics from january to may, indicating trends and performance. With a speech bubble above
Free with trial A striking, three-dimensional number '7' is prominently displayed against a dark, gradient background. The numeral is rendered in a clean, modern style with sharp edges and a subtle highlight, suggesting depth and volume. The lighting creates a dramatic effect, with shadows cast on the background, emphasizing the numeral's presence. This image is ideal for concepts related to numbers, counting, achievements, rankings, or any context where the number seven holds significance. Analysis financial growth decrease illustrations Bold Number 7 Illuminated on Dark Gradient Background. A striking, three-dimensional number '7' is prominently displayed against a dark, gradient background. The. A striking, three-dimensional number '7' is prominently displayed against a dark, gradient background. The numeral is rendered in a clean, modern style with sharp edges and a subtle highlight, suggesting depth and volume. The lighting creates a dramatic effect, with shadows cast on the background, emphasizing the numeral's presence. This image is ideal for concepts related to numbers, counting, achievements, rankings, or any context where the number seven holds significance.
Free with trial Red paper with green arrow up. A close-up of paper cutouts, showing a red background and a declining green arrow. Analysis financial growth decrease illustrations Red paper with green arrow up. A close-up of paper cutouts, showing a red background and a declining green arrow
Free with trial A simple blue line graph with circular data points is displayed against a clean white background with subtle horizontal grid lines. The graph shows fluctuations and trends, making it suitable for representing data, analytics, or financial performance. Generated by AI. Analysis financial growth decrease vectors Blue Line Graph with Data Points on White Background. A simple blue line graph with circular data points is displayed against a clean white background with. A simple blue line graph with circular data points is displayed against a clean white background with subtle horizontal grid lines. The graph shows fluctuations and trends, making it suitable for representing data, analytics, or financial performance. Generated by AI
Free with trial Golden Key on Stock Market Candlestick Chart Background, Trading Success Concept. Metallic key floating before digital stock chart with red blue bars. Analysis financial growth decrease illustrations Golden Key on Stock Market Candlestick Chart Background, Trading Success Concept. Metallic key floating before digital stock chart with red blue bars
Free with trial 3D Orange Percentage Symbol with Subtle Gradient and Shadow. AI generated. Analysis financial growth decrease vectors 3D Orange Percentage Symbol with Subtle Gradient and Shadow. AI generated
Free with trial A collection of five distinct black and white graphic representations of data. From left to right, the first is a line graph with dots, showing fluctuations. The second is a zig-zag line graph with dots and an upward arrow. The third is a series of ascending vertical bars. The fourth is a bar chart with a single dot above one of the bars. The fifth is a pie chart divided into four sections, with. Analysis financial growth decrease vectors Collection of black and white business and data charts and graphs statistics analytics. A collection of five distinct black and white graphic representations of. A collection of five distinct black and white graphic representations of data. From left to right, the first is a line graph with dots, showing fluctuations. The second is a zig-zag line graph with dots and an upward arrow. The third is a series of ascending vertical bars. The fourth is a bar chart with a single dot above one of the bars. The fifth is a pie chart divided into four sections, with
Free with trial Minimalist 3D bar chart with colorful pastel blocks representing data on a clean white background. Analysis financial growth decrease illustrations Minimalist 3D bar chart with colorful pastel blocks representing data on a clean white background.
Free with trial 3D rendering of a business infographic chart showing a progressive decline over four periods. Red color on the 3D bar graph chart with an arrow on it. Analysis financial growth decrease illustrations 3D render of a business data in decline. 3D rendering of a business infographic chart showing a progressive decline over four periods. Red color on the 3D bar. 3D rendering of a business infographic chart showing a progressive decline over four periods. Red color on the 3D bar graph chart with an arrow on it.
Free with trial Abstract Black Bar Chart with Rounded Tops representing Data Visualization. Analysis financial growth decrease vectors A simple, abstract graphic displaying a series of black bars of varying heights with rounded tops, arranged on a horizontal line,. Abstract Black Bar Chart with. Abstract Black Bar Chart with Rounded Tops representing Data Visualization
Free with trial A businessman in a suit analyzes a digital graph showing declining profits and costs, holding a smartphone and a stylus. Analysis financial growth decrease illustrations Businessman Analyzing Declining Profits and Costs with Digital Graph. A businessman in a suit analyzes a digital graph showing declining profits and costs. A businessman in a suit analyzes a digital graph showing declining profits and costs, holding a smartphone and a stylus
Free with trial Simple Black Line Graph Icon with Wavy Trend Line and Axis. Analysis financial growth decrease vectors A minimalist black icon representing a line graph with fluctuating data points and clearly defined axis lines, suitable for. Simple Black Line Graph Icon with. Simple Black Line Graph Icon with Wavy Trend Line and Axis
Free with trial A 3D rendered bar chart composed of four colored blocks of varying heights. The blocks are blue, yellow, red, and white, arranged from shortest to tallest from left to right. The chart is presented on a clean white background, with subtle shadows beneath the blocks. Analysis financial growth decrease illustrations Colorful 3D Bar Chart with Varying Heights on a White Background graph statistics. A 3D rendered bar chart composed of four colored blocks of varying heights. A 3D rendered bar chart composed of four colored blocks of varying heights. The blocks are blue, yellow, red, and white, arranged from shortest to tallest from left to right. The chart is presented on a clean white background, with subtle shadows beneath the blocks
Free with trial Modern collection of business and finance elements. Contains data, charts,diagrams. Use it for presentation, report and infographic projects. Analysis financial growth decrease vectors Set of Business and Finance Infographic Elements on Transparent Background Vectors. Modern collection of business and finance elements. Contains data, charts. Modern collection of business and finance elements. Contains data, charts,diagrams. Use it for presentation, report and infographic projects
Free with trial Simple Black Isolated Device Displaying Bar Chart Graph. Analysis financial growth decrease vectors A simple, solid black icon representing a device screen displaying a bar chart graph with varying height bars indicating data. Simple Black Isolated Device. Simple Black Isolated Device Displaying Bar Chart Graph
Free with trial A black graph showing an upward trend with a curved arrow indicating a reversal on a white background. Analysis financial growth decrease illustrations Upward trending graph with a curved arrow indicating a reversal on white background. A black graph showing an upward trend with a curved arrow indicating a. A black graph showing an upward trend with a curved arrow indicating a reversal on a white background
Free with trial Circular dollar icons showing rising and falling currency values. Dollar Currency Up Down Icons. Redus and high costs line with dollar icons.. eps. Analysis financial growth decrease vectors Circular dollar icons showing rising and falling currency values. Dollar Currency Up Down Icons. Redus and high costs line with dollar icons..eps
Free with trial A laptop screen shows a sales funnel chart with declining percentages positioned next to a notebook mug and plant on a desk. Analysis financial growth decrease illustrations Laptop displaying sales funnel chart with decreasing percentages beside notebook mug and plant. A laptop screen shows a sales funnel chart with declining. A laptop screen shows a sales funnel chart with declining percentages positioned next to a notebook mug and plant on a desk
Free with trial Solid black vector icons representing business growth and market analysis. Set contains candlestick graphs, increase and decrease arrows, line charts, bar graphs, briefcase with pie chart, global commerce symbols, checklist with star, notification bell, and time based investment clock with coins. Analysis financial growth decrease illustrations Black silhouette business and financial market icons set for presentation and web design. Solid black vector icons representing business growth and market. Solid black vector icons representing business growth and market analysis. Set contains candlestick graphs, increase and decrease arrows, line charts, bar graphs, briefcase with pie chart, global commerce symbols, checklist with star, notification bell, and time based investment clock with coins
Free with trial A minimalist, flat design illustration of a bar chart featuring three vertical bars of varying heights. The bars are colored in orange, teal, and a lighter orange, set against a clean white background. This graphic represents data visualization, trends, and comparisons, suitable for business reports, educational materials, or web design elements. Analysis financial growth decrease illustrations Simple Bar Chart with Three Bars. A minimalist, flat design illustration of a bar chart featuring three vertical bars of varying heights. The bars are colored in. A minimalist, flat design illustration of a bar chart featuring three vertical bars of varying heights. The bars are colored in orange, teal, and a lighter orange, set against a clean white background. This graphic represents data visualization, trends, and comparisons, suitable for business reports, educational materials, or web design elements.
Free with trial This image shows a 3D bar graph, generated by AI, depicting a rise and subsequent fall in values. The red bars illustrate a peak, followed by a sharp decline, possibly representing a trend in data or market fluctuations. The visual is clean and easy to understand, highlighting the dramatic change i. Analysis financial growth decrease illustrations Red 3D Bar Graph. This image shows a 3D bar graph, generated by AI, depicting a rise and subsequent fall in values. The red bars illustrate a peak, followed by a. This image shows a 3D bar graph, generated by AI, depicting a rise and subsequent fall in values. The red bars illustrate a peak, followed by a sharp decline, possibly representing a trend in data or market fluctuations. The visual is clean and easy to understand, highlighting the dramatic change i
Free with trial Simple Handdrawn Line Graph Icon with Data Points and Axis. Analysis financial growth decrease vectors A minimalist, hand-drawn icon representing a line graph with clearly marked data points on a simple horizontal and vertical axis,. Simple Handdrawn Line Graph. Simple Handdrawn Line Graph Icon with Data Points and Axis
Free with trial A flat design illustration of two bar charts, one green and one red, both showing a downward trend with arrows, representing financial or business decline. Analysis financial growth decrease illustrations Bar chart showing declining trend isolated on white background. A flat design illustration of two bar charts, one green and one red, both showing a downward. A flat design illustration of two bar charts, one green and one red, both showing a downward trend with arrows, representing financial or business decline
Free with trial Minimalist Bold Line Percentage Down Arrow Symbol Interface Icon. Analysis financial growth decrease vectors A clean and simple graphic icon representing a downward arrow with a percentage sign, symbolizing financial reduction or discount. Minimalist Bold Line. Minimalist Bold Line Percentage Down Arrow Symbol Interface Icon
Free with trial A colorful bar chart with upward and downward arrows and various icons, representing data and analytics. Analysis financial growth decrease vectors Colorful Bar Chart with Downward Arrows and Icons graph data. A colorful bar chart with upward and downward arrows and various icons, representing data and. A colorful bar chart with upward and downward arrows and various icons, representing data and analytics
Free with trial Blue Glass 3D Bar Chart Showing Data Decline. Ai Generated. Analysis financial growth decrease illustrations Blue Glass 3D Bar Chart Showing Data Decline. Ai Generated
Free with trial Desktop Computer Display with Declining Trend Arrow Illustration. AI generated. Analysis financial growth decrease vectors Desktop Computer Display with Declining Trend Arrow Illustration. AI generated
Free with trial Woman's hands using a stylus on a tablet with a cost reduction graphic showing dollar coins descending. Analysis financial growth decrease illustrations Person using tablet and laptop with cost reduction graphic business finance. Woman's hands using a stylus on a tablet with a cost reduction graphic showing. Woman's hands using a stylus on a tablet with a cost reduction graphic showing dollar coins descending
Free with trial A globe sitting on top of a table next to a bar chart. A globe with a map of the world on it, sitting next to a set of orange bar graphs AI generated. Analysis financial growth decrease illustrations A globe sitting on top of a table next to a bar chart. A globe with a map of the world on it, sitting next to a set of orange bar graphs AI generated
Free with trial A blue umbrella shields a downward-trending red graph from falling red arrows under a stormy sky. The image suggests protection from market decline. Analysis financial growth decrease illustrations Blue Umbrella Protecting Downward-Trending Graph from Falling Red Arrows. A blue umbrella shields a downward-trending red graph from falling red arrows under a. A blue umbrella shields a downward-trending red graph from falling red arrows under a stormy sky. The image suggests protection from market decline
Free with trial A design featuring a central percentage sign flanked by up and down arrows representing fluctuation. Analysis financial growth decrease illustrations Mathematical percentage symbol depicted between two opposing directional arrows with fluctuation monochrome economics business. A design featuring a central. A design featuring a central percentage sign flanked by up and down arrows representing fluctuation
Free with trial Colorful bar graph with downward trend, business concept illustration. AI generated. Analysis financial growth decrease vectors Colorful bar graph with downward trend, business concept illustration. AI generated
 Sign in