Free with trial Falling financial indicators, business profits, investment fund, investments, reduction of monetary savings, budget planning, income fall concept. Illustration in paper cut art style. Arrow line decrease money graph vectors Falling financial indicators. Illustration in paper cut art style. Falling financial indicators, business profits, investment fund, investments, reduction of monetary savings, budget planning, income fall concept. Illustration in paper cut art style.
Free with trial Negative decreasing growth chart with cartoon rocket falling down as infographic. Symbol for decline, failure, decrease, stock market, business challenges and issues. Arrow line decrease money graph vectors Negative decreasing growth chart with cartoon rocket falling down as infographic
Free with trial Continuous one single line drawing Business chart loss schedule icon vector illustration concept. Arrow line decrease money graph vectors One line drawing Business chart loss concept. Continuous one single line drawing Business chart loss schedule icon vector illustration concept
Free with trial Vector banner infographics economic crisis. Editable stroke. Line icons stock market crash health unemployment recession economic bubble bank run inflation currency crisis. Arrow line decrease money graph vectors Vector banner infographics economic crisis. Editable stroke. Line icons stock market crash health unemployment recession economic
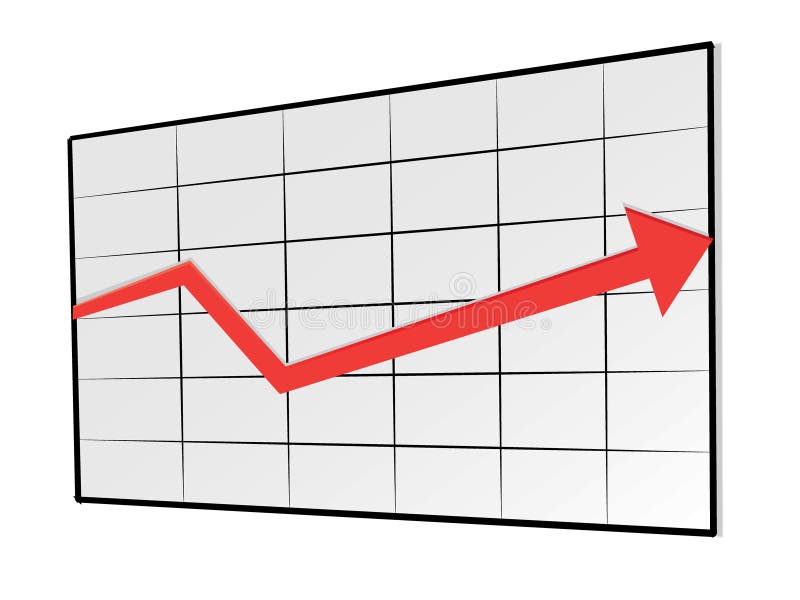
Free with trial Graph going up and down sign isolated vector illustration on white background. Arrow line decrease money graph vectors Graph going up and down sign isolated vector illustration. Graph going up and down sign isolated vector illustration on white background
Free with trial Profit fall in economic recession concept, inflation or interest rate falling down, decrease or reduction, stock market value loss, businessman holding money coin on percentage sign with falling down. Arrow line decrease money graph vectors Profit fall in economic recession concept
Free with trial Red Graph moving down on chart as recession or financial crisis 3d render, illustration. Arrow line decrease money graph illustrations Red Graph moving down on chart as recession or financial crisis
Free with trial Failure, red arrow going down on white background in business concept. 3d illustration. Arrow line decrease money graph illustrations Failure, red arrow going down on white background in business
Free with trial Continuous one single line drawing euro falling chart icon vector illustration concept. Arrow line decrease money graph vectors Continuous line drawing euro falling chart concept. Continuous one single line drawing euro falling chart icon vector illustration concept
Free with trial Vector : Decreasing business graph on red background. Arrow line decrease money graph vectors Decreasing business graph on red background
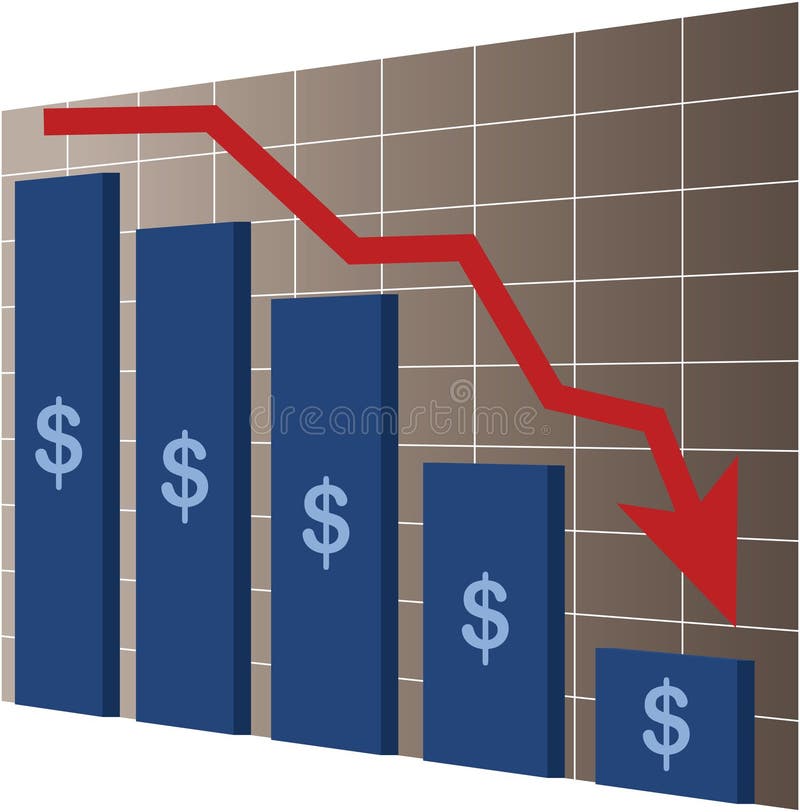
Free with trial Decline Graph, Chart with bars declining, Chart icon on white background. Arrow line decrease money graph vectors Decline Graph, Chart with bars declining, Chart icon
Free with trial Chart glyph icon, finance and banking, decrease sign, vector graphics, a solid pattern on a white background, eps 10. Arrow line decrease money graph vectors Chart glyph icon, finance and banking, decrease
Free with trial Vector illustration. Flat design. Declining graph. Arrow line decrease money graph illustrations Flat design. Declining graph.
Free with trial Red Graph moving down on chart as recession or financial crisis 3d render, illustration. Arrow line decrease money graph illustrations Red Graph moving down on chart as recession or financial crisis
Free with trial Crisis finance graph chart icon. Outline crisis finance graph chart vector icon for web design isolated on white background. Arrow line decrease money graph vectors Crisis finance graph chart icon, outline style. Crisis finance graph chart icon. Outline crisis finance graph chart vector icon for web design isolated on white background
Free with trial Decline Graph, Chart with bars declining, Chart icon on white background. Arrow line decrease money graph vectors Decline Graph, Chart with bars declining, Chart icon
Free with trial Graph chart with exponential decay bars and arrows on white background. 3d illustration. Arrow line decrease money graph illustrations Exponential decay decline statistical graph on white background. Graph chart with exponential decay bars and arrows on white background. 3d illustration
Free with trial Money Graphic Down icon. Monochrome design style from money collection. For UX and UI usage. Arrow line decrease money graph vectors Money Graphic Down icon. Monochrome design style from money collection. For UX and UI usage
Free with trial Downtrend arrow chart. Business Technological polygonal market Vector neon illustration. Low poly trend, data cash, finance concept. Connection lines, dots, wireframe mesh structure on blue background. Arrow line decrease money graph vectors Downtrend arrow chart. Business polygonal crisis market Vector neon. Low poly trend, data cash, finance concept. Downtrend arrow chart. Business Technological polygonal market Vector neon illustration. Low poly trend, data cash, finance concept. Connection lines, dots, wireframe mesh structure on blue background
Free with trial This abstract texture background graphic is high definition and a great quality pattern that can be used for various purposes. Arrow line decrease money graph illustrations Stock Market Crash of Red Arrow Graph Going Down Into Recession - Abstract Background Texture. This abstract texture background graphic is high definition and a great quality pattern that can be used for various purposes.
Free with trial Inflation icon line. Simple element economic crisis symbol for templates, web design and infographics. Arrow line decrease money graph vectors Inflation icon. Monochrome simple line Economic Crisis icon for templates, web design and infographics. Inflation icon line. Simple element economic crisis symbol for templates, web design and infographics.
Free with trial Rise icon in filled, thin line, outline and stroke style. Vector illustration of two colored and black rise vector icons designs can be used for mobile, ui, web. Arrow line decrease money graph vectors Rise icon in filled, thin line, outline and stroke style. Vector illustration of two colored and black rise vector icons designs
Free with trial Cashback, Money transfer and 24 hours icons simple set. Check investment, Income money and Download arrow signs. Success business, Shopping cart and Loan percent symbols. Line cashback icon. Vector. Arrow line decrease money graph vectors Cashback, Money transfer and 24 hours icons set. Check investment, Income money and Download arrow signs. Vector. Cashback, Money transfer and 24 hours icons simple set. Check investment, Income money and Download arrow signs. Success business, Shopping cart and Loan percent symbols. Line cashback icon. Vector
Free with trial Data analytics descending line graphic outline vector icon. Thin line black data analytics descending line graphic icon, flat vector simple element illustration from editable business concept isolated. Arrow line decrease money graph vectors Data analytics descending line graphic outline vector icon. Thin line black data analytics descending line graphic icon, flat
Free with trial Set of Russian Ruble symbols. Money tendency, capital protection with arrows of growth and downtrend. Low poly, wireframe 3d vector illustration. Abstract polygonal image on white origami background. Arrow line decrease money graph vectors Set of Russian Ruble symbols. Money tendency, capital protection with arrows of growth and downtrend. Low poly, wireframe 3d
Free with trial Stock Market Crash icon. Outline sign from economic crisis collection. Line Stock Market Crash icon for infographics, wed design and more. Arrow line decrease money graph vectors Stock Market Crash icon. Line element from economic crisis collection. Linear Stock Market Crash icon sign for web. Stock Market Crash icon. Outline sign from economic crisis collection. Line Stock Market Crash icon for infographics, wed design and more.
Free with trial Financial crisis illustration with bars and red arrow. Arrow line decrease money graph vectors Financial crisis
Free with trial Illustration of a Businessman pushing the Graph Up. Arrow line decrease money graph illustrations Businessman
Free with trial A black businessman with falling down chart is confused. Bankruptcy concept. Vector line design illustration. Horizontal layout with a text space. Arrow line decrease money graph vectors Bankruptcy
Free with trial A black businessman with falling down chart is confused. Bankruptcy concept. Vector line design illustration. Square layout. Arrow line decrease money graph vectors Bankruptcy
Free with trial Outline design icon with human head and black linear bitcoin cryptocurrency graph going down. Arrow line decrease money graph vectors Outline design icon with human head and black linear bitcoin cry
Free with trial Red chart Graph showing bear market with green Stop Loss line. Cut losses. Isolated on white. 3D render. Clipping path included. Arrow line decrease money graph illustrations Stop-loss order chart illustration. Red chart Graph showing bear market with green Stop Loss line. Cut losses. Isolated on white. 3D render. Clipping path included.
Free with trial Winner, Uv protection and Financial diagram line icons set. Timeline process infograph. Loan percent sign. Best results, Skin cream, Candlestick chart. Decrease rate. Business set. Vector. Arrow line decrease money graph vectors Winner, Uv protection and Financial diagram icons set. Loan percent sign. Vector. Winner, Uv protection and Financial diagram line icons set. Timeline process infograph. Loan percent sign. Best results, Skin cream, Candlestick chart. Decrease rate. Business set. Vector
Free with trial Positive projection chart vector illustration. Arrow line decrease money graph vectors Projection chart vector illustration
Free with trial Abstract image depicting rise and fall of foreign currency. Arrow line decrease money graph vectors Value of Foreign Currency. Abstract image depicting rise and fall of foreign currency.
Free with trial HODL - word in bitcoin trading market data on red background chart. Virtual cryptocurrency concept. Arrow line decrease money graph illustrations HODL - word in bitcoin trading market
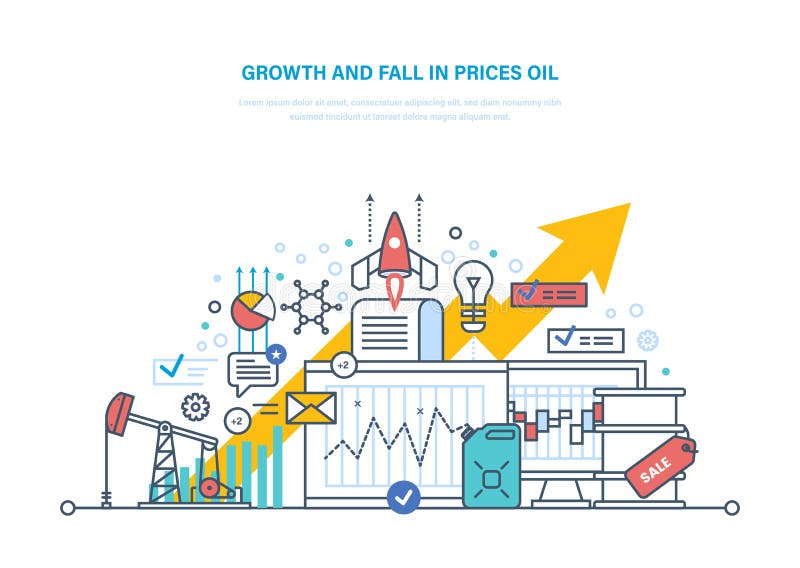
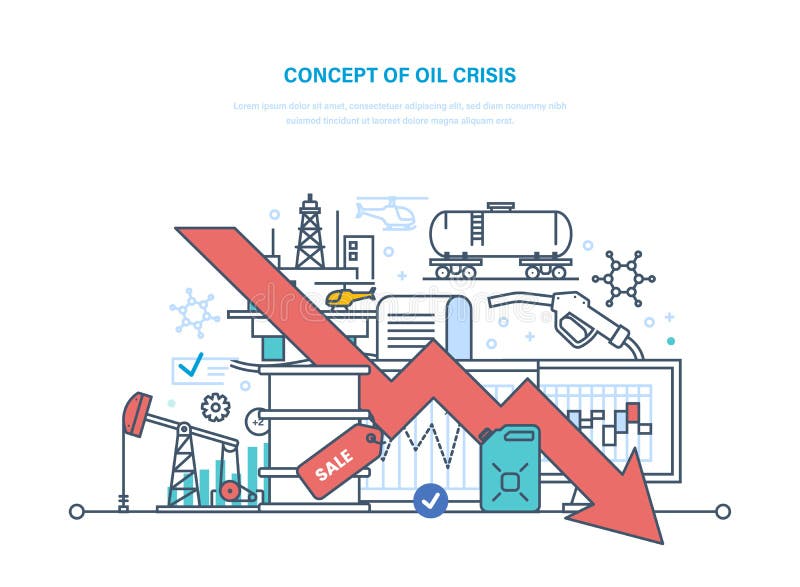
Free with trial Concept of oil crisis. Dynamics growth and fall in prices oil, sale. Oil industry, pipe, gasoline tank, industrial plant. Extraction and transportation of resources. Illustration thin line design. Arrow line decrease money graph vectors Oil crisis. Dynamics growth and fall in prices oil, sale.
Free with trial Concept of oil crisis. Oil industry, pipe, gasoline tank, industrial plant. Extraction and transportation of resources. Dynamics rise and fall prices, sale. Illustration thin line design. Arrow line decrease money graph vectors Concept of oil crisis. Dynamics rise and fall prices, sale. Concept of oil crisis. Oil industry, pipe, gasoline tank, industrial plant. Extraction and transportation of resources. Dynamics rise and fall prices, sale. Illustration thin line design.
Free with trial Multiple red graphs with different shaped arrowhead endings indicating negative trends. Arrow line decrease money graph vectors Arrows down. Multiple red graphs with different shaped arrowhead endings indicating negative trends
Free with trial A upward stock market trend. Arrow line decrease money graph illustrations Stock market
Free with trial Chart with bars declining on white background. Chart icon. chart icon for your web site design, logo, app, UI. flat style. Arrow line decrease money graph vectors Chart with bars declining on white background. Chart icon. chart icon for your web site design, logo, app, UI. flat style
Free with trial Reduction symbol of background, 3d render. Arrow line decrease money graph illustrations Reduction symbol of background, 3d
Free with trial The growth and decline concept with businessmen. Arrow line decrease money graph illustrations The growth and decline concept with businessmen
Free with trial Decreasing bars chart icon vector isolated on white background for your web and mobile app design, Decreasing bars chart logo concept. Arrow line decrease money graph vectors Decreasing bars chart icon vector sign and symbol isolated on white background, Decreasing bars chart logo concept. Decreasing bars chart icon vector isolated on white background for your web and mobile app design, Decreasing bars chart logo concept
Free with trial The business concept of both crisis and recovery. Arrow line decrease money graph illustrations The business concept of both crisis and recovery
Free with trial Discount, Presentation board and Bitcoin mining signs. Infographics timeline. Target, Check investment and Growth chart line icons set. Targeting, Business report, Diagram graph. Sale shopping. Vector. Arrow line decrease money graph vectors Target, Check investment and Growth chart icons set. Discount, Presentation board and Bitcoin mining signs. Vector. Discount, Presentation board and Bitcoin mining signs. Infographics timeline. Target, Check investment and Growth chart line icons set. Targeting, Business report, Diagram graph. Sale shopping. Vector
Free with trial Inflation colored round banner - Financial Crisis concept modern outline vector illustration. Arrow line decrease money graph vectors Inflation colored round banner - Financial Crisis concept outline vector illustration
Free with trial The businessman sliding down on chair in economic crisis concept. Arrow line decrease money graph illustrations The businessman sliding down on chair in economic crisis concept
Free with trial Illustration Vector Graphic of Red and Black Color Cartoon down trending icon. Arrow line decrease money graph illustrations Red and Black Color Cartoon down trending icon
Free with trial Infographic diagram declining trend bar chart,illustration can be used as template in presentation,web banner design,business, economy,statistic flyer and slide. Arrow line decrease money graph illustrations Infographic diagram declining trend bar chart,illustration can be used as template in presentation,web banner design,business
Free with trial Currency crisis line icon with color money and down arrow graph. Vector economy crisis, financial stock prices decrease, cost reduction and bankruptcy, money loss and business recession outline symbol. Arrow line decrease money graph vectors Currency crisis line icon, money down arrow graph. Currency crisis line icon with color money and down arrow graph. Vector economy crisis, financial stock prices decrease, cost reduction and bankruptcy, money loss and business recession outline symbol
Free with trial Stock market graph loss icon graphic vector line stroke outline art, negative decrease down trend chart arrow sign symbol pictogram, economy crash indicator image clipart. Arrow line decrease money graph vectors Stock market graph loss icon graphic vector line stroke outline art, negative decrease down trend chart arrow sign symbol
Free with trial Graph reduction with arrow down, line chart icon. Financial fall, decrease, fail. Statistics and analytics. Vector flat illustration. Arrow line decrease money graph vectors Graph reduction with arrow down, line chart icon. Financial fall, decrease, fail. Statistics and analytics. Vector illustration
Free with trial Graph growth with arrow up and reduction with arrow down, line chart icon. Financial invest, fall, increase and decrease. Statistics and analytics. Vector flat illustration. Arrow line decrease money graph vectors Graph growth with arrow up and reduction with arrow down, line chart icon. Financial invest, fall, increase and decrease
Free with trial Decline investment color line icon. Vector graph of cost reduction and financial decrease with down red arrow and money. Economy, business, finance crisis, stock market crash, bankruptcy outline sign. Arrow line decrease money graph vectors Decline investment arrow graph color line icon. Decline investment color line icon. Vector graph of cost reduction and financial decrease with down red arrow and money. Economy, business, finance crisis, stock market crash, bankruptcy outline sign
Free with trial Decline investment color line icon. Vector graph of cost reduction and financial decrease with down red arrow and money. Economy, business, finance crisis, stock market crash, bankruptcy outline sign. Arrow line decrease money graph illustrations Decline investment arrow graph color line icon. Decline investment color line icon. Vector graph of cost reduction and financial decrease with down red arrow and money. Economy, business, finance crisis, stock market crash, bankruptcy outline sign
Free with trial Yellow business trend line graph shows financial decline, revenue decrease with white arrow pointing downward, market fall concept. Arrow line decrease money graph illustrations Yellow business trend line graph shows financial decline, revenue decrease with white arrow pointing downward
Free with trial Financial problem color line icon with money and recession graph. Vector economic crisis, bankruptcy, money loss and poverty outline symbol with decline chart arrow, dollar currency bill and coins. Arrow line decrease money graph vectors Financial problem color line icon, money and graph. Financial problem color line icon with money and recession graph. Vector economic crisis, bankruptcy, money loss and poverty outline symbol with decline chart arrow, dollar currency bill and coins
Free with trial Percentage increase decrease arrow up down icon simple line stroke outline icon graphic set, money price cost loss growth sign symbol pictogram label, fund interest revenue rate results image. Arrow line decrease money graph vectors Percentage increase decrease arrow up down icon simple line stroke outline icon graphic set, money price cost loss growth sign
Free with trial Percentage increase decrease arrow up down icon simple line stroke outline icon graphic set, money price cost loss growth sign symbol pictogram label, fund interest revenue rate results image. Arrow line decrease money graph illustrations Percentage increase decrease arrow up down icon simple line stroke outline icon graphic set, money price cost loss growth sign
Free with trial Graph growth with arrow up and reduction with arrow down, line chart icon. Financial invest, fall, increase and decrease. Statistics and analytics. Vector flat illustration. Arrow line decrease money graph vectors Graph growth with arrow up and reduction with arrow down, line chart icon. Financial invest, fall, increase and decrease
Free with trial Steep downward trending line graph red arrow decrease devaluation Can be customized to fit various themes and styles. Arrow line decrease money graph illustrations Steep downward trending line graph, red arrow , decrease, devaluation. Steep downward trending line graph red arrow decrease devaluation Can be customized to fit various themes and styles
Free with trial Statistic graph progress, financial profit growth, increase and decrease line icons set. Infographic charts with arrow, circles and bars thin black and red outline symbols vector illustration. Arrow line decrease money graph vectors Statistic graph progress, financial profit growth, increase and decrease line icons set
Free with trial Global recession icon showing declining graph and downward arrow with globe and money, line art icon set. Arrow line decrease money graph vectors Global recession icon showing declining graph and downward arrow with globe and money, line art icon set
Free with trial Recession down loss arrows icon simple graphic line stroke and solid bold vector set, decrease negative graph shape silhouette logo, statistics low performance element image clip art. Arrow line decrease money graph vectors Recession down loss arrows icon simple graphic line stroke and solid bold vector set, decrease negative graph shape silhouette
Free with trial Oil price decrease graph color line icon with down arrows, barrels and drop of crude oil. Economic and energy industry crisis vector outline symbol, economy downturn, finance and business recession. Arrow line decrease money graph vectors Oil price decrease graph line icon, energy crisis. Oil price decrease graph color line icon with down arrows, barrels and drop of crude oil. Economic and energy industry crisis vector outline symbol, economy downturn, finance and business recession
Free with trial Up and down graph chart icon. Growth increase and decrease sign. Graph or diagram with arrow going up and down. Vector illustration. Arrow line decrease money graph illustrations Up and down graph chart icon. Growth increase and decrease sign. Graph or diagram with arrow going up and down. Vector
Free with trial Up and down graph chart icon. Growth increase and decrease sign. Graph or diagram with arrow going up and down. Vector illustration. Arrow line decrease money graph vectors Up and down graph chart icon. Growth increase and decrease sign. Graph or diagram with arrow going up and down. Vector
Free with trial A graphic illustration featuring a black jagged downward-pointing arrow overlapping a black Indian Rupee symbol and a decreasing line graph on a white background, symbolizing financial loss, market crash, and currency depreciation. Arrow line decrease money graph illustrations Black Downward Arrow with Indian Rupee Symbol and Declining Line Graph. A graphic illustration featuring a black jagged downward-pointing arrow overlapping a black Indian Rupee symbol and a decreasing line graph on a white background, symbolizing financial loss, market crash, and currency depreciation.
Free with trial An isolated graphic illustration featuring a red downward-trending jagged arrow overlapping an outlined Indian Rupee symbol and a decreasing line graph, symbolizing financial loss, market decline, and currency depreciation. Delivered with an alpha transparent background. Arrow line decrease money graph vectors Red Downward Arrow with Indian Rupee Symbol and Declining Line Graph Alpha Transparent. An isolated graphic illustration featuring a red downward-trending jagged. An isolated graphic illustration featuring a red downward-trending jagged arrow overlapping an outlined Indian Rupee symbol and a decreasing line graph, symbolizing financial loss, market decline, and currency depreciation. Delivered with an alpha transparent background.
Free with trial A simple and effective line graph illustrating the concept of debt reduction. The chart, on a clean white background, shows a green line trending downwards, representing a successful decrease in liabilities over time. A final red arrow emphasizes a significant or accelerated drop, symbolizing a successful financial strategy, cost-cutting, or achieving financial freedom. This vector illustration is perfect for presentations, articles, and infographics on personal or business finance, money management, and economic stability. Arrow line decrease money graph vectors Debt Reduction Concept Graph Showing Downward Trend. A simple and effective line graph illustrating the concept of debt reduction. The chart, on a clean white background, shows a green line trending downwards, representing a successful decrease in liabilities over time. A final red arrow emphasizes a significant or accelerated drop, symbolizing a successful financial strategy, cost-cutting, or achieving financial freedom. This vector illustration is perfect for presentations, articles, and infographics on personal or business finance, money management, and economic stability.
Free with trial Down graph chart arrow drop icon. Decrease downward vector market decrease down trend. Arrow line decrease money graph vectors Down graph chart arrow drop icon. Decrease downward vector market decrease down trend.
Free with trial Green arrow pointing downward on financial graph. Business chart with falling trend line. Digital stock market data visualization for investment analysis. Arrow line decrease money graph illustrations Green arrow pointing downward on financial graph. Business chart with falling trend line
Free with trial Cost reduction icon price lower arrow. Vector low cost money crisis line icon. Arrow line decrease money graph vectors Cost reduction icon price lower arrow. Vector low cost money crisis line icon
Free with trial Dollar arrow up and down icon on circle line. USD currency increase and decrease concept vector. Arrow line decrease money graph vectors Dollar arrow up and down icon on circle line. USD currency increase and decrease concept
Free with trial Red percentage symbol and downward arrow with graph line, minimalist style, white background, concept of decline or economic drop. 3D Rendering. Arrow line decrease money graph illustrations Red percentage symbol with downward arrow and graph line on white background. 3D Rendering. Red percentage symbol and downward arrow with graph line, minimalist style, white background, concept of decline or economic drop. 3D Rendering
Free with trial Decline bar chart with downward trend arrow outline icon vector. Decrease, loss, and financial drop symbol in circular line. Arrow line decrease money graph vectors Decline bar chart with downward trend arrow outline icon. Decrease, loss, and financial drop symbol in circular line
Free with trial Blue arrow pointing downward on a grid. Business graph with falling trend line. Digital stock market data visualization for investment analysis. Arrow line decrease money graph illustrations Blue arrow pointing downward on a grid. Business graph with falling trend line
Free with trial Red arrow pointing downward on a light background. Financial graph with falling trend line. Digital stock market data visualization for investment analysis. Arrow line decrease money graph illustrations Red arrow pointing downward on a light background. Financial graph with falling trend line
Free with trial Set line Hierarchy organogram chart Many ways directional arrow Graph diagram Dollar symbol Financial growth decrease Clock Intersection point and Arrow icon. Vector. Arrow line decrease money graph vectors Set line Hierarchy organogram chart, Many ways directional arrow, Graph, diagram, Dollar symbol, Financial growth. Set line Hierarchy organogram chart Many ways directional arrow Graph diagram Dollar symbol Financial growth decrease Clock Intersection point and Arrow icon. Vector.