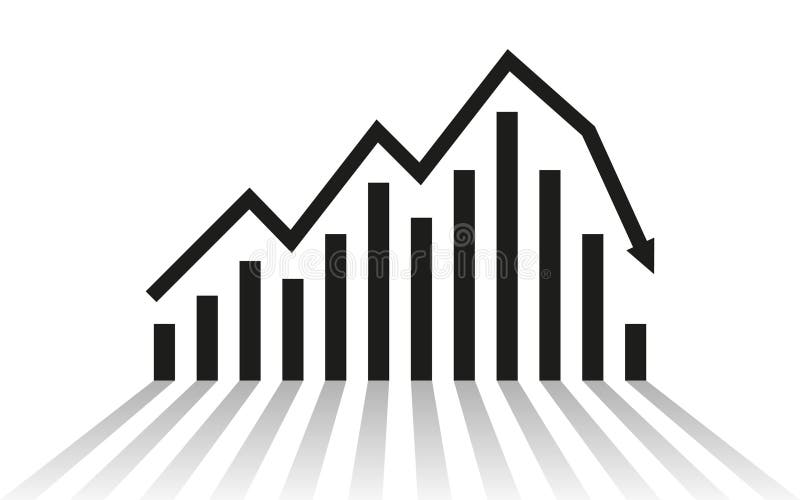
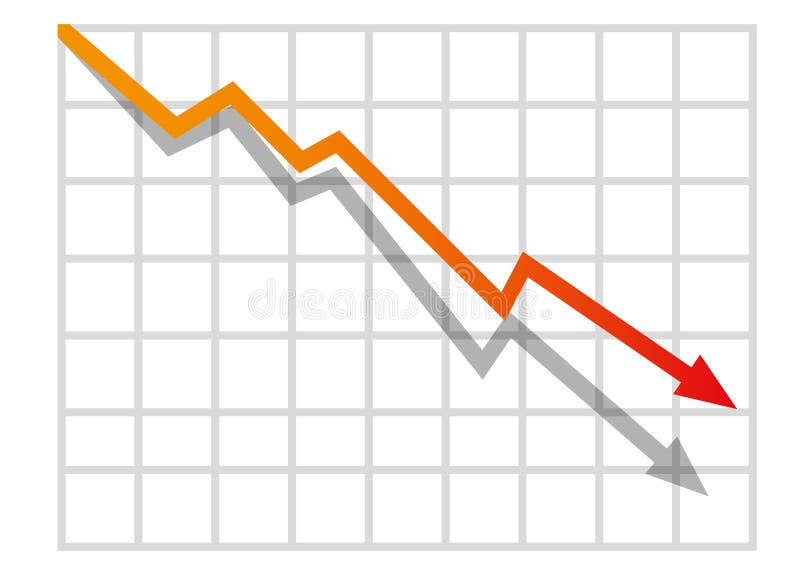
Free with trial Graph down. Black Icon graph decline with arrow isolated on white background. Hologram statistic. Deficit direction for business concept design. Analysis information forecast. Vector illustration. Arrow line decrease money graph vectors Graph down. Black Icon graph decline with arrow isolated on white background. Hologram deficit direction for business design. Graph down. Black Icon graph decline with arrow isolated on white background. Hologram statistic. Deficit direction for business concept design. Analysis information forecast. Vector illustration
Free with trial Line graph with a green line and a red dot on top. The red dot is located at the top left corner of the graph. Arrow line decrease money graph illustrations Graph with a green line and a red dot
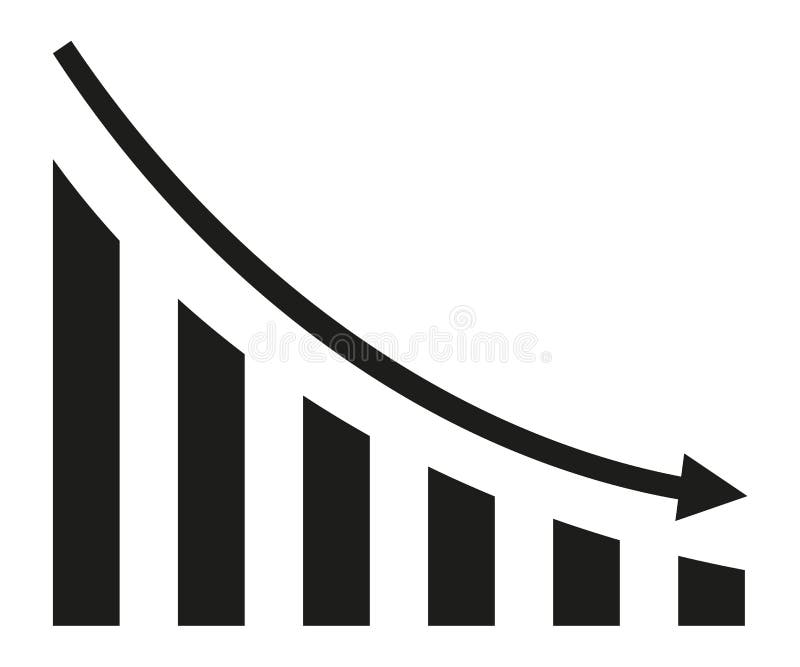
Free with trial Declining graph line icon, business and finance, chart sign vector graphics, a linear pattern on a white background, eps 10. Arrow line decrease money graph vectors Declining graph line icon, business and finance
Free with trial Growth vector icon. Graph or diagram with arrow going up and down. Vector illustration. Arrow line decrease money graph vectors Growth vector icon. Graph or diagram with arrow going up and down. Vector
Free with trial Cost reduction icon. Cost down concept. Businessman with hand lowers arrow of the graph. Vector illustration flat minimal line design. Isolated on background. Decrease down profit. Declining chart. Arrow line decrease money graph vectors Cost reduction icon. Cost down concept
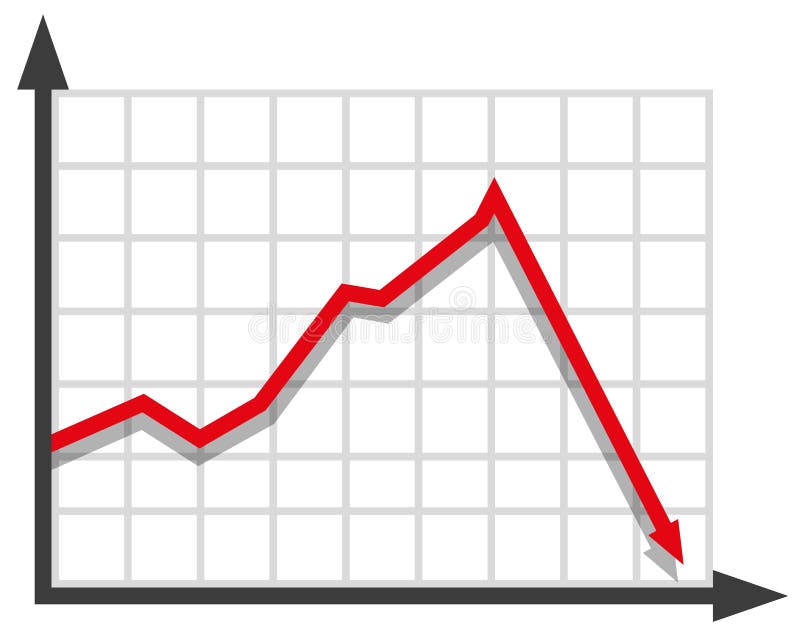
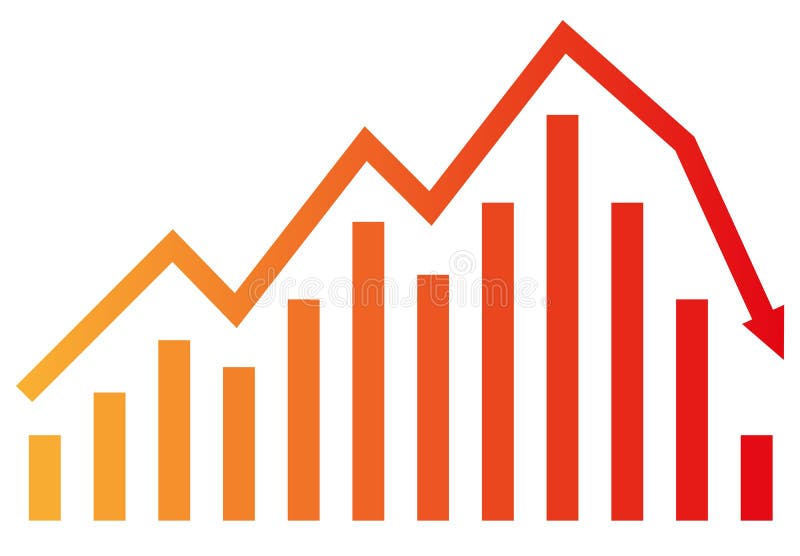
Free with trial Diagram with recession and bankruptcy. Graph with decrease report. Business and finance vector illustration. Arrow line decrease money graph vectors Diagram with recession and bankruptcy. Graph with decrease report. Business and finance vector
Free with trial Graph with decrease report. Diagram with recession and bankruptcy progress. Business and finance vector illustration. Arrow line decrease money graph vectors Graph with decrease report. Diagram with recession and bankruptcy progress. Business and finance
Free with trial Graph with decrease report. Diagram with recession and bankruptcy progress. Business and finance vector illustration. Arrow line decrease money graph vectors Graph with decrease report. Diagram with recession and bankruptcy progress. Business and finance
Free with trial Graph with decrease report. Diagram with recession and bankruptcy progress. Business and finance vector illustration. Arrow line decrease money graph vectors Graph with decrease report. Diagram with recession and bankruptcy progress. Business and finance
Free with trial Graph with decrease report. Diagram with recession and bankruptcy progress. Business and finance vector illustration. Arrow line decrease money graph vectors Graph with decrease report. Diagram with recession and bankruptcy progress. Business and finance
Free with trial Graph with decrease report. Diagram with recession and bankruptcy progress. Business and finance vector illustration. Arrow line decrease money graph vectors Graph with decrease report. Diagram with recession and bankruptcy progress. Business and finance
Free with trial Graph with decrease report. Diagram with recession and bankruptcy progress. Business and finance vector illustration. Arrow line decrease money graph vectors Graph with decrease report. Diagram with recession and bankruptcy progress. Business and finance
Free with trial Diagram with recession and bankruptcy progress. Graph with decrease report. Business and finance vector. Arrow line decrease money graph vectors Diagram with recession and bankruptcy progress. Graph with decrease report. Business and finance
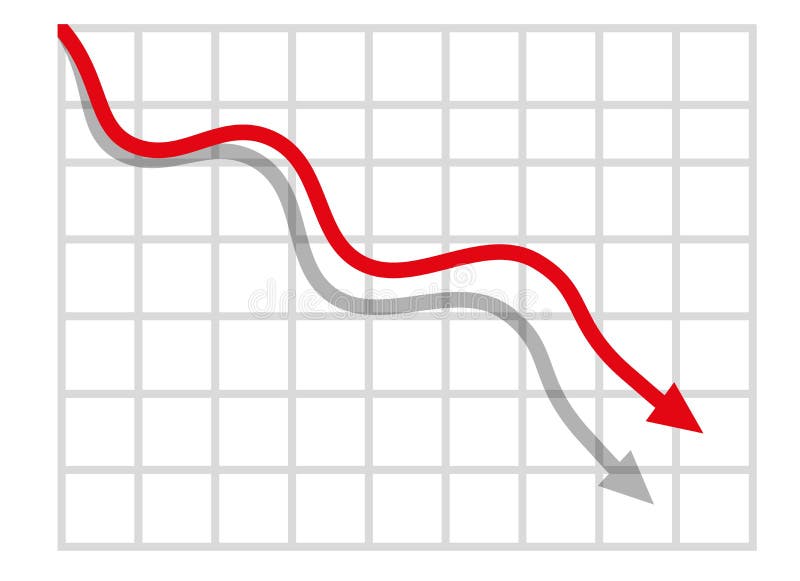
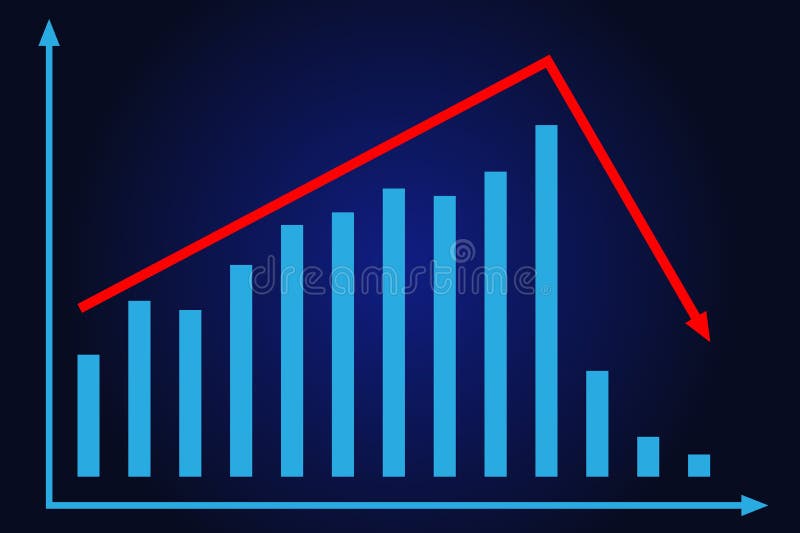
Free with trial Graph with covid decrease report. Diagram with coronavirus recession and bankruptcy progress. Vector illustration. Arrow line decrease money graph vectors Graph with covid decrease report. Diagram with coronavirus recession and bankruptcy progress
Free with trial Graph with covid decrease report. Diagram with coronavirus recession and bankruptcy progress. Vector illustration. Arrow line decrease money graph vectors Graph with covid decrease report. Diagram with coronavirus recession and bankruptcy progress
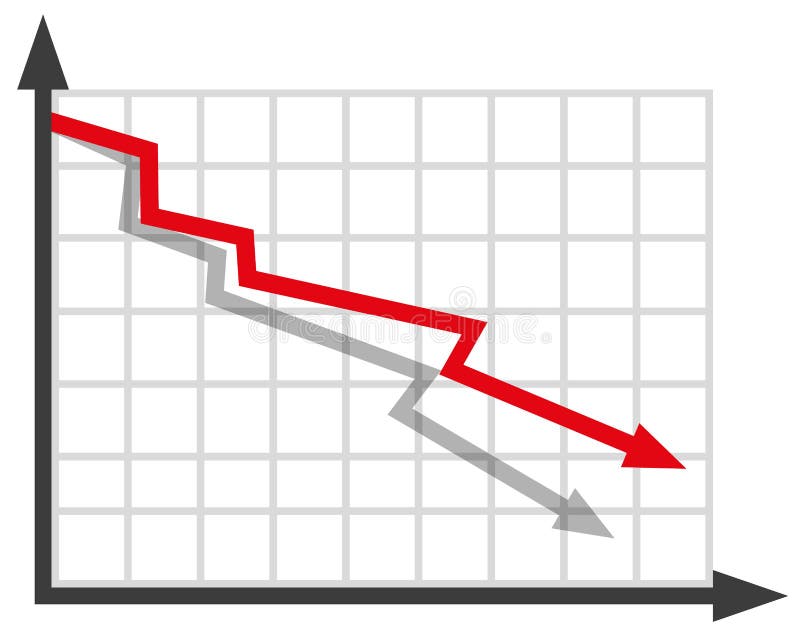
Free with trial Diagram with recession and bankruptcy progress. Graph with decrease report. Business and finance vector illustration. Arrow line decrease money graph vectors Diagram with recession and bankruptcy progress. Graph with decrease report. Business and finance vector
Free with trial Graph with decrease report. Diagram with recession and bankruptcy progress. Business and finance vector illustration. Arrow line decrease money graph vectors Graph with decrease report. Diagram with recession and bankruptcy progress. Business and finance vector
Free with trial Graph with decrease report. Diagram with recession and bankruptcy progress. Business and finance vector illustration. Arrow line decrease money graph vectors Graph with decrease report. Diagram with recession and bankruptcy progress. Business and finance vector
Free with trial Graph with decrease report. Diagram with recession and bankruptcy progress. Business and finance vector illustration. Arrow line decrease money graph vectors Graph with decrease report. Diagram with recession and bankruptcy progress. Business and finance vector
Free with trial Graph with decrease report. Diagram with recession and bankruptcy progress. Business and finance vector illustration. Arrow line decrease money graph vectors Graph with decrease report. Diagram with recession and bankruptcy progress. Business and finance vector
Free with trial Graph with decrease report. Diagram with recession and bankruptcy progress. Business and finance vector illustration. Arrow line decrease money graph vectors Graph with decrease report. Diagram with recession and bankruptcy progress. Business and finance vector
Free with trial Graph with decrease report. Diagram with recession and bankruptcy progress. Business and finance vector illustration. Arrow line decrease money graph vectors Graph with decrease report. Diagram with recession and bankruptcy progress. Business and finance vector
Free with trial Graph with decrease report. Diagram with recession and bankruptcy progress. Business and finance vector illustration. Arrow line decrease money graph vectors Graph with decrease report. Diagram with recession and bankruptcy progress. Business and finance vector
Free with trial Graph with decrease report. Diagram with recession and bankruptcy progress. Business and finance vector illustration. Arrow line decrease money graph vectors Graph with decrease report. Diagram with recession and bankruptcy progress. Business and finance vector
Free with trial Graph with decrease report. Diagram with recession and bankruptcy progress. Business and finance vector illustration. Arrow line decrease money graph vectors Graph with decrease report. Diagram with recession and bankruptcy progress. Business and finance vector
Free with trial Graph with decrease report. Diagram with recession and bankruptcy progress. Business and finance vector illustration. Arrow line decrease money graph vectors Graph with decrease report. Diagram with recession and bankruptcy progress. Business and finance vector
Free with trial Graph with decrease report. Diagram with recession and bankruptcy progress. Business and finance vector illustration. Arrow line decrease money graph vectors Graph with decrease report. Diagram with recession and bankruptcy progress. Business and finance vector
Free with trial Graph with decrease report. Diagram with recession and bankruptcy progress. Business and finance vector illustration. Arrow line decrease money graph vectors Graph with decrease report. Diagram with recession and bankruptcy progress. Business and finance vector
Free with trial Graph with decrease report. Diagram with recession and bankruptcy progress. Business and finance vector illustration. Arrow line decrease money graph vectors Graph with decrease report. Diagram with recession and bankruptcy progress. Business and finance vector
Free with trial Graph with decrease report. Diagram with recession and bankruptcy progress. Business and finance vector illustration. Arrow line decrease money graph vectors Graph with decrease report. Diagram with recession and bankruptcy progress. Business and finance vector
Free with trial Graph with decrease report. Diagram with recession and bankruptcy progress. Business and finance vector illustration. Arrow line decrease money graph vectors Graph with decrease report. Diagram with recession and bankruptcy progress. Business and finance vector
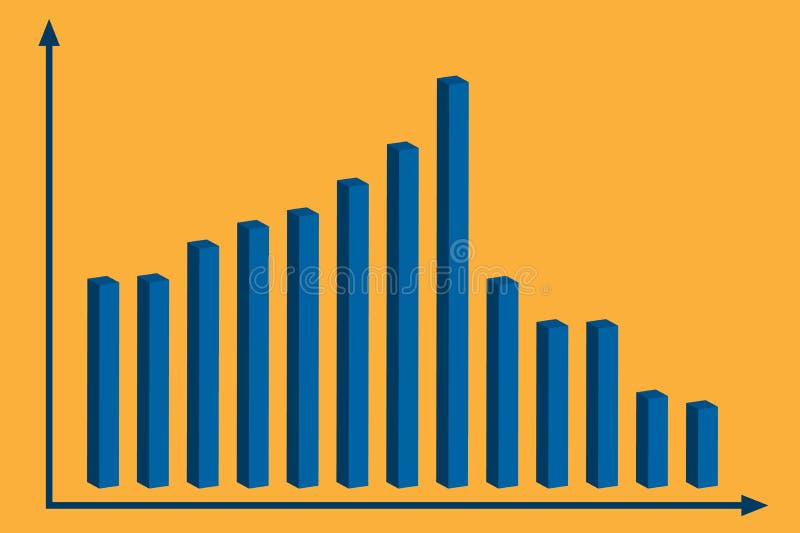
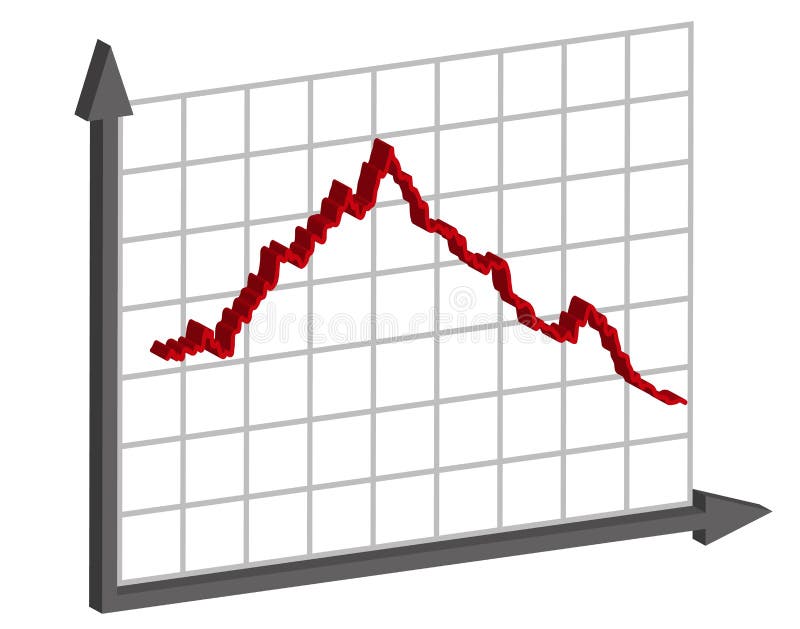
Free with trial 3d graph with decrease report. Diagram with recession and bankruptcy progress. Business and finance vector illustration. Arrow line decrease money graph vectors 3d graph with decrease report. Diagram with recession and bankruptcy progress. Business and finance vector
Free with trial 3d graph with decrease report. Diagram with recession and bankruptcy progress. Business and finance vector illustration. Arrow line decrease money graph vectors 3d graph with decrease report. Diagram with recession and bankruptcy progress. Business and finance vector
Free with trial 3d graph with decrease report. Diagram with recession and bankruptcy progress. Business and finance vector illustration. Arrow line decrease money graph vectors 3d graph with decrease report. Diagram with recession and bankruptcy progress. Business and finance vector
Free with trial 3d graph with decrease report. Diagram with recession and bankruptcy progress. Business and finance vector illustration. Arrow line decrease money graph vectors 3d graph with decrease report. Diagram with recession and bankruptcy progress. Business and finance vector
Free with trial Graph with decrease report. 3d diagram with recession and bankruptcy progress. Business and finance vector illustration. Arrow line decrease money graph vectors Graph with decrease report. 3d diagram with recession and bankruptcy progress. Business and finance vector
Free with trial Set line Dollar rate decrease, Global economic crisis, news and icon. Vector. Arrow line decrease money graph vectors Set line Dollar rate decrease, Global economic crisis, news and icon. Vector
Free with trial Growth vector icon. Graph or diagram with arrow going up and down. Vector illustration. Arrow line decrease money graph vectors Growth vector icon. Graph or diagram with arrow going up and down. Vector
Free with trial Up and down graph icon on black circle. Outline bar chart with uptrend and downtrend arrow symbol vector. Arrow line decrease money graph vectors Up and down graph icon on black circle. Outline bar chart with uptrend and downtrend arrow symbol
Free with trial Graph showing a line that is green and has a black background. The line is going up and to the right. Arrow line decrease money graph illustrations Graph showing a line that is green and has a black background
Free with trial Graph with a green arrow pointing upwards. The graph is labeled with numbers and the numbers are increasing. Arrow line decrease money graph illustrations Graph with a green arrow pointing upwards
Free with trial Graph going down and up sign with green and red arrows vector. Bar chart symbol icon with arrow moving down and sales bar chart with arrow moving up. Arrow line decrease money graph vectors Graph going down and up sign with green and red arrows vector. Bar chart symbol icon with arrow moving down and sales bar chart
Free with trial Arrow down and up percent outline icon on circle line. Percentage downward and upward arrows sign symbol vector. Arrow line decrease money graph vectors Arrow down and up percent outline icon on circle line. Percentage downward and upward arrows sign symbol
Free with trial This minimalist graphic illustration features a bold red line chart indicating a significant decline in value. The visual includes a currency symbol and bar segments set against a clean background to represent economic loss or market downturn. The sharp downward arrow emphasizes a negative trajectory in fiscal data and business analytics. Arrow line decrease money graph vectors A red line graph showing a downward trend in financial performance. This minimalist graphic illustration features a bold red line chart indicating a significant decline in value. The visual includes a currency symbol and bar segments set against a clean background to represent economic loss or market downturn. The sharp downward arrow emphasizes a negative trajectory in fiscal data and business analytics
Free with trial Set line Falling property prices, Dollar rate decrease, Global economic crisis and Safe icon. Vector. Arrow line decrease money graph vectors Set line Falling property prices, Dollar rate decrease, Global economic crisis and Safe icon. Vector
Free with trial Economic crisis line icon of graph going down, economy downturn and bankruptcy vector symbol. Stock exchange or economical index decrease linear icon of financial crisis and global economy recession. Arrow line decrease money graph vectors Economic crisis icon of economy graph going down. Economic crisis line icon of graph going down, economy downturn and bankruptcy vector symbol. Stock exchange or economical index decrease linear icon of financial crisis and global economy recession
Free with trial Illustration of a growing budget efficiency with a simple money bag closing tightly, a stylized downward-pointing cost arrow, and a stream of saved coins. Vector flat icon design on a white background for a cost control illustration --chaos 30 --ar 16:9 --v 7 Job ID: 35adf769-e45b-43cf-a8e7-0b2af69479b3. Arrow line decrease money graph illustrations Money Bag Downward Arrow, Financial Crisis, Economic Downturn, Falling Value. Illustration of a growing budget efficiency with a simple money bag closing tightly, a stylized downward-pointing cost arrow, and a stream of saved coins. Vector flat icon design on a white background for a cost control illustration --chaos 30 --ar 16:9 --v 7 Job ID: 35adf769-e45b-43cf-a8e7-0b2af69479b3
Free with trial Abstract Money Graph Vector Illustration. Arrow line decrease money graph vectors Abstract Money Graph Illustration. Abstract Money Graph Vector Illustration
Free with trial This image features a minimalist line graph with a red arrow pointing downwards, symbolizing a decline or loss. Below this, a detailed candlestick chart displays market volatility with fluctuating data points and numerical values on a dark background. The composition contrasts simple graphic design with intricate data visualization to represent economic downturns or negative performance metrics. Arrow line decrease money graph vectors A simple line graph showing a downward trend alongside a complex financial chart. This image features a minimalist line graph with a red arrow pointing downwards. This image features a minimalist line graph with a red arrow pointing downwards, symbolizing a decline or loss. Below this, a detailed candlestick chart displays market volatility with fluctuating data points and numerical values on a dark background. The composition contrasts simple graphic design with intricate data visualization to represent economic downturns or negative performance metrics
Free with trial Recession decrease chart line icon in simple design on a white background. Arrow line decrease money graph vectors Recession decrease chart line icon in simple design on a white background
Free with trial Economic crisis line icon of savings depreciation, economy downturn and bankruptcy, vector symbol. Banking business and money savings depreciation icon of piggy bank and arrow down of financial crisis. Arrow line decrease money graph vectors Economic crisis line icon of savings depreciation
Free with trial Stock and economic crisis graph background. Trade exchange, financial decrease, bed business strategy, digital asset, loss investment fund, online broker, stock collapse and crisis concept. Arrow line decrease money graph illustrations Stock and economic crisis graph background. Trade exchange, financial decrease
Free with trial Outline bar chart icon with upward and downward trend arrow. Uptrend and downtrend business graph symbol vector. Arrow line decrease money graph vectors Outline bar chart icon with upward and downward trend arrow. Uptrend and downtrend business graph symbol
Free with trial A graph with two lines, one red and one blue. The red line is higher than the blue line, indicating a positive trend. Arrow line decrease money graph vectors A graph with a red line and a blue line. A graph with two lines, one red and one blue. The red line is higher than the blue line, indicating a positive trend
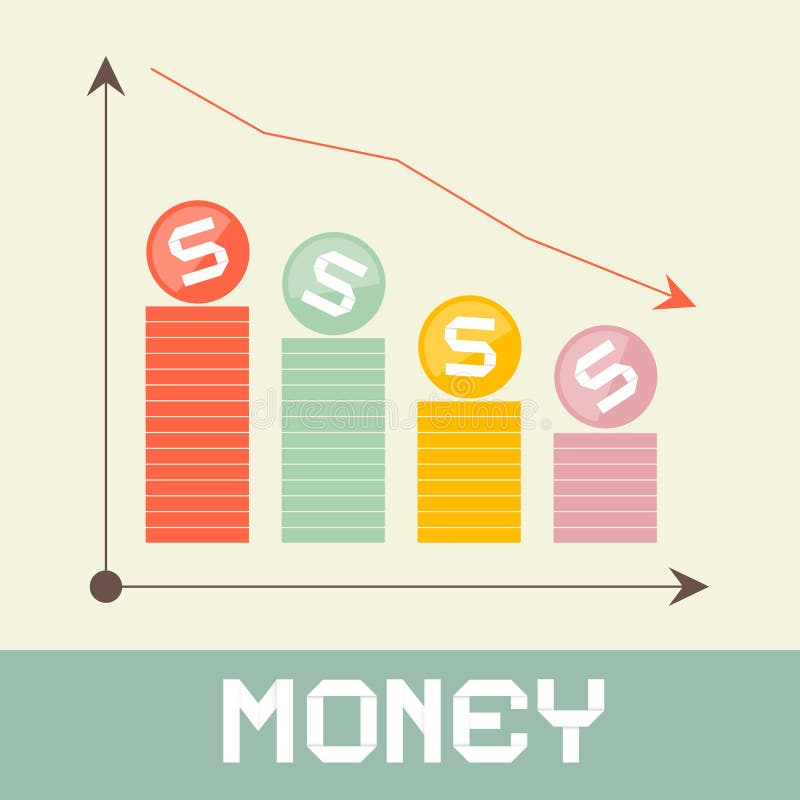
Free with trial Stacks of gold coins are arranged from tallest to shortest on a dark blue surface. Behind the coins, a white grid forms a graph. An orange line graph with an arrow at the end a sharp decline, starting from the left and moving downwards to the right. The background is a solid blue. Arrow line decrease money graph illustrations Stacks of gold coins with downward trending orange graph. Stacks of gold coins are arranged from tallest to shortest on a dark blue surface. Behind the coins, a white grid forms a graph. An orange line graph with an arrow at the end a sharp decline, starting from the left and moving downwards to the right. The background is a solid blue
Free with trial Growth vector icon. Graph or diagram with arrow going up and down. Vector illustration. Arrow line decrease money graph vectors Growth vector icon. Graph or diagram with arrow going up and down. Vector
Free with trial Graph with arrow going down on screen monitor PC. vector symbol. Arrow line decrease money graph illustrations Graph with arrow going down on screen monitor PC. vector symbol
Free with trial Economic crisis line icon of graph going down, economy downturn and bankruptcy vector symbol. Stock exchange or economical index decrease linear icon of financial crisis and global economy recession. Arrow line decrease money graph vectors Economic crisis icon of economy graph going down. Economic crisis line icon of graph going down, economy downturn and bankruptcy vector symbol. Stock exchange or economical index decrease linear icon of financial crisis and global economy recession
Free with trial The four wooden blocks with black letters spelling "COST" placed on of stacks of coins. Red arrows point downward from each block, indicating a decrease. A jagged red line graph with a downward trend is superimposed over the blocks, suggesting a decline in cost. The background is a blue gradient with shadows, and additional coins are scattered around the main stacks. Arrow line decrease money graph illustrations Wooden blocks spelling cost on coins with downward red arrow graph. The four wooden blocks with black letters spelling "COST" placed on of stacks of coins. Red arrows point downward from each block, indicating a decrease. A jagged red line graph with a downward trend is superimposed over the blocks, suggesting a decline in cost. The background is a blue gradient with shadows, and additional coins are scattered around the main stacks
Free with trial Conceptual image symbolizes a downward trend with golden arrow breaking through a silver line graph. This could represent economic decline, financial crisis, or a stock market crash. 3D rendering. Arrow line decrease money graph illustrations Downward Trend Arrow, Economic Decline, Stock Market Crash. Conceptual image symbolizes a downward trend with golden arrow breaking through a silver line graph. This could represent economic decline, financial crisis, or a stock market crash. 3D rendering.
Free with trial Businessman prevent arrow graph going down epsn10. Arrow line decrease money graph vectors Businessman prevent arrow graph going down
Free with trial Uptrend and downtrend arrow line icon illustration on black square. Arrow line decrease money graph vectors Uptrend and downtrend arrow line icon on black square. Uptrend and downtrend arrow line icon illustration on black square
Free with trial Uptrend and downtrend arrow line icon illustration on circle outline. Arrow line decrease money graph vectors Uptrend and downtrend arrow line icon on circle outline. Uptrend and downtrend arrow line icon illustration on circle outline
Free with trial Percent growth and decline arrow icon vector on black circle. Increase and decrease percentage concept. Arrow line decrease money graph vectors Percent growth and decline arrow icon on black circle. Increase and decrease percentage concept
Free with trial Decrease bar graph icon on black circle. Market crash illustration concept. Arrow line decrease money graph vectors Decrease bar graph icon on black circle. Market crash concept. Decrease bar graph icon on black circle. Market crash illustration concept
Free with trial Growth vector icon. Graph or diagram with arrow going up and down. Vector illustration. Arrow line decrease money graph vectors Growth vector icon. Graph or diagram with arrow going up and down. Vector
Free with trial Growth vector icon. Graph or diagram with arrow going up and down. Vector illustration. Arrow line decrease money graph vectors Growth vector icon. Graph or diagram with arrow going up and down. Vector
Free with trial Growth vector icon. Graph or diagram with arrow going up and down. Vector illustration. Arrow line decrease money graph vectors Growth vector icon. Graph or diagram with arrow going up and down. Vector
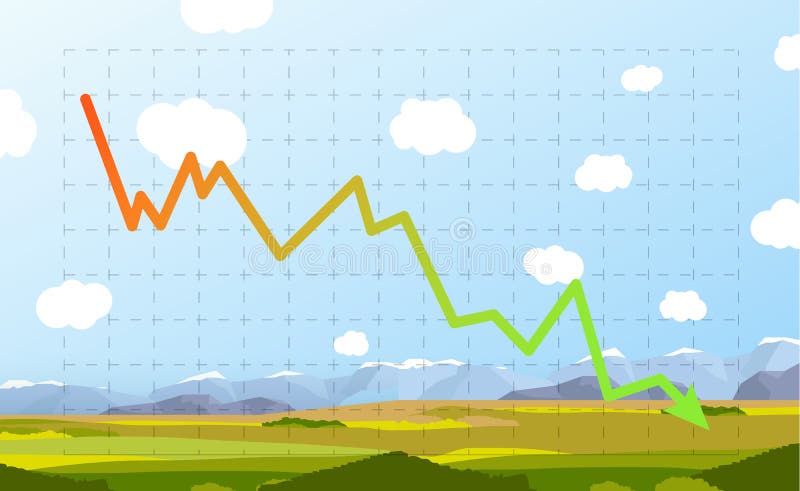
Free with trial Bright green and red decrease stocks graph on sunny nature landscape. Arrow line decrease money graph vectors Green and red decrease stocks graph on sunny nature landscape
Free with trial Euro money, Diagram graph and 3d chart signs. Bitcoin graph, Refresh bitcoin and Dot plot line icons set. Finance, Demand curve symbols. Cryptocurrency analytics, Update cryptocurrency. Vector. Arrow line decrease money graph vectors Bitcoin graph, Refresh bitcoin and Dot plot icons set. Euro money, Diagram graph and 3d chart signs. Vector. Euro money, Diagram graph and 3d chart signs. Bitcoin graph, Refresh bitcoin and Dot plot line icons set. Finance, Demand curve symbols. Cryptocurrency analytics, Update cryptocurrency. Vector
Free with trial Bar chart or bar graph decreasing vector icon with drop down arrow. Statistical data of stock, financial in business to loss, negative, decline or crisis. Graphic for report, presentation. 48x48 px. n. Arrow line decrease money graph vectors Bar chart or bar graph decreasing vector icon with drop down arrow. 48x48 pixel perfect and editable stroke. Bar chart or bar graph decreasing vector icon with drop down arrow. Statistical data of stock, financial in business to loss, negative, decline or crisis. Graphic for report, presentation. 48x48 px.n
Free with trial A stylized icon depicting a financial downturn, featuring a decreasing graph, falling arrow, stack of coins against a black background in a flat style. Arrow line decrease money graph vectors Financial Downturn Icon: Decreasing Graph, Falling Arrow, and Stack of Coins on Black Background. A stylized icon depicting a financial downturn, featuring a decreasing graph, falling arrow, stack of coins against a black background in a flat style.
Free with trial Glowing neon line Financial growth decrease icon isolated on red background. Increasing revenue. Vector. Arrow line decrease money graph illustrations Glowing neon line Financial growth decrease icon isolated on red background. Increasing revenue. Vector
Free with trial Graph going up and down sign with arrow vector illustration on white background. Arrow line decrease money graph vectors Graph going up and down sign with arrow vector illustration
Free with trial Bar chart or bar graph decreasing vector icon with drop down arrow. Statistical data of stock, financial in business to loss, negative, decline or crisis. Graphic for report, presentation. 48x48 px. n. Arrow line decrease money graph illustrations Bar chart or bar graph decreasing vector icon with drop down arrow. 48x48 pixel perfect and editable stroke. Bar chart or bar graph decreasing vector icon with drop down arrow. Statistical data of stock, financial in business to loss, negative, decline or crisis. Graphic for report, presentation. 48x48 px.n
Free with trial Businessman falling from the red graph chart arrow, bankruptcy concept. vector illustration. Arrow line decrease money graph vectors Businessman falling from the red graph chart arrow, bankruptcy concept. vector illustration.