Free with trial Line art business graphs set featuring financial growth and decline with dollar signs for economic performance. Art financial growth decrease vectors Line art business graphs set featuring financial growth and decline with dollar signs for economic performance
Free with trial Interest growth icon Black line art vector in black and white outline set collection sign. Art financial growth decrease vectors Financial Icon Illustrating Growth, Investment Success, and Economic Prosperity. Interest growth icon Black line art vector in black and white outline set collection sign
Free with trial Realistic financial graphs index number analysis business investment market economy and trading concept. Generative AI glowing lines and diagram on digital screen charts crypto data blur light line. Art financial growth decrease illustrations Trading market financial graphs and glowing lines diagram on digital neural network AI generated art. Realistic financial graphs index number analysis business investment market economy and trading concept. Generative AI glowing lines and diagram on digital screen charts crypto data blur light line
Free with trial Hand drawn line art illustration of financial analysis depicting growth and market trends for business strategy. Art financial growth decrease vectors Hand drawn line art illustration of financial analysis depicting growth and market trends for business strategy
Free with trial Set line Arrow, Infographic element, and Financial growth decrease. Glowing neon icon on brick wall. Vector. Art financial growth decrease illustrations Set line Arrow, Infographic element, and Financial growth decrease. Glowing neon icon on brick wall. Vector
Free with trial Set line Online shopping on screen Browser window setting and Financial growth decrease. Business infographic template. Vector. Art financial growth decrease vectors Set line Online shopping on screen, Browser window, setting and Financial growth decrease. Business infographic template
Free with trial Concept Abstract Art, Blue Watercolor, Financial Growth, Chart, Abstract Design Abstract Blue Watercolor Financial Growth Chart. Art financial growth decrease illustrations Abstract Blue Watercolor Financial Growth Chart. Concept Abstract Art, Blue Watercolor, Financial. Concept Abstract Art, Blue Watercolor, Financial Growth, Chart, Abstract Design Abstract Blue Watercolor Financial Growth Chart
Free with trial Set line Search engine, Mobile phone, Browser window and Financial growth decrease icon. Vector. Art financial growth decrease vectors Set line Search engine, Mobile phone, Browser window and Financial growth decrease icon. Vector
Free with trial Set Isometric line Binary code, Financial growth decrease, Processor CPU and Pie chart infographic icon. Vector. Art financial growth decrease illustrations Set Isometric line Binary code, Financial growth decrease, Processor CPU and Pie chart infographic icon. Vector
Free with trial Set line Pie chart infographic Pyramid infographics Light bulb Financial growth decrease Unknown search Arrow and Target icon. Vector. Art financial growth decrease vectors Set line Pie chart infographic, Pyramid infographics, Light bulb, Financial growth decrease, Unknown search, Arrow, and. Set line Pie chart infographic Pyramid infographics Light bulb Financial growth decrease Unknown search Arrow and Target icon. Vector.
Free with trial A set of hand-drawn financial graph and chart icons. These icons are suitable for business analysis, investment strategies, and economic growth presentations. Art financial growth decrease vectors Vector art of hand drawn financial graph and chart icons for business analysis, investment, and economic growth in vector format. A set of hand-drawn financial graph and chart icons. These icons are suitable for business analysis, investment strategies, and economic growth presentations
Free with trial Set Browser window Web developer programming code Financial growth decrease Server Data Secure your site with HTTPS SSL Magnifying glass check mark and incognito icon. Vector. Art financial growth decrease illustrations Set Browser window, Web developer programming code, Financial growth decrease, Server, Data, Secure your site with HTTPS. Set Browser window Web developer programming code Financial growth decrease Server Data Secure your site with HTTPS SSL Magnifying glass check mark and incognito icon. Vector.
Free with trial A set of linear icons depicting financial growth, including upward arrows, charts, and currency symbols, representing economic progress and investment trends on white. Art financial growth decrease vectors Vector art of financial growth icons a collection of symbols representing economic progress, investment, and market trends. A set of linear icons depicting financial growth, including upward arrows, charts, and currency symbols, representing economic progress and investment trends on white
Free with trial A sleek logo featuring the letter C integrated with chart bars, symbolizing financial growth and business analytics, suitable for finance or investment companies. Art financial growth decrease vectors Vector art of modern logo design with letter c and chart bars, representing financial growth and business success in a minimalist. A sleek logo featuring the letter C integrated with chart bars, symbolizing financial growth and business analytics, suitable for finance or investment companies
Free with trial Dollar Coins with Upward Arrows Representing Financial Growth in Minimalist Flat Style. Art financial growth decrease vectors Dollar Coins with Upward Arrows Representing Financial Growth in Minimalist Flat Style
Free with trial Dollar and bitcoin Coins with Upward Arrows Representing Financial Growth in Minimalist Flat Style. Art financial growth decrease vectors Dollar and bitcoin Coins with Upward Arrows Representing Financial Growth in Minimalist Flat Style
Free with trial Dollar Coins with Upward and Downward Arrows Representing Financial Growth and Decline in Minimalist Flat Style. Art financial growth decrease vectors Dollar Coins with Upward and Downward Arrows Representing Financial Growth and Decline in Minimalist Flat Style.
Free with trial Collection of business growth and financial analysis icons featuring bar charts and arrows with editable line art and flat shape style. Editable vector icon set. Art financial growth decrease vectors Collection of business growth and financial analysis icons featuring bar charts and arrows with editable line art and flat shape
Free with trial Illustration of a smartphone displaying financial charts and a stack of gold coins with dollar signs. Arrows circulate around the phone, suggesting a cycle of investment and growth. The image represents mobile banking, online trading, and the potential for financial success through digital platforms. Art financial growth decrease illustrations Mobile Investment and Financial Growth. Illustration of a smartphone displaying financial charts and a stack of gold coins with dollar signs. Arrows circulate around the phone, suggesting a cycle of investment and growth. The image represents mobile banking, online trading, and the potential for financial success through digital platforms.
Free with trial This 3D rendering shows a bar graph of increasing value, represented by white bars, alongside stacks of gold coins, visually depicting financial growth. The image was generated by AI, showcasing the potential of AI in visualizing financial data. Art financial growth decrease illustrations AI-Generated Financial Growth Chart. This 3D rendering shows a bar graph of increasing value, represented by white bars, alongside stacks of gold coins, visually depicting financial growth. The image was generated by AI, showcasing the potential of AI in visualizing financial data.
Free with trial A financial graph displays growth using stacked segments made from black tire treads. The graph is on a dark, textured surface that enhances the design. Art financial growth decrease illustrations Financial graph made of black rubber tire treads shows growth trend on a dark surface. A financial graph displays growth using stacked segments made from black tire treads. The graph is on a dark, textured surface that enhances the design
Free with trial A vibrant illustration of a bar graph with arrows, representing financial trends and market analysis. The image conveys economic performance and business insights. Art financial growth decrease vectors Vector art of colorful bar graph with arrows indicating growth and decline, symbolizing financial trends, market analysis, and. A vibrant illustration of a bar graph with arrows, representing financial trends and market analysis. The image conveys economic performance and business insights
Free with trial A decreasing bar graph with a downward arrow and coin, symbolizing financial loss and economic decline. This image represents negative growth and market downturns. Art financial growth decrease vectors Vector art of decreasing bar graph with a downward arrow and coin, symbolizing financial loss and economic decline, , indicating. A decreasing bar graph with a downward arrow and coin, symbolizing financial loss and economic decline. This image represents negative growth and market downturns
Free with trial This icon represents a financial transaction, showing money flow with arrows pointing both up and down, symbolizing the fluctuation of value in investments. Art financial growth decrease vectors Vector art of financial transaction icon, depicting money flow with arrows indicating both increase and decrease in value or. This icon represents a financial transaction, showing money flow with arrows pointing both up and down, symbolizing the fluctuation of value in investments
Free with trial A collection of hand-drawn, black and white icons representing growth, decline, and financial concepts. The set includes upward and downward arrows, percentage symbols, and a bar graph illustrating trends. The simple line art style makes these icons versatile for various applications, including presentations, infographics, and website design. They convey concepts of progress, success, loss, and market fluctuations. Art financial growth decrease illustrations Growth and Decline Icons Set. A collection of hand-drawn, black and white icons representing growth, decline, and financial concepts. The set includes upward and downward arrows, percentage symbols, and a bar graph illustrating trends. The simple line art style makes these icons versatile for various applications, including presentations, infographics, and website design. They convey concepts of progress, success, loss, and market fluctuations.
Free with trial This image showcases a striking 3D rendering featuring two sets of colorful bar graphs, one in shades of pink and the other in orange. These graphs are artfully embedded within wave-like, layered forms, creating a visually interesting contrast between the rigid geometry of the bars and the fluidity of the surrounding shapes. The graphs are positioned on separate, circular platforms, and a small, idyllic island with several evergreen trees sits between them, adding a touch of nature to the otherwise abstract composition. The overall aesthetic is minimalist and modern, suggesting a conceptual representation of financial growth within a natural context. Art financial growth decrease illustrations Abstract 3D Render of Financial Growth Represented by Colorful Bar Graphs Nestled in Stylized Landscapes. This image showcases a striking 3D rendering featuring two sets of colorful bar graphs, one in shades of pink and the other in orange. These graphs are artfully embedded within wave-like, layered forms, creating a visually interesting contrast between the rigid geometry of the bars and the fluidity of the surrounding shapes. The graphs are positioned on separate, circular platforms, and a small, idyllic island with several evergreen trees sits between them, adding a touch of nature to the otherwise abstract composition. The overall aesthetic is minimalist and modern, suggesting a conceptual representation of financial growth within a natural context.
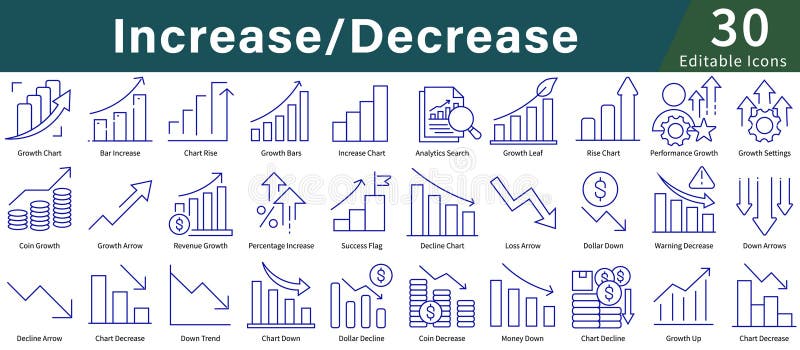
Free with trial Icons illustrating concepts of "Increase Decrease," using simple blue line art. Features include graphs and charts with upward and downward arrows, coins, dollar symbols, and percentage signs. Icons depict growth, decline, analytics, and performance tracking. Suitable for business, finance, or data analysis themes, these icons provide a visual representation of financial trends and statistics, making abstract concepts clear and easily understandable. The design is minimalistic and user-friendly, aimed at enhancing clarity in presentations and reports. Art financial growth decrease vectors Increase Decrease Icon Set in Line Style with Editable Vector for Growth, Analytics, Charts, and Data Visualization. Icons illustrating concepts of "Increase Decrease," using simple blue line art. Features include graphs and charts with upward and downward arrows, coins, dollar symbols, and percentage signs. Icons depict growth, decline, analytics, and performance tracking. Suitable for business, finance, or data analysis themes, these icons provide a visual representation of financial trends and statistics, making abstract concepts clear and easily understandable. The design is minimalistic and user-friendly, aimed at enhancing clarity in presentations and reports.
Free with trial A compilation of minimalist line art icons visually representing various financial concepts, including upward and downward market trends, investment growth, and economic indicators. Art financial growth decrease vectors Collection of line art icons representing financial growth and market trends, isolated on transparent background. A compilation of minimalist line art icons visually representing various financial concepts, including upward and downward market trends, investment growth, and economic indicators
Free with trial Abstract digital graph with orange and blue lines. Concept represents finance marketing business chart growth financial trading, data analysis tech currency statistic index trend. Art financial growth decrease illustrations Abstract digital graph with orange and blue lines. Concept represents finance marketing business chart growth financial trading
Free with trial Modern black and white vector icons showing financial trends, growth, decline, and exchange for business presentations or reports. Art financial growth decrease vectors Financial trend icons set vector illustration flat design. Modern black and white vector icons showing financial trends, growth, decline, and exchange for business presentations or reports
Free with trial Graphic bar chart illustrating business data analysis, financial statistics, and market trends with both positive growth and negative decline on a clean white background. Art financial growth decrease vectors Business financial graph showing increase and decrease. Graphic bar chart illustrating business data analysis, financial statistics, and market trends with both positive growth and negative decline on a clean white background
Free with trial Modern black and white vector icons depicting financial trends like rising, falling, and stable graphs, dollar signs, and investment arrows for business presentations and reports. Art financial growth decrease vectors Financial trend icons vector illustration showing profit loss growth and investment flat design. Modern black and white vector icons depicting financial trends like rising, falling, and stable graphs, dollar signs, and investment arrows for business presentations and reports.
Free with trial A vibrant, hand-drawn doodle illustration centered around a large percentage sign. This creative sketch features various financial and business icons, including bar graphs, pie charts, stacks of coins, dollar signs, and arrows indicating growth and decline. The colorful, cartoonish style makes it perfect for illustrating concepts like interest rates, economic trends, business analytics, and financial reports. Ideal for use in presentations, infographics, websites, and educational materials, this vector art is isolated on a white background for versatile application. Art financial growth decrease illustrations Finance and Economy Doodle Illustration. A vibrant, hand-drawn doodle illustration centered around a large percentage sign. This creative sketch features various financial and business icons, including bar graphs, pie charts, stacks of coins, dollar signs, and arrows indicating growth and decline. The colorful, cartoonish style makes it perfect for illustrating concepts like interest rates, economic trends, business analytics, and financial reports. Ideal for use in presentations, infographics, websites, and educational materials, this vector art is isolated on a white background for versatile application.
Free with trial A hand-drawn illustration featuring a large percentage symbol at the center, surrounded by various financial and business-related doodles. Icons include bar charts, pie charts, stacks of coins, a calculator, dollar signs, and numerous arrows indicating direction, flow, or change. The style is simple, black and white line art, suitable for representing concepts like finance, economics, growth, discounts, and business analysis. Art financial growth decrease illustrations Doodle Financial Icons and Percentage Symbol. A hand-drawn illustration featuring a large percentage symbol at the center, surrounded by various financial and business-related doodles. Icons include bar charts, pie charts, stacks of coins, a calculator, dollar signs, and numerous arrows indicating direction, flow, or change. The style is simple, black and white line art, suitable for representing concepts like finance, economics, growth, discounts, and business analysis.
Free with trial A dynamic collection of eight distinct dollar sign symbols, each uniquely rendered in a bold, grunge, and street art style. Featuring dripping ink effects, distressed textures, and halftone patterns, these black and white icons are integrated with various arrows depicting financial trends. The arrows illustrate upward growth, downward decline, and fluctuating market movements, conveying concepts of profit, loss, and economic change. This versatile set is perfect for modern designs related to finance, investment, business, and urban culture, suitable for web, print, and creative projects. Art financial growth decrease vectors Grunge Dollar Signs with Financial Trend Arrows Set. A dynamic collection of eight distinct dollar sign symbols, each uniquely rendered in a bold, grunge, and street art style. Featuring dripping ink effects, distressed textures, and halftone patterns, these black and white icons are integrated with various arrows depicting financial trends. The arrows illustrate upward growth, downward decline, and fluctuating market movements, conveying concepts of profit, loss, and economic change. This versatile set is perfect for modern designs related to finance, investment, business, and urban culture, suitable for web, print, and creative projects.
Free with trial A collection of line icons representing various financial concepts, including money, bitcoin, shopping, and business growth, all in a simple black and white design. Art financial growth decrease vectors Financial Icons Set with Money, Bitcoin, and Business Symbols. A collection of line icons representing various financial concepts, including money, bitcoin, shopping, and business growth, all in a simple black and white design
Free with trial Icons representing financial growth, decline, and trends. Perfect for business presentations and data visualization design. Art financial growth decrease illustrations Four business growth and decline bar chart icons with arrows. Icons representing financial growth, decline, and trends. Perfect for business presentations and data visualization design
Free with trial A house icon with a percentage symbol, representing mortgage interest rates and financial investments in property. Symbolizes real estate and economic growth. Art financial growth decrease vectors Vector art of house icon with percentage symbol representing mortgage interest rate, , symbolizing finance and property. A house icon with a percentage symbol, representing mortgage interest rates and financial investments in property. Symbolizes real estate and economic growth
Free with trial A stock market chart analysis with a downward trend arrow, illustrating financial decline, economic downturn, and investment risk in a clear visual manner. Art financial growth decrease vectors Vector art of stock market chart analysis with downward trend arrow indicating financial decline and economic downturn. A stock market chart analysis with a downward trend arrow, illustrating financial decline, economic downturn, and investment risk in a clear visual manner
Free with trial This image shows a balance scale with upward and downward arrows, symbolizing market trends, economic fluctuations, and financial equilibrium in the economy. Art financial growth decrease vectors Vector art of balance scale with upward and downward arrows, symbolizing market trends, economic fluctuations, and financial. This image shows a balance scale with upward and downward arrows, symbolizing market trends, economic fluctuations, and financial equilibrium in the economy
Free with trial A collection of simple, business and growth icons, perfect for financial reports, websites, or presentations on market trends and data. The set features a clean, minimal, thin line style. Art financial growth decrease vectors Simple business and growth icons set, thin line style, minimal vector illustration perfect for financial reports, websites, or pre. A collection of simple, business and growth icons, perfect for financial reports, websites, or presentations on market trends and data. The set features a clean, minimal, thin line style.
Free with trial A set of six line art icons illustrating financial concepts, including stacks of coins with upward and downward arrows, hands with falling coins, a banknote, and a coin. Art financial growth decrease vectors Finance Icons Money Growth Loss Savings Investment Cash Coins banknote. A set of six line art icons illustrating financial concepts, including stacks of coins with upward and downward arrows, hands with falling coins, a banknote, and a coin
Free with trial This image showcases a clear percentage symbol, representing financial rates, discounts, or mathematical proportions. It is designed in a minimalist style. Art financial growth decrease illustrations Vector art of clear percentage symbol, representing financial rates, discounts, or mathematical proportions in a minimalist style. This image showcases a clear percentage symbol, representing financial rates, discounts, or mathematical proportions. It is designed in a minimalist style
Free with trial This image shows a calculator with a dollar coin and arrows, symbolizing financial calculations, investments, and accounting on a blue background. Art financial growth decrease vectors Vector art of calculator with dollar coin and arrows indicating financial calculation, isolated on blue background it represents. This image shows a calculator with a dollar coin and arrows, symbolizing financial calculations, investments, and accounting on a blue background
Free with trial Businessman falls from a stack of coins. Financial crisis. Decrease in capital. Art financial growth decrease vectors Businessman falls from a stack of coins. Financial crisis. Decrease in capital.
Free with trial Line art financial icons set featuring a businessman with money and a decrease in funds for financial management. Art financial growth decrease vectors Line art financial icons set featuring a businessman with money and a decrease in funds for financial management
Free with trial A stark image of '7%' in black against a white backdrop, representing a financial percentage, possibly indicating a discount, interest rate, or statistical value. Art financial growth decrease vectors Vector art of, a bold black 7 with a subtle shadow, symbolizing a percentage or discount rate in a financial or promotional. A stark image of '7%' in black against a white backdrop, representing a financial percentage, possibly indicating a discount, interest rate, or statistical value
Free with trial This image illustrates market trends with arrows and graphs. It represents economic instability, showing both growth and decline, crucial for financial analysis. Art financial growth decrease vectors Vector art of illustration depicting fluctuating market trends with upward and downward arrows and bar graphs, , conveying. This image illustrates market trends with arrows and graphs. It represents economic instability, showing both growth and decline, crucial for financial analysis
Free with trial This image features financial analysis and cryptocurrency icons, including money, calculator, bear market, graphs, bitcoin, and a digital display, all in one place. Art financial growth decrease vectors Vector art of financial analysis and cryptocurrency icons, featuring money, calculator, bear market, graphs, bitcoin, and digital. This image features financial analysis and cryptocurrency icons, including money, calculator, bear market, graphs, bitcoin, and a digital display, all in one place
Free with trial This image displays financial performance indicators, highlighting data trends and market volatility. It represents economic analysis and strategic decision-making processes. Art financial growth decrease vectors Vector art of financial performance indicators, showcasing data trends, market volatility, and economic analysis for strategic. This image displays financial performance indicators, highlighting data trends and market volatility. It represents economic analysis and strategic decision-making processes
Free with trial This image represents financial loss with a graph showing a downward trend, symbolizing economic decline. A hand supports the graph, highlighting investment risks. Art financial growth decrease vectors Vector art of financial loss concept a hand supports a graph showing a downward trend, indicating economic decline and potential. This image represents financial loss with a graph showing a downward trend, symbolizing economic decline. A hand supports the graph, highlighting investment risks
Free with trial This illustration portrays money circulation with arrows around a dollar coin, symbolizing financial flow and economic activity in a dynamic system. Art financial growth decrease vectors Vector art of illustration depicting money circulation with arrows around a dollar coin, representing financial flow and economic. This illustration portrays money circulation with arrows around a dollar coin, symbolizing financial flow and economic activity in a dynamic system
Free with trial A grid of 28 simple black line art icons on a white background depicting various financial charts graphs and business related symbols including bar charts pie charts computers and money. Art financial growth decrease vectors Collection of 28 minimalist line art icons representing financial data charts and business concepts graph. A grid of 28 simple black line art icons on a white background depicting various financial charts graphs and business related symbols including bar charts pie charts computers and money
Free with trial A monitor displays a downward trending bar graph, symbolizing financial loss or economic decline. The visual representation emphasizes negative trends and potential risks. Art financial growth decrease vectors Vector art of monitor displaying a downward trending bar graph, indicating financial loss or economic decline. A monitor displays a downward trending bar graph, symbolizing financial loss or economic decline. The visual representation emphasizes negative trends and potential risks
Free with trial A financial report with bar graph and line chart is a visual tool for business data analysis, offering insights for presentation, review, and strategic decision-making. Art financial growth decrease vectors Vector art of financial report with bar graph and line chart, showing business data and analysis for presentation and review. A financial report with bar graph and line chart is a visual tool for business data analysis, offering insights for presentation, review, and strategic decision-making
Free with trial Stack of coins with percentage symbol black and white line art illustration representing financial discounts or interest. Art financial growth decrease vectors Stack of coins with percentage symbol black and white line art illustration representing financial discounts or interest
Free with trial This image depicts a pound coin with a downward arrow, symbolizing financial loss and economic downturn. It represents the challenges and uncertainties in the UK economy. Art financial growth decrease vectors Vector art of pound coin with downward arrow illustrating financial loss and economic downturn in the united kingdom economy. This image depicts a pound coin with a downward arrow, symbolizing financial loss and economic downturn. It represents the challenges and uncertainties in the UK economy
Free with trial Realistic financial graphs index number analysis business investment market economy and trading concept. Generative AI glowing lines and diagram on digital screen charts crypto data blur light line. Art financial growth decrease illustrations Trading market financial graphs and glowing lines diagram on digital neural network AI generated art. Realistic financial graphs index number analysis business investment market economy and trading concept. Generative AI glowing lines and diagram on digital screen charts crypto data blur light line
Free with trial Realistic financial graphs index number analysis business investment market economy and trading concept. Generative AI glowing lines and diagram on digital screen charts crypto data blur light line. Art financial growth decrease illustrations Trading market financial graphs and glowing lines diagram on digital neural network AI generated art. Realistic financial graphs index number analysis business investment market economy and trading concept. Generative AI glowing lines and diagram on digital screen charts crypto data blur light line
Free with trial Realistic financial graphs index number analysis business investment market economy and trading concept. Generative AI glowing lines and diagram on digital screen charts crypto data blur light line. Art financial growth decrease illustrations Trading market financial graphs and glowing lines diagram on digital neural network AI generated art. Realistic financial graphs index number analysis business investment market economy and trading concept. Generative AI glowing lines and diagram on digital screen charts crypto data blur light line
Free with trial Realistic financial graphs index number analysis business investment market economy and trading concept. Generative AI glowing lines and diagram on digital screen charts crypto data blur light line. Art financial growth decrease illustrations Trading market financial graphs and glowing lines diagram on digital neural network AI generated art. Realistic financial graphs index number analysis business investment market economy and trading concept. Generative AI glowing lines and diagram on digital screen charts crypto data blur light line
Free with trial Realistic financial graphs index number analysis business investment market economy and trading concept. Generative AI glowing lines and diagram on digital screen charts crypto data blur light line. Art financial growth decrease illustrations Trading market financial graphs and glowing lines diagram on digital neural network AI generated art. Realistic financial graphs index number analysis business investment market economy and trading concept. Generative AI glowing lines and diagram on digital screen charts crypto data blur light line
Free with trial Realistic financial graphs index number analysis business investment market economy and trading concept. Generative AI glowing lines and diagram on digital screen charts crypto data blur light line. Art financial growth decrease illustrations Trading market financial graphs and glowing lines diagram on digital neural network AI generated art. Realistic financial graphs index number analysis business investment market economy and trading concept. Generative AI glowing lines and diagram on digital screen charts crypto data blur light line
Free with trial Realistic financial graphs index number analysis business investment market economy and trading concept. Generative AI glowing lines and diagram on digital screen charts crypto data blur light line. Art financial growth decrease illustrations Trading market financial graphs and glowing lines diagram on digital neural network AI generated art. Realistic financial graphs index number analysis business investment market economy and trading concept. Generative AI glowing lines and diagram on digital screen charts crypto data blur light line
Free with trial Two drop and growth technology icon with gear. outline simple trend stats logotype graphic stroke art web design isolated on white. concept of key performance indicator or operation strategy symbol. Art financial growth decrease vectors Two drop and growth technology icon with gear
Free with trial Continuous one line art down graph chart icon flat style design isolated vector illustration on white background. Art financial growth decrease vectors Continuous one line art down graph chart icon flat style
Free with trial A clean black and white set of nine vector icons showing growth, decline, stability, and financial trends for business presentations and reports. Art financial growth decrease vectors Economic trend icons set flat design vector illustration. A clean black and white set of nine vector icons showing growth, decline, stability, and financial trends for business presentations and reports.
Free with trial A simple and clean line art icon of a graph, isolated on a white background. This vector illustration features a line chart with axes, showing a fluctuating trend with distinct data points. The minimalist design makes it perfect for various applications related to business, finance, and data analysis. Ideal for use in presentations, infographics, websites, mobile apps, and user interfaces to represent concepts like statistics, growth, market trends, performance reports, and financial analytics. A versatile symbol for progress and data visualization. Art financial growth decrease illustrations Analytics Line Graph Vector Icon. A simple and clean line art icon of a graph, isolated on a white background. This vector illustration features a line chart with axes, showing a fluctuating trend with distinct data points. The minimalist design makes it perfect for various applications related to business, finance, and data analysis. Ideal for use in presentations, infographics, websites, mobile apps, and user interfaces to represent concepts like statistics, growth, market trends, performance reports, and financial analytics. A versatile symbol for progress and data visualization.
Free with trial Monochrome Graphic Illustrating a Financial Decline or Discount. Art financial growth decrease vectors Percentage Rate Decrease Symbolized by a Downward Arrow Icon. Monochrome Graphic Illustrating a Financial Decline or Discount.
Free with trial A comprehensive collection of flat line design icons representing key concepts in business, finance, and data analytics. The set includes various charts (bar, line, pie), a speedometer, a magnifying glass with a graph, financial documents with checkmarks, a target with an arrow, a dollar sign, a percentage symbol, and directional arrows for growth and decline. These versatile vector elements are ideal for presentations, reports, websites, and applications focused on statistics, performance, strategy, and financial insights. Art financial growth decrease illustrations Business and Data Analytics Flat Line Icons Set. A comprehensive collection of flat line design icons representing key concepts in business, finance, and data analytics. The set includes various charts (bar, line, pie), a speedometer, a magnifying glass with a graph, financial documents with checkmarks, a target with an arrow, a dollar sign, a percentage symbol, and directional arrows for growth and decline. These versatile vector elements are ideal for presentations, reports, websites, and applications focused on statistics, performance, strategy, and financial insights.
Free with trial Hand drawn 3d isometric illustration showing a blue Indian rupee currency coin next to a yellow decreasing bar chart and a downward pointing arrow on an alpha transparent background, depicting financial decline and economic recession. Art financial growth decrease vectors 3D isometric doodle of Indian rupee coin with negative growth bar chart alpha transparent. Hand drawn 3d isometric illustration showing a blue Indian rupee currency coin next to a yellow decreasing bar chart and a downward pointing arrow on an alpha transparent background, depicting financial decline and economic recession.
Free with trial A glowing neon red bar chart shows a significant downward trend, symbolizing financial loss or negative growth on a black backdrop. Art financial growth decrease illustrations Neon red bar chart illustrating a steep decline in financial performance against a dark background. A glowing neon red bar chart shows a significant downward trend, symbolizing financial loss or negative growth on a black backdrop
Free with trial A clean, minimalist icon representing the stock market. The image features a bull and a bear, symbolizing market trends, with a rising green arrow indicating an upward trend. The design is enclosed in a circular frame, suitable for financial reports, investment presentations, or business infographics. The simple line art style makes it versatile for various applications. Art financial growth decrease illustrations Stock Market Bull and Bear Trend Icon. A clean, minimalist icon representing the stock market. The image features a bull and a bear, symbolizing market trends, with a rising green arrow indicating an upward trend. The design is enclosed in a circular frame, suitable for financial reports, investment presentations, or business infographics. The simple line art style makes it versatile for various applications.
Free with trial A simple line art icon of a decreasing bar chart with a trend arrow, representing negative growth or loss in business. Art financial growth decrease vectors Line Art Outline Decreasing Bar Chart Trend Arrow Business Icon. A simple line art icon of a decreasing bar chart with a trend arrow, representing negative growth or loss in business.
Free with trial A flat design vector illustration depicting a financial market data board or stock ticker. The black-bordered display features various stock symbols, numerical values like '$ ,80K', '$ ,22,50', and indicators of market performance. Prominently highlighted in red is the word 'LOSING', accompanied by a red downward arrow signifying a price drop, and a red downward triangle. Conversely, a green upward arrow indicates a price increase. This icon effectively visualizes concepts of financial loss, gain, market volatility, and investment trends, suitable for business, finance, and economic content. Art financial growth decrease illustrations Financial Market Data Board Icon with Loss and Gain Indicators. A flat design vector illustration depicting a financial market data board or stock ticker. The black-bordered display features various stock symbols, numerical values like '$ ,80K', '$ ,22,50', and indicators of market performance. Prominently highlighted in red is the word 'LOSING', accompanied by a red downward arrow signifying a price drop, and a red downward triangle. Conversely, a green upward arrow indicates a price increase. This icon effectively visualizes concepts of financial loss, gain, market volatility, and investment trends, suitable for business, finance, and economic content.
Free with trial A clean and minimalist black outline icon of a percentage symbol, isolated on a pure white background. This versatile graphic represents discounts, sales, interest rates, financial calculations, and statistical data. Ideal for web design, mobile applications, business presentations, marketing materials, infographics, and educational content. Its simple, modern aesthetic makes it perfect for conveying concepts of proportion, growth, and change in a clear and concise manner. Art financial growth decrease illustrations Minimalist Percentage Symbol Outline Icon. A clean and minimalist black outline icon of a percentage symbol, isolated on a pure white background. This versatile graphic represents discounts, sales, interest rates, financial calculations, and statistical data. Ideal for web design, mobile applications, business presentations, marketing materials, infographics, and educational content. Its simple, modern aesthetic makes it perfect for conveying concepts of proportion, growth, and change in a clear and concise manner.
Free with trial A seamless pattern of shiny golden percentage (%) symbols arranged in a grid on a light, gradient background. The 3D rendered symbols have a metallic sheen and cast subtle shadows, creating a sense of depth and luxury. This abstract background is ideal for financial, marketing, or sale-related themes, conveying concepts of discounts, interest rates, or economic growth. Art financial growth decrease illustrations Golden Percentage Symbols Pattern Background. A seamless pattern of shiny golden percentage (%) symbols arranged in a grid on a light, gradient background. The 3D rendered symbols have a metallic sheen and cast subtle shadows, creating a sense of depth and luxury. This abstract background is ideal for financial, marketing, or sale-related themes, conveying concepts of discounts, interest rates, or economic growth.
Free with trial Set Browser window Graph chart infographic Cloud technology data transfer upload Mobile phone incognito and Financial growth decrease icon. Vector. Art financial growth decrease illustrations Set Browser window, Graph chart infographic, Cloud technology data transfer, upload, Mobile phone, incognito and. Set Browser window Graph chart infographic Cloud technology data transfer upload Mobile phone incognito and Financial growth decrease icon. Vector.